About Discovery Manager
The Discovery Manager is where the user can see how the Azure
components are configured in order to pass data through the IoT Gateway
and being transferred to IFS back-end systems. It is what happens before the
business optimization and it’s a step after the devices and communications
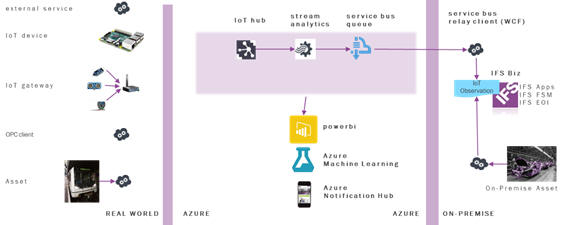
are connected with for example sensors. As seen in the picture below the customers
also can add PowerBI, Azure Machine Learning and Azure Notification Hub to the
Discovery environment. The data generated by devices/assets should be gathered
and processed somewhere using suitable techniques. The best place for this purpose
is the cloud. Given that we choose a global cloud provider (Microsoft Azure),
the storage and processing medium will be easily scalable and globally available
around the clock. All of the processing in Azure is done within a private Azure
subscription. This means that access to and management of these services is
shielded. The only end-points open for inbound access from the Internet are
the ports needed for IoT Hub. These services expose a REST API
which in turn is protected by a shared key, which is held inside the private
Azure subscription. Access to the Azure REST API is protected by use of Https
and by use of this shared key. No openings are required at the other end of
the architecture inside on premise network zone. The IoT Gateway
communicates outbound to the Service Bus Queue, located inside
the same private Azure subscription, on ports 9350-9353. If those are blocked
it will retry on port 443 or 80. You can preset these parameters in the configuration
file. During installation of IFS IoT Controller a dedicated user, “IFS_IOT_GATEWAY”
is created for the purpose of sending data from IoT Gateway to
IFS Cloud, and given only those permissions that are needed. The credentials
for this user are stored on the same server as the IoT Gateway.

1. IoT Hub
The first step of the Discovery Manager is the IoT Hub. The IoT Hub is a bi-directional communication medium for IoT and the main entrance for data coming in to the Discovery environment. It accepts json formatted string data and can be accessed using standard protocols including HTTP, Advanced Message Queuing Protocol (AMQP) and MQ Telemetry Transport (MQTT). It is even possible to provide support for custom protocols. On the security side it provides per-device authentication and secure connectivity and it can scale to millions of simultaneously connected devices and millions of events per second. Microsoft provides SDKs for .NET, C, Node.js and Java to connect to an IoT Hub on the device side. It is even possible to implement a standard HTTP REST API for your own choice of programming language.
2. Stream Analytics
Stream Analytics (SA) is a real-time stream processing platform in the Azure cloud and is the second step in the Discovery Manager. The calculations on the stream of data from an IoT Hub can be done in an SQL like, Stream Analytics Query Language. The user can also filter the data coming into Stream Analytics to limit the number of observations in the IFS back-end systems. It can handle millions of events per second and provides special language constructs for grouping the data into time intervals and running queries on the group. It is however important to know that the system can become slow if too many observations end up in the IFS back-end systems. The output of the Stream Analytics are SQL databases, blob storage, service bus topics, Service Bus Queues and Power BI dashboards.
3. Service Bus Queue
The third and last step in the Discovery Manager is when the data is merged to the IFS back-end systems through the Service Bus Queue. In the reference architecture the output of the Stream Analytics goes to a Service Bus Queue. If IFS backend-systems does not respond or the architectural components described are temporarily unavailable, the observations are saved in the Service Bus Queue to be processed later on when the system is back online. Service Bus Queue also provides another queue called Dead Letter. This queue is used to save messages that cannot be processed because of a fault in the message format. Administrators of the architecture should check this queue from time to time to see if there are any issues.