Maintenance Planner Resource Management Lobby
Explanation
The Maintenance Planner Resource Management lobby can be used to provide you an overview of the resource situation i.e. the extent of the total capacity and how much of the capacity is currently in use.
Define Page Parameters
Using Page parameters, you can define parameters for site and maintenance organizations to filter the results and also set the duration of the planning horizon which shows number of days which you want the data to be present in the lobby page.
Define Data Range
Data Range displays all activities that are considered in the Planning Period of the lobby from the Start Date to the End Date. Here, an activity can either be a work task or a PM action. The planning period is calculated from the Site Date to the (Site Date + Planning Horizon).
- Start Date is set as the first upcoming start date for the activities included in the lobby.
- End Date is set as the last upcoming end date for the activities included in the lobby.
Example:
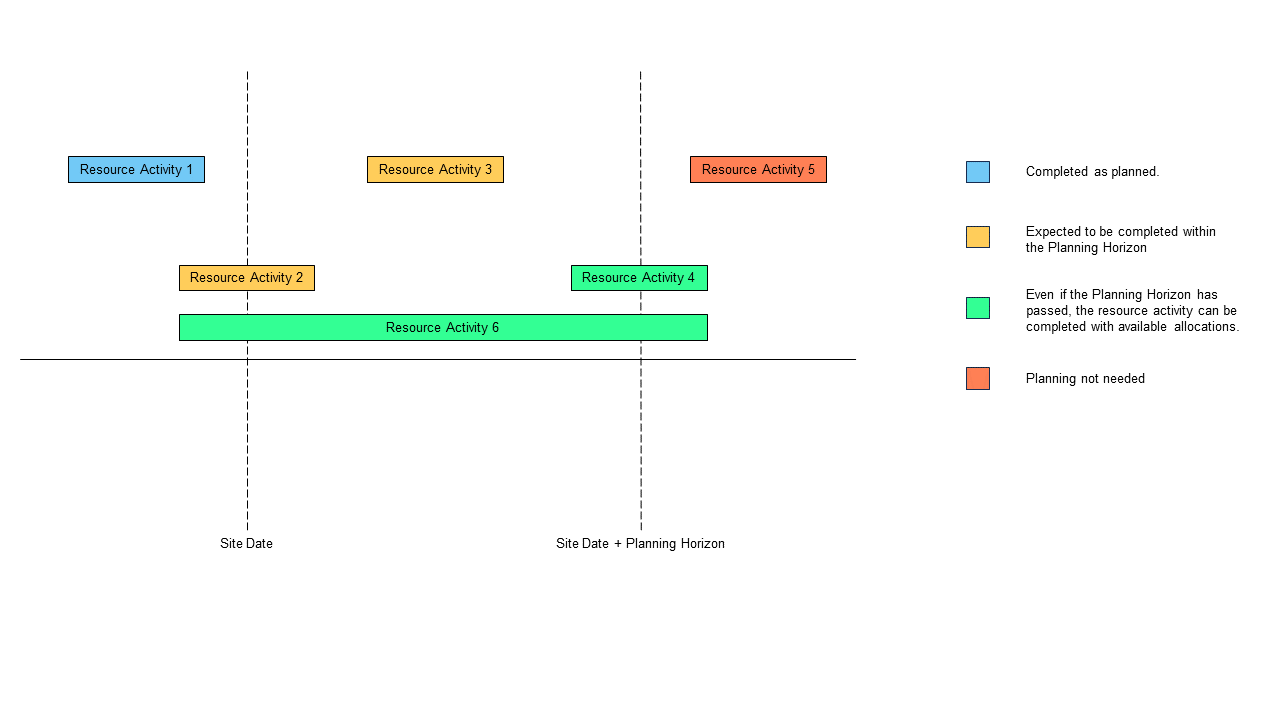
The following example explains how different resource activities will be displayed in the lobby depending on where they fall within the Planning Period.

| Resource Activity Number | Table |
| 1 & 5 | These two activities will not be considered in the lobby since they fall entirely outside the Planning Period [Site Date – (Site Date + Planning Horizon)]. |
| 2 | This activity is partly planned within the period and as long as it is not completed, it will be considered in the lobby. |
| 3 | This activity is fully planned within the period and will be considered in the lobby. |
| 4 | This activity is fully planned within the period and will be considered in the lobby. |
| 6 | This activity is partially planned within the period and will be considered in the lobby. |
Define Resource Analysis graph
Using this graph, you can get detailed insights about any resource group lobby element. It displays the total available capacity and how much of that capacity is utilized among different resource groups. Selecting on any individual bars of the bar graph leads to the Individual Resource Analysis – Resource Group and the Resource Group Analysis graphs where you can find more information about individual resources and group resources.
The legend items that describe what is visualized in the graph is as follows:
- Capacity Hours - Total available hours for all activities.
- Maintenance Demand Hours - Work Task (WT) & Preventive Maintenance (PM) Demand hours.
- Maintenance Allocated Hours - WT & PM Allocated hours.
- Total Allocated Hours - Total Allocated hours for all activities.
- Maintenance Unallocated Hours - WT & PM Unallocated hours.
Define Resource Analysis – Maintenance Organization graph
Using this graph, you can get detailed insights about any maintenance organization lobby element. It displays the total available capacity and how much of that capacity is utilized among different maintenance organizations. Selecting on any individual bars of the bar graph leads to the Resource Group Analysis graph where you can find more information about resource groups.
Define TOP 5 Resource groups with UNPLANNED Hours graph
This graph displays the five resource groups with the most unplanned hours.
Define Resource Group Breakdown – PM action
This table displays the extent to which each resource group is utilized among PM action along with their status, whether Allocated or Unallocated.
Define Resource Group Breakdown – Work Task
This table displays the extent to which each resource group is utilized among Work Tasks along with their status, whether Allocated or Unallocated.
Note: Both Resource Group Breakdown tables for Work Task and PM actions allow you to navigate to related application pages for more information.