Lobby Element Types
IFS Cloud Web uses thirteen different types of lobby elements to visualize data within IFS Cloud Lobby Pages. Each Lobby Element has its own characteristics and own way of visualizing data.
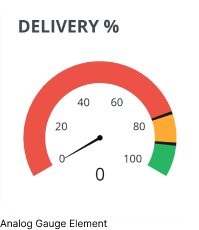
Analog Gauge Element
- Analog Gauge Elements are used when you need a quick and intuitive way to visualize the progress and status of key processes.
- If the administrator has configured navigation link for this Element, you can click on the element to navigate to the respective IFS Cloud Web page.
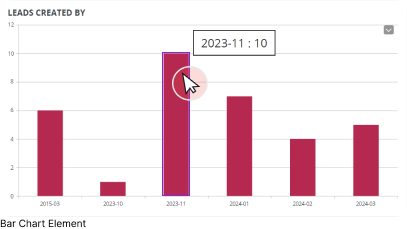
Bar Chart Element
- Bar Chart Elements are graphical representations used to illustrate the distribution and relationships among different categories of data. They enable easy comparisons of values across various categories or groups.
- If the administrator has configured navigation properties for the bar chart element, you can click on any bar chart column to navigate to respective IFS Cloud Web Page.
- When you hover over each column, a tool tip will be displayed with column name and value.
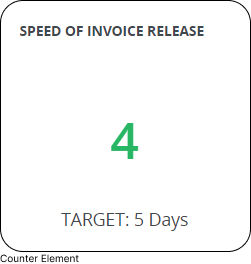
Counter Element
- Counter Elements provide a count of specific events, actions, or quantities that occur within the system which can be used to keep track of occurrences and metrics.
- If the administrator has configured navigation properties for the Counter Element, you can click on the Counter Element to navigate to respective IFS Cloud Web Page.
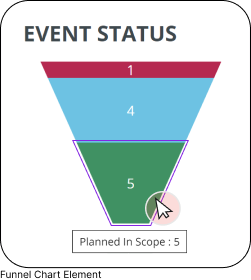
Funnel Chart Element
- Funnel Chart Elements are used to visualize the progression or conversion of data through different stages of a process, highlighting the gradual reduction in quantity or value as data moves through sequential steps.
- If the administrator has configured navigation properties for the Funnel Chart Element, you can click on any stage of the funnel to navigate to respective IFS Cloud Web Page.
- When you hover over each stage, a tool tip will be displayed with stage name and number of records per stage.
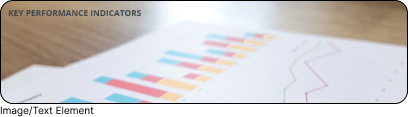
Image/Text Element
- Image/Text Elements are used to display important messages and crucial updates within the organization.
- If the administrator has configured navigation properties for the Image/Text Element, you can click on the element to navigate to respective IFS Cloud Web Page.
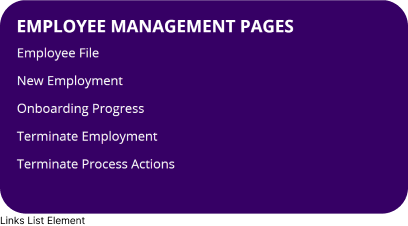
Links List Element
- Links List Elements are used to offer users a convenient list of navigation links to particular sections within or outside the system.
- Click on any link within the element to navigate to respective page.
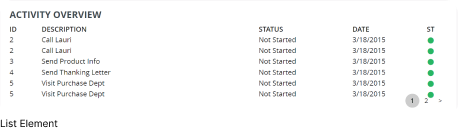
List Element
- List Elements are used to visualize data in selected columns of a data source in tabular format.
- If the administrator has configured navigation properties for the List Element, you can click on any row within the element to navigate to respective page.
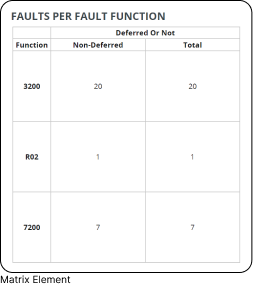
Matrix Element
- Matrix Elements generate a 2-D matrix that maps two or more data columns from a data source by establishing a relationship among each other. They are an effective tool for visualizing complex (many-to-many) relationships between data points.
- If the administrator has configured navigation properties for the Matrix Element, you can click on any value within the element to navigate to respective page.
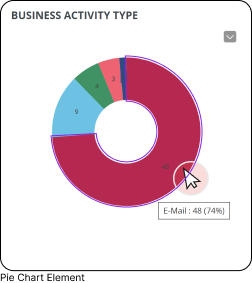
Pie Chart Element
- Pie Chart Elements are used to visualize the relative proportions or percentages of different data categories within a column of a data source, with respect to the entire data set.
- If the administrator has configured navigation properties for the Pie Chart Element, you can click on any section within the element to navigate to respective page.
- When you hover over each segment, a tool tip will promptly appear, showcasing the segment's name along with its corresponding percentage of the total value pool.
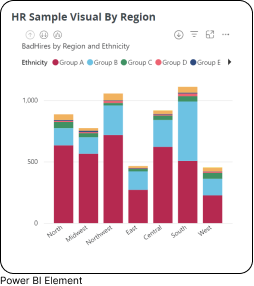
Power BI Element
- Power BI Elements are used to visualize Power BI report, dashboard tile or visuals.
- The functionalities accessible within the Power BI Element may vary based on the configurations set by the application developer. For detailed guidance on how to interact with a Power BI Element featured on your lobby page, kindly consult the product documentation guide.
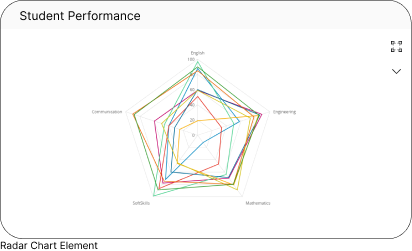
Radar Chart Element
Radar Chart Elements are used when you need to visualize or compare multivariate data in a single graphical display. Instead of using separate graphs for each variable, a radar chart condenses all information into a single polygon with multiple axes extending from a central point. It enables straightforward comparison of numerous attributes, each plotted along its own axis.
State Gauge Element
- State Gauge Elements are used to visually represent the progress and status of key processes.
- If the administrator has configured navigation properties for the State Gauge Element, you can click within the element to navigate to respective page.
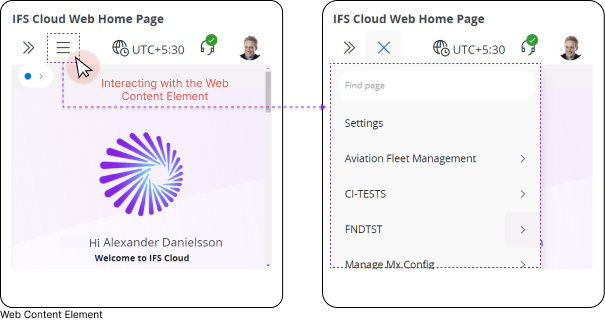
Web Content Element
Web Content Elements are used to display an IFS Cloud Web page or any other web page directly within the Lobby Page. The Web Page Element functions akin to a distinct browser window, granting you the freedom to execute any permissible action within the actual page itself.