View & Manage FMECA Analysis
Results & Observation
Use this dashboard to view and manage the FMECA Analysis based on the FMECA Analysis results and requirements. The FMECA Dashboard page includes the following elements: PM/CM Ratio,Maintenance Cost,Most Used Fault Types, Most Used Failure Modes, Ongoing FMECA by Status, Change Requests, Object Details and FMECA Needing Attention.
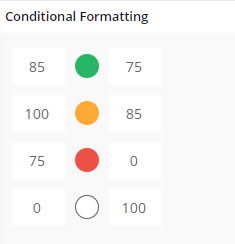
The PM/CM Ratio element represents the ratio between Preventive Maintenance and Corrective Maintenance strategies for a given Item Class and Process Class combination.
A PM/CM ratio of 85 -100 means the object has many Preventive Maintenance actions and less Corrective Maintenance actions, raising questions about the high number of Preventive Maintenance actions.
A PM/CM ratio of is between the range of 0 -75 indicates many problems, as there are few Preventive Maintenance actions but many Corrective Maintenance actions, requiring investigation into the lack of Preventive Maintenance actions.
A PM/CM ratio between 75 - 85 is ideal, indicating a good balance between Preventive and Corrective Maintenance.
The Maintenance Cost element represents the cost of the objects, defined in the Work Order and visible on the Object Cost Analysis page. Based on the cost, decisions are made about whether to conduct the FMECA Analysis.
The Most Used Fault Types element represents the most common Failure types reported via Work Orders (WOs). These fault types need to be considered when performing the FMECA to ensure comprehensive and effective maintenance strategies.
The Most Used Failure Modes element highlights the most reported failure modes from work tasks. Clicking on this element navigates to a detailed list of work tasks associated with those failure modes, providing FMECA details as well.
The Object Details element provides key insights for a specific item class and process class combination. It displays the open and reported anomaly counts and indicates whether FMECA analysis has been performed on the object. Additionally, the MTBF (Mean Time Between Failures) Days column calculates the mean time between failures for each object. The Duration for MTBF (months) parameter allows you to specify the period for this calculation, which defaults to six months but can be adjusted as required.
The Ongoing FMECA by Status element visually categorizes ongoing FMECAs using a color-coded pie chart. The category with the highest count is assigned red, the next highest is blue, and the lowest is assigned green. Clicking on each section navigates to the corresponding FMECA details, providing a comprehensive overview of each analysis.
The Change Requests element empowers managers using the FMECA Dashboard to raise maintenance change requests directly. If they identify high maintenance costs for specific objects or encounter other requirements for maintenance changes, they can create a maintenance change request linked to an ongoing or existing FMECA. This approach eliminates the need to create a new FMECA revision, streamlining the change process while maintaining continuity within the existing analysis.
The FMECA Needing Attention element offers a focused view of ongoing FMECA statuses. Facilitators can see FMECA IDs, revision numbers, facilitator names, statuses, and how long each FMECA has remained in specific statuses. Preliminary and In Progress durations are grouped together, with separate fields for Reviewed and Approved durations. If an FMECA exceeds 100 days, it appears in red; 75 to 100 days in orange; and below 75 days in green. This visual indication helps managers take timely and necessary actions.
FMECA Tree Visualization page
The FMECA Tree Visualization page offers a visual representation of key FMECA elements, including Functions, Functional Failures, Failure Modes, and Decisions. It helps users understand the relationships between these components and review past actions to avoid redundant decisions in future FMECAs. This feature is accessible from the Prepare FMECA page.
Clicking on a specific FMECA displays the FMECA Tree Visualization command, which navigates to the visualization page. Color-coded nodes, red for Analysis, blue for Functions, green for Functional Failures, light green for Failure Modes, and yellow for Decisions make it easier to differentiate elements. Selecting a node reveals detailed information in an associated card, providing insights not immediately visible from the node itself. The visualization supports decision reviews from previous revisions or FMECAs and serves as a valuable reference for historical actions, promoting more informed maintenance decisions.
Prerequisites
N/A
System Effects
N/A