Azure Monitoring
Azure Monitoring is set up via the installer (see 'Azure Installation' section in this guide for details) to provide methods for monitoring the general health of the system and its services. This section covers:
- Details of the monitoring set up by the installer
- How to use the dashboards created
Setting Up Monitoring
The installer handles setting up a log analytics workspace for the Azure deployment. It will also set up alert rules, which can notify you with a warning once criteria have been met within the deployment. These criteria are configurable around various recorded metrics, such as a virtual machine scale set's DTU usage, or its database usage. The installer will also set up a dashboard on the Azure Portal where these metrics can be viewed. The dashboard will be shared amongst all users in the subscription.
The dashboard uses a JSON file to define its structure. This file, called 'Dashboard.json' can be found in the Monitoring folder, within the Setup folder of a release.
The installer will set up the monitoring at the free tier, which allows 5 Gb of monitoring data for free each month, and retains data for 31 days. Please see https://docs.microsoft.com/en-us/services-hub/health/azure_pricing for further details about the pricing.
Warning
In order to set up monitoring via the installer, your subscription must be registered to use 'microsoft.insights'. This can be set in the Azure portal, under 'Resource providers' on the selected subscription.
Alert Rules
This section will explain the way in which the alert rules operate, as well as describe the alert rules set up by the installer. Instructions will be provided for setting up custom alert rules.
Each rule has a condition that must be met to be triggered, and the rule will regularly make checks to see if the condition has been met. Once the rule is triggered, it will send out alerts via the specified method, which is set up to be via email by the installer. The rule will not repeatedly send alerts, even if the problem persists. The rule will only become active again once the problem has been fixed (i.e. once the rule condition stops being met).
Alert Rules Created by the Installer
- Daily Data Limit Reached: If the data limit has been reached for monitoring, this alert will be triggered. Monitoring will not continue once this limit has been reached
- DTU Percentage: An alert is raised if the DTU percentage for the database averages at least 95% for five minutes
- Database Size Percentage: An alert is raised if the database size percentage is at 95% or above for five minutes
Custom Alert Rules
Custom alert rules can be configured against a PSO Azure deployment. This allows for custom query conditions and multiple action groups, which is implemented outside of the Installer using the Azure API. This should be completed in a separate resource group and not in a resource group containing a PSO Azure deployment. This is so that any customization is external to PSO and can easily be added, altered or removed without impacting PSO's installation process.
Example adding custom rules using Azure PowerShell
Step 1: Sign in with Azure PowerShell
This can be done by setting up and requesting an Azure Cloud Shell from your subscription.
Step 2: Create resource group
This resource group holds any custom alert rules and action groups. You will need to provide the Name and Location when creating the resource group.
PS> New-AzResourceGroup -Name "customResourceGroup" -Location "north europe"
Step 3: Create action group
This action group holds all the notification preferences that will be used by the custom alert rule.
Firstly, create your action group receiver object in memory. There are additional receiver types but for this example the EmailReciever type is used. For type EmailReciever you will need to provide the Name and EmailAddress. Multiple receivers can be created.
PS> $email1 = New-AzActionGroupReceiver -Name "email1" -EmailReceiver -EmailAddress "email1@example.com"
PS> $email2 = New-AzActionGroupReceiver -Name "email2" -EmailReceiver -EmailAddress "email2@example.com"
Next, create your action group. You will need to provide the Resource Group Name created in Step 2, a ShortName and the Receivers created above.
PS> Set-AzActionGroup -ResourceGroupName "customResourceGroup" -Name "customActionGroup" -ShortName "actionGroup" -Receiver $email1,$email2
Step 4: Create alert rule
This alert rule will contain your custom query and trigger that once met will send out an alert via your action group.
Firstly, create the alert rule source object in memory. You will need to provide the custom Query and DataSourceId. The DataSourceId will be the ID of the log analytics workspace within the resource group containing the PSO Azure deployment.
Example DataSourceId: /subscriptions/{subscriptionId}/resourceGroups/{pso-resourceGroupName}/providers/microsoft.operationalinsights/workspaces/{pso-workspaceName}
PS> $source = New-AzScheduledQueryRuleSource -Query "exampleQuery" -DataSourceId "exampleDataSourceId"
Next, create the alert rule schedule object in memory. You will need to provide the alert FrequencyInMinutes and the alert TimeWindowInMinutes.
PS> $schedule = New-AzScheduledQueryRuleSchedule -FrequencyInMinutes 5 -TimeWindowInMinutes 5
Then, create the alert rule action group object in memory. You will need to provide the ActionGroup created in step 3.
Example ActionGroup: /subscriptions/{subscriptionId}/resourceGroups/{custom-resourceGroupName}/providers/microsoft.insights/actionGroups/{custom-actionGroupName}
PS> $aznsActionGroup = New-AzScheduledQueryRuleAznsActionGroup -Actiongroup "exampleActionGroup"
Next, create the alert rule trigger condition object in memory. You will need to provide the Threshold and ThresholdOperator.
PS> $triggerCondition = New-AzScheduledQueryRuleTriggerCondition -ThresholdOperator "GreaterThan" -Threshold 0
Then, create the alert rule alerting action object in memory. You will need to provide the AznsAction group created in memory above, the Severity, and the Trigger condition created in memory above.
PS> $alertingAction = New-AzScheduledQueryRuleAlertingAction -AznsAction $aznsActionGroup -Severity "1" -Trigger $triggerCondition
Finally, create the custom alert rule. You will need to provide the Source, Schedule and Action created in memory above, the Location of the custom alert rule, the Name of the custom alert rule, the ResourceGroupName of the group created in step 2 and whether the alert is Enabled.
PS> New-AzScheduledQueryRule -Source $source -Schedule $schedule -Action $alertingAction -Location "north europe" -Name "customAlertRule" -enabled 1 -ResourceGroupName "customResourceGroup"
Note
Azure PowerShell Documentation: https://docs.microsoft.com/en-us/powershell/azure.
Azure PowerShell Monitoring Documentation: https://docs.microsoft.com/en-us/powershell/module/az.monitor
Using the Dashboard
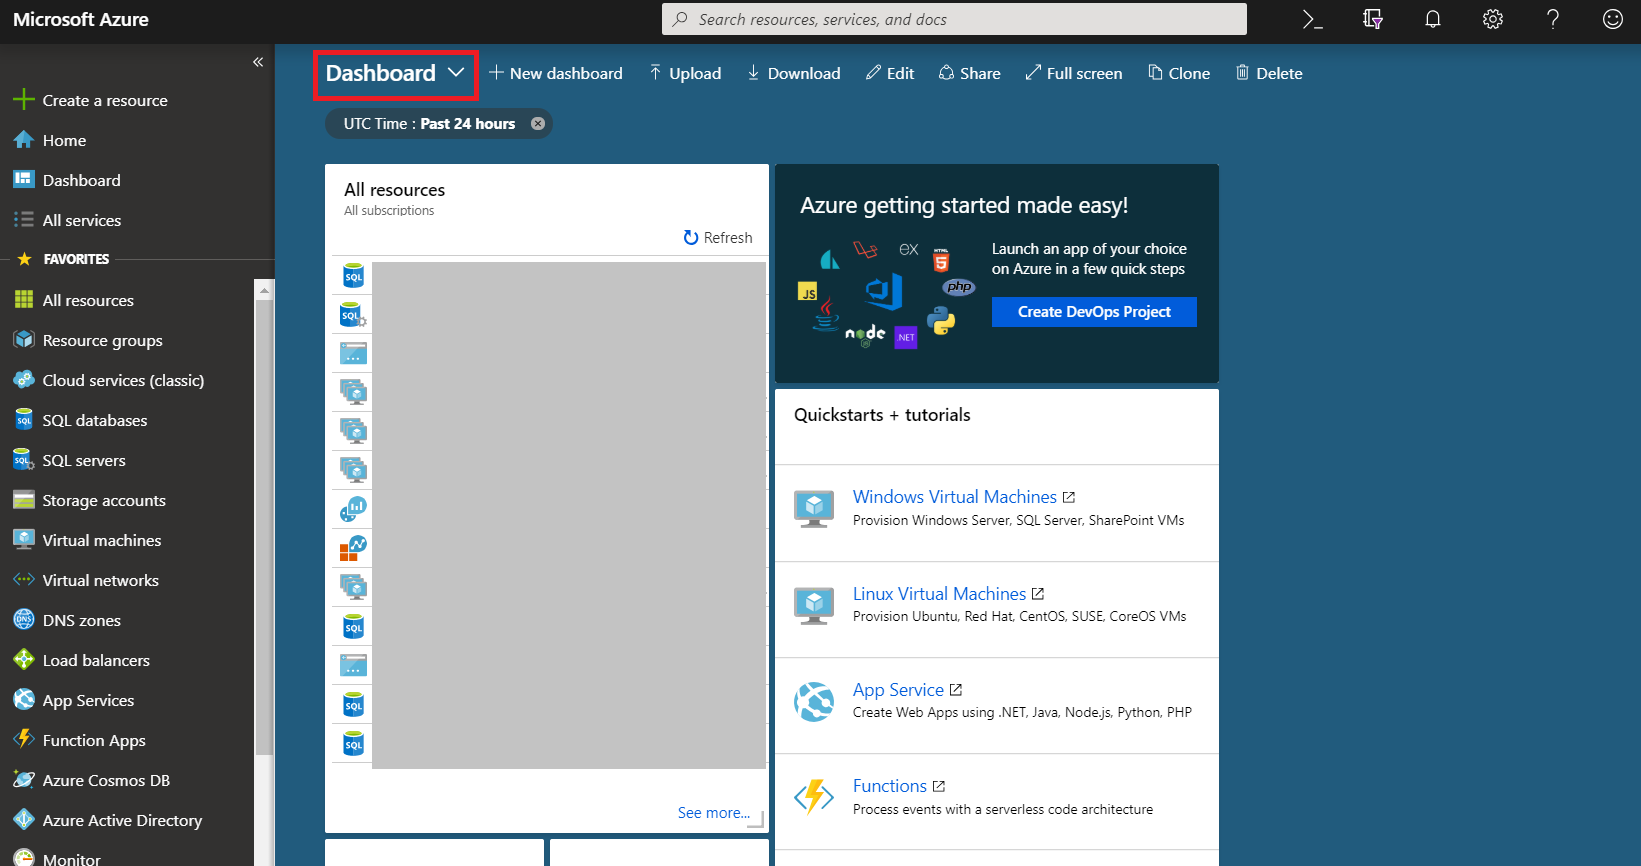
The image below shows the default dashboard on the Azure Portal. From here, you can switch to any other available dashboards by clicking on the highlighted drop-down menu.
Warning
Do not delete the default dashboard provided by Microsoft. This can cause errors upon logging into the Azure Portal.
The dashboard that is created by the installer is shown below:
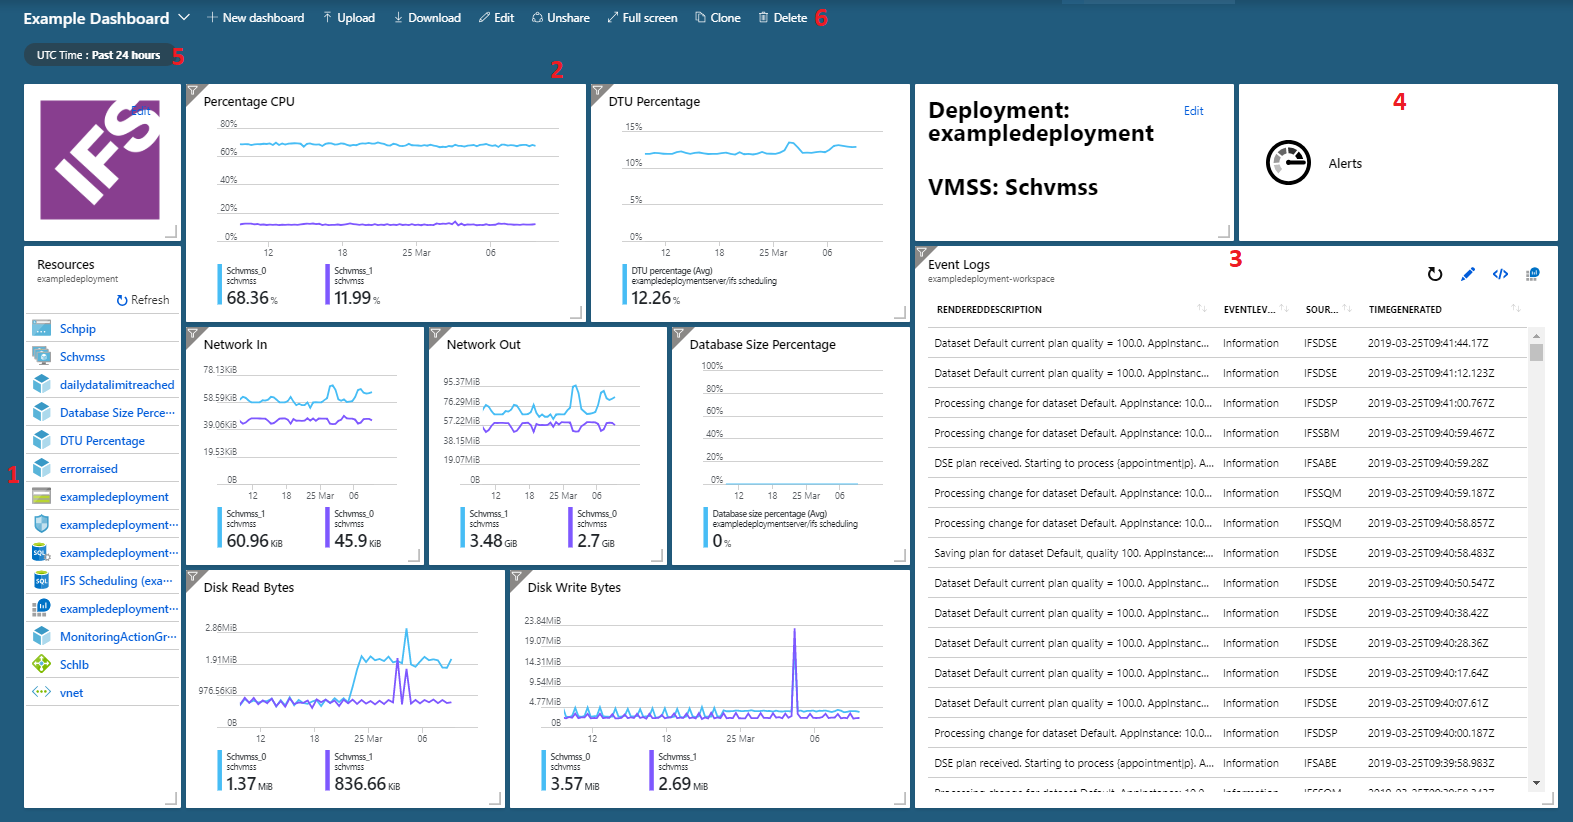
- Resource Group Details: This section contains links to every resource in the resource group
- Metrics: Metrics graphs are displayed to show statistics for the virtual machines on the virtual machine scale set, and for the database. Clicking on any of the graphs will open a window which can provide a clearer view of the graphs, and additional filters or metrics may be applied
- Time Range: The time range can be changed, and all of the metrics graphs and the event log on the dashboard will be updated
- Template Options: Options at the top of the screen allow you to edit the dashboard, or delete it when it is no longer needed