Validating System Health
Checking Services
To check that services are running correctly, you can check the Applications screen or the System Diagram. Both are accessed via the Administration workspace in the PSO Workbench.
Note
Users in child organisations need not carry out checks of the Applications screen and System Diagram, and should not expect to have access to these screens.
Applications Screen
The Applications screen will show each instance of a service and can be used to see if each service is active (running). If a service is not running, it can be started from this screen.
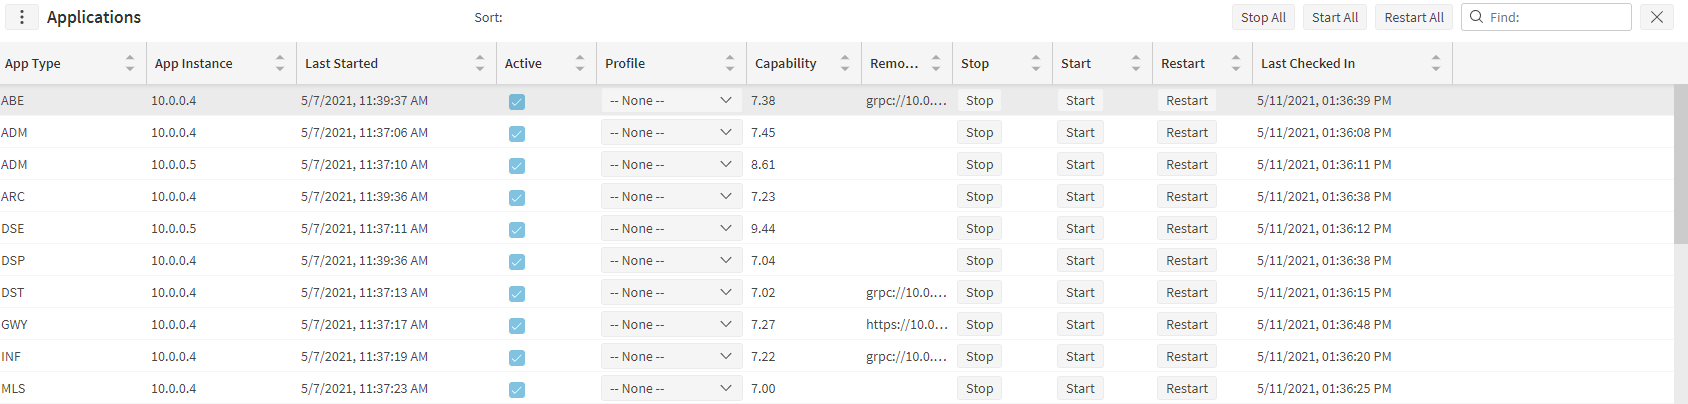
Each service will "check in" by updating a column in the 'Application_Instance' table. This check in will be carried out every minute (by default, controlled by the parameter 'ServiceCheckInTime'). If any service has gone too long without checking in (5 minutes by default, set by the parameter 'CheckInExpiredTime') then an error will be raised by the Scheduling Administration Service.
System Diagram
The System Diagram shows a graphical overview of the system. You can see which services are running, how many datasets are being processed and how much of a server's capability is being used. This screen is a good place to check to see if everything is running and to make sure that the system is not being overloaded. See the PSO Workbench User Guide — System for more information.
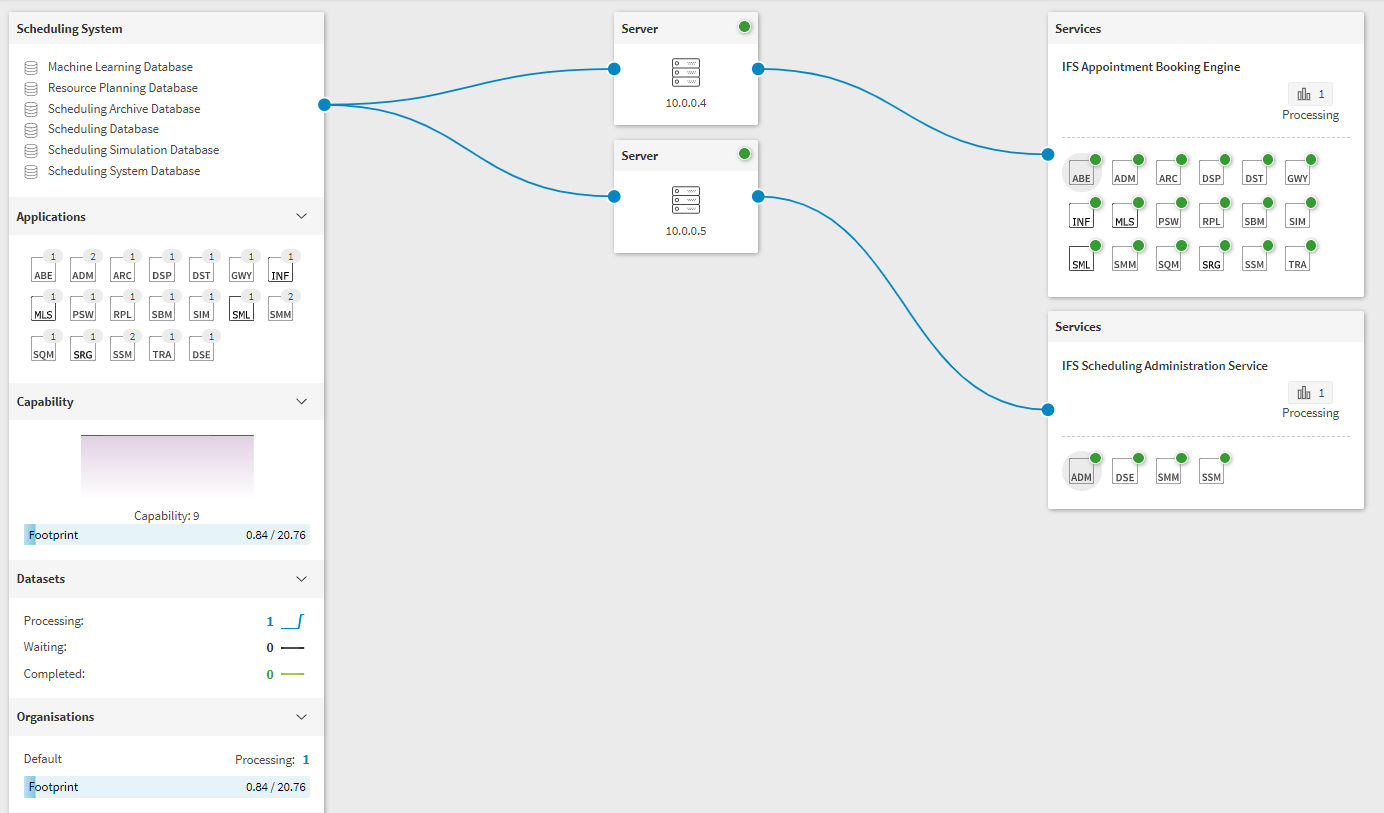
The icon at the top right of each service will be green to show that it is running.
Note
The CPU and memory usage of the servers can be shown by enabling the LogStatistics parameter. This is not enabled by default since it has a performance impact.
Note
If viewing the system diagram as a child organisation you can see information for the organisations you have permission to see. Information for other organisations and datasets will be aggregated and displayed under the heading of 'Other'.
Smoke Test
The Verification Files folder of a release contains a file that can be used to carry out a smoke test of a PSO system after an installation. This smoke test can be carried out before sending in any live data to ensure that data can be input into the system, the DSE will produce a plan, and this plan can be viewed in the PSO Workbench.
The smoke test file has an equivalent dataset to be used when sending data into a PSO system deployed into Azure. The Azure version of this file does not contain any broadcasts.
The image below shows the expected results from processing the smoke test. Note that the exact allocations do not need to match those shown below, but a plan similar to this should be displayed.

Event Logs
The services may all be running, but may have encountered issues. If so, an error or warning message will have been logged. This can be checked for in the Event Logs.
The Event Logs can be accessed in the Administraton workspace in the PSO Scheduling Workbench (when logged in as an administrator user). For users in child organisations the only events shown will be those related to the user's organisation.
Error events will be displayed in red, warning events will be shown in orange, and information events appear in blue. Clicking on any event will open the Event Details panel, which will include any exception details for error events.
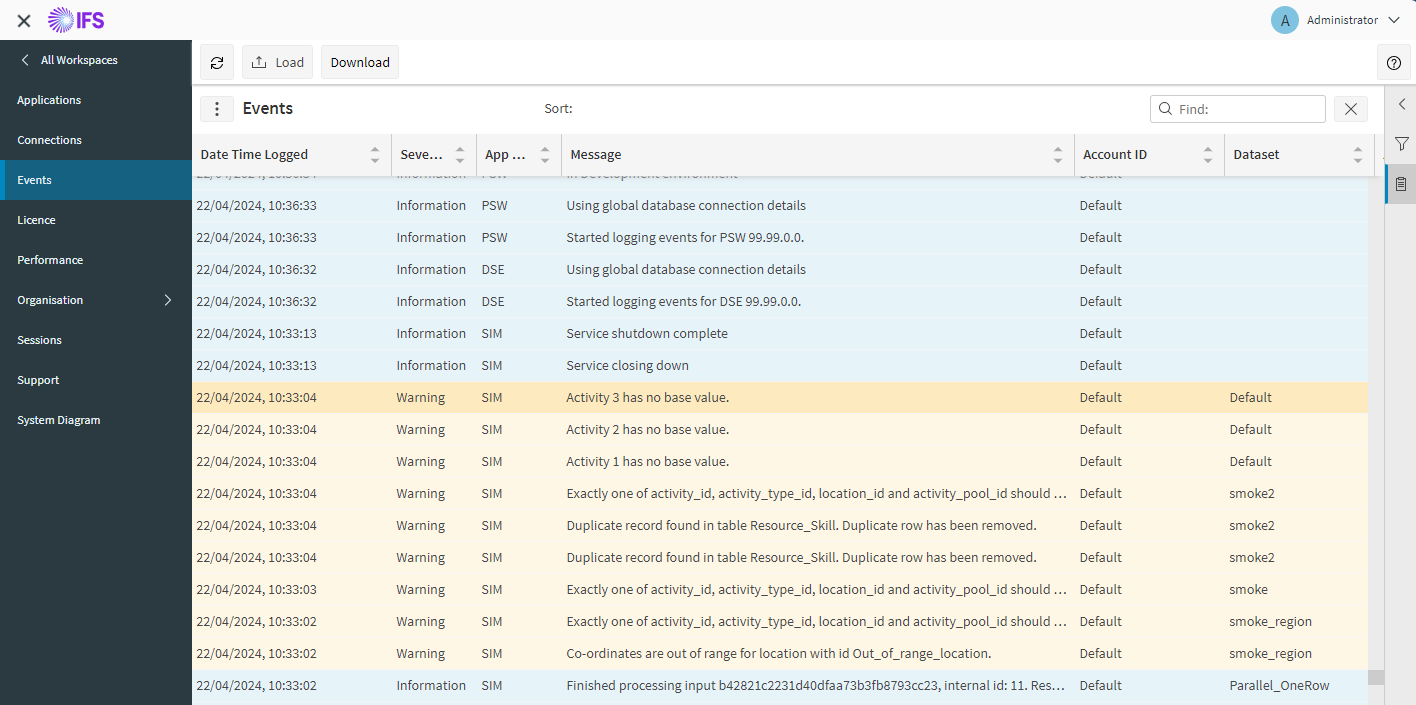
By clicking on the button with the three dots to the side of the Events title on the screen, you can bring up the Events Options panel. From here you can filter which kind of events are displayed. This way you can change the screen to just show any errors that may have been raised.
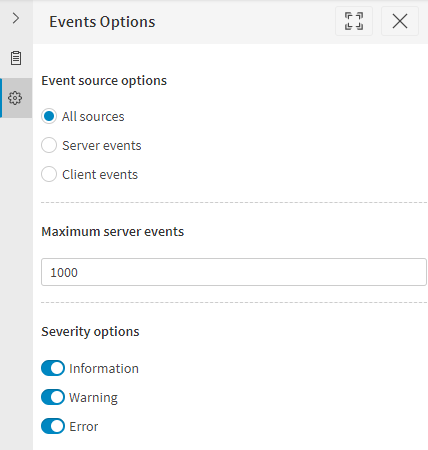
This panel also allows you to increase the number of server events that are fetched from the database so that you can check for errors further back in time.
In the search bar at the top of the Events page you can search for an Application Type (e.g. DSE) to only display the events logged by a particular service. Immediately after a fresh install, this can be a useful way to check that each service has started up correctly.
Events from this page can be saved (by clicking the 'Save' button). This exports the events to a JSON file that can be imported and viewed on this page at a later date (by clicking the 'Load' button).
Note
Note that the information events surrounding errors can still be useful, so an export of all event types may be more useful than just exporting errors/warnings.
System Test
A system test can be set up to be carried out periodically to check that core components of the system are working correctly. The test is an 'end-to-end' test that is carried out by the Scheduling Administration Service. The test involves sending a small test dataset to the Schedule Input Manager and checking the output from various other services. A full list of the checks carried out is detailed further below.
The test can be enabled via the parameter 'RunSystemTest'. The Scheduling Administration Service must then be restarted for the parameter change to take effect. Further parameters can be set to more precisely configure the test (detailed further below).
Note
System tests are not enabled by default since it needs to be correctly configured for your system.
Note
The test runs under the default system organisation.
Upon a test completing successfully, an information message will be logged. If anything has gone wrong, an error message will be logged. These can be viewed in the Event Logs. The results are also logged to the 'System_Status' table in the Scheduling System Database.
System tests can be used to continually ensure that a PSO system is working correctly and to be notified of any component that has started to have problems.
System Test Checks
A system test will perform the following checks (assuming all are configured to run):
- Check that data can be sent into the system via the Schedule Input Manager.
- Check that the system can produce a schedule for a basic dataset via the Dynamic Scheduling Engine
- Check that appointment offers can be generated via the Appointment Booking Engine
- Check that dispatch suggestions can be made by the Schedule Dispatch Service
- Check that travel analysis details can be generated by the Travel Analysis Service
- Check that a plan can be retrieved from the Schedule Query Manager
- Check that broadcasts can be retrieved from the Schedule Broadcast Manager
- If the Schedule Distribution Service is being used, the test will also verify that this is functioning correctly
Parameters
The following parameters can be used to configure how system tests run:
| Parameter Name | Description | Default |
|---|---|---|
| RunSystemTest | Determines whether to run system tests. | No / False |
| RunSystemTestSeconds | The frequency with which the test is run. | 3600 (1 hour) |
| SystemTestDatasetId | The dataset id to run the system test under. | SystemSmokeTest |
| SystemTestTimeLimit | The maximum time to allow for the system test to complete. | 2 minutes |
| SystemTestAllocationTypes | The plan allocation types to expect output for - see the Scheduling Schema Guide, Broadcast section, for details of allocation_type values. | All Types = 27, i.e. 1 (DSE Plan) + 2 (Appointment Offers) + 8 (Dispatch Suggestions) + 16 (Travel Detail) |
HTM Verification
If an HTM has been configured for a PSO system, a test can be carried out to ensure that the DSE has been correctly connected to it and is using it properly.
A verification file will be supplied with the HTM installation files. This file can be sent in via the Schedule Input Manager. The file contains two activities - one with id "SUCCESS" and one with id "FAIL". If the HTM is connected and working correctly, only the "SUCCESS" activity should schedule.
Note
HTM verification files are intended to be used with default travel parameter settings. Using non-default settings could have an impact on the results.
Note
It is recommended to check the event logs to verify that the DSE reports that it has successfully connected to the HTM, or to diagnose issues if the verification fails.
Note
Some older versions of these files may use a slightly different method of verification. For example, some files contain only a single activity that will only be scheduled if the HTM is installed.