Monitoring
A number of enhancements have been made to improve monitoring of the scheduling system.
System Smoke Test
It is now possible to set up the scheduling system so that it automatically performs a smoke test at regular intervals. The smoke test will verify that all core services are working correctly. Any issues are recorded in the event log, and the details of the previous smoke test are included in the system status (see below).

See the Administration Guide — Admin Service for further details of this functionality.
System Status
The Scheduling Administration service will now record the current system status in the database at regular intervals. This status includes the number of recent errors and warnings logged, and the results of the last system smoke test. The current system status can be queried by an external application via the Scheduling Gateway.
See the Administration Guide — Admin Service for further details of this functionality.
Role Validation Checks
When using a multi role scheduling system, the Scheduling Administration Service can now be set up to perform periodic checks to ensure that all expected components are running to match the role configuration.
Azure Monitoring
For an Azure hosted system it is now possible to set up a dashboard in Azure to monitor the scheduling system. This can be used to show the following:
- All events logged by each scheduling component.
- Network usage across the system.
- CPU usage of the servers making up the system.
- Database usage of the system.
- Database size.
In addition alerts can be set up, for example to send an email when an error event is recorded by the system.
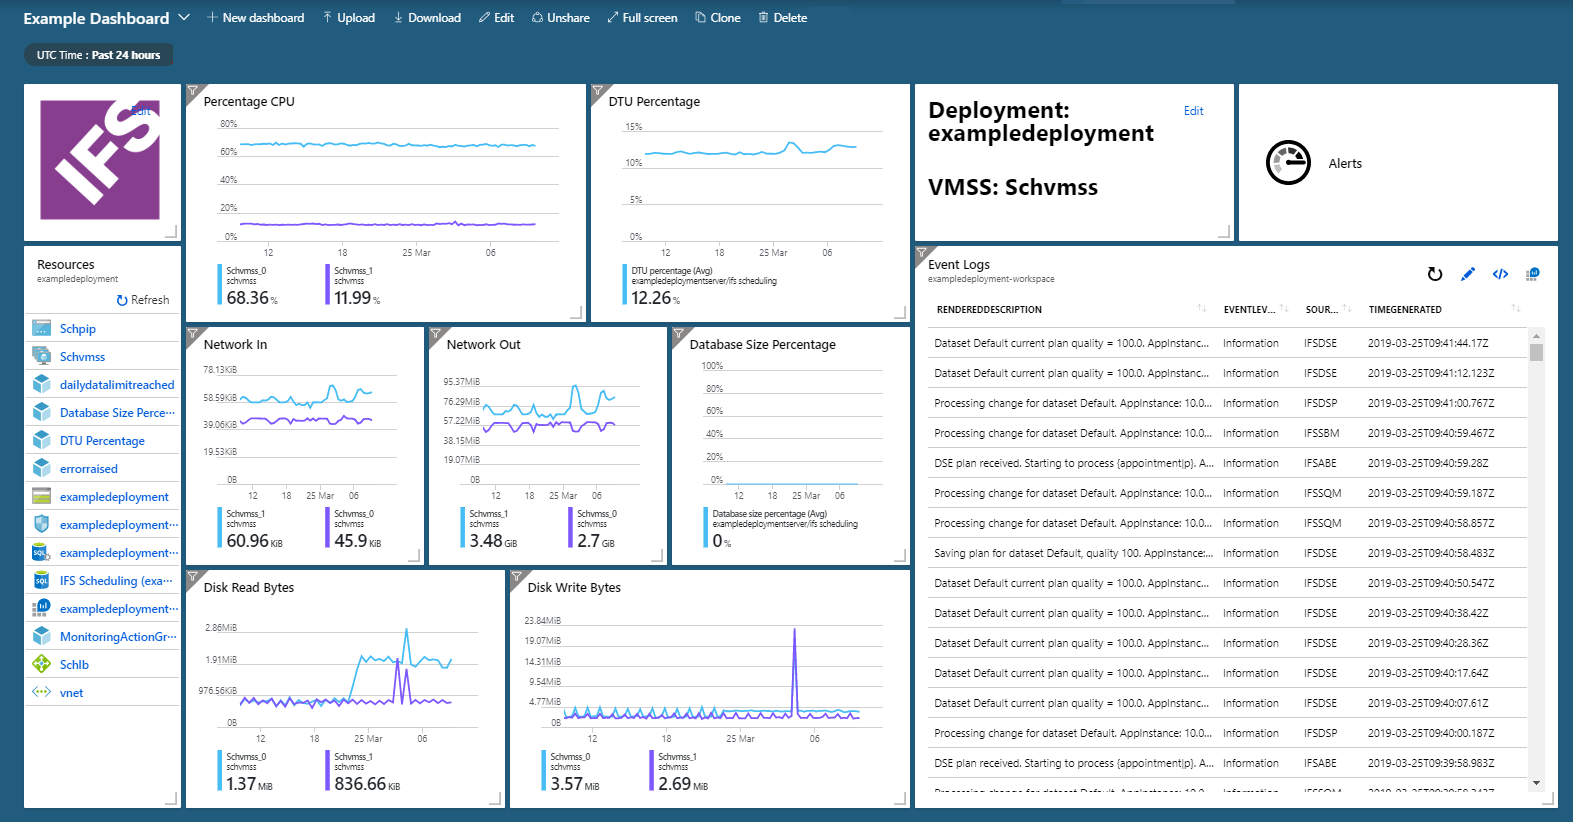
See the Installation Guide — Azure Monitoring for further details of this functionality.
Application Instance Statistics
It is now possible to set up the system so that each application instance will log statistics relating to it's usage to the system database. In addition the administration service will log summary statistics for the entire system. This includes:
- CPU Usage
- Memory Usage
- Operations per minute
- Total processing and waiting datasets
See the Administration Guide — Admin Service for further details of this functionality.