Administration - System
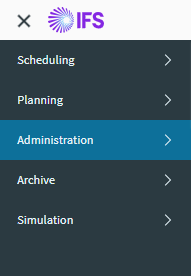
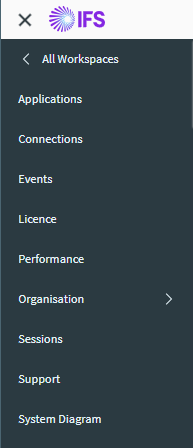
System can be accessed from the Administration workspace.
Note
Changes to data on these screens should be tried on a test system before alterations are made to a live environment.
Applications
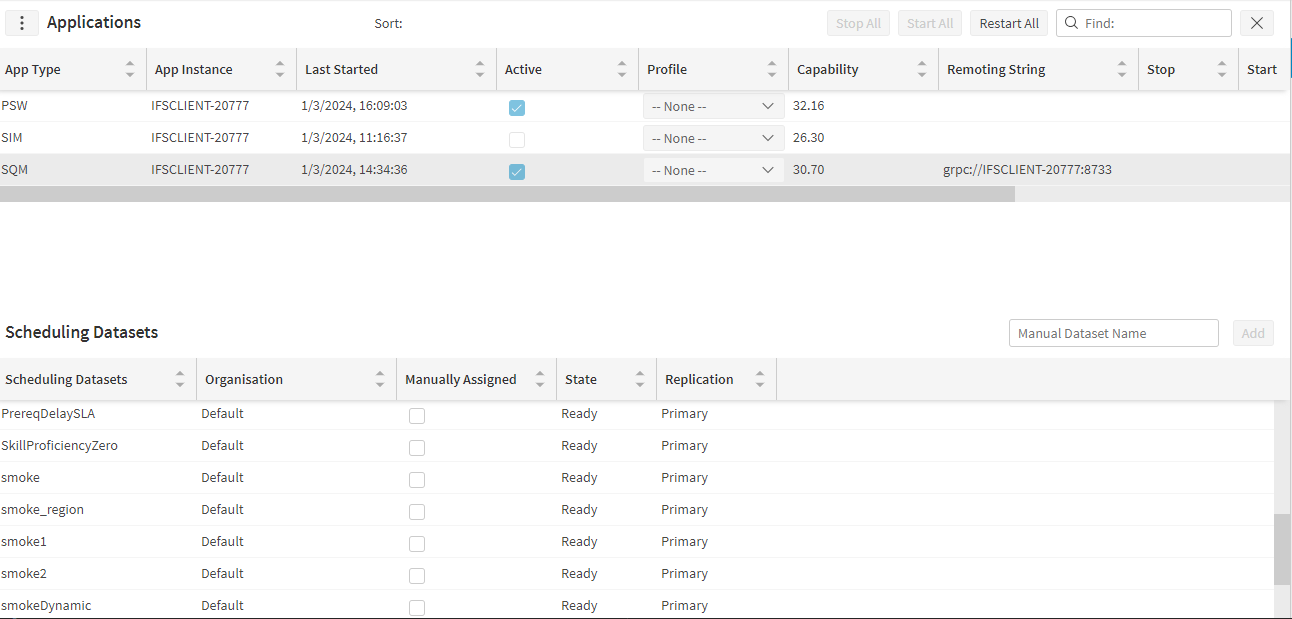
This screen displays all the scheduling services currently registered with the database being used. When any service connects to the database it registers itself so that it can be viewed on the screen. This can therefore be used to validate that the services have successfully connected to the database and it is the right database.
Each service, and instance and version of the software is displayed together with other associated data. When running in Azure the region, zone and node information from the VM is shown against each application.
In addition this screen allows the user to define a profile for an instance of an application, or restrict which datasets should be processed by the instance. This enables application instances to be dedicated to certain datasets i.e. a particular Dynamic Scheduling Engine instance can be assigned to process a certain dataset.
Performing service actions
The Applications screen also allows users to perform remote service actions: stop, start, and restart - see the below screenshot. To enable this option, the user must have the "AdminServiceActions" permission. Furthermore, service actions may only be performed against services where there is an active Scheduling Service Manager (SSM) running on the same server - if there is not, the action buttons will be hidden.

Connections
The Connections screen displays all active and inactive HTM connection strings. The screen allows the user to add, edit or delete connection strings. When adding or editing a connection string there are four columns which are required for a valid connection string which are 'ID', 'Database Provider', 'Connection String' and 'Active'.
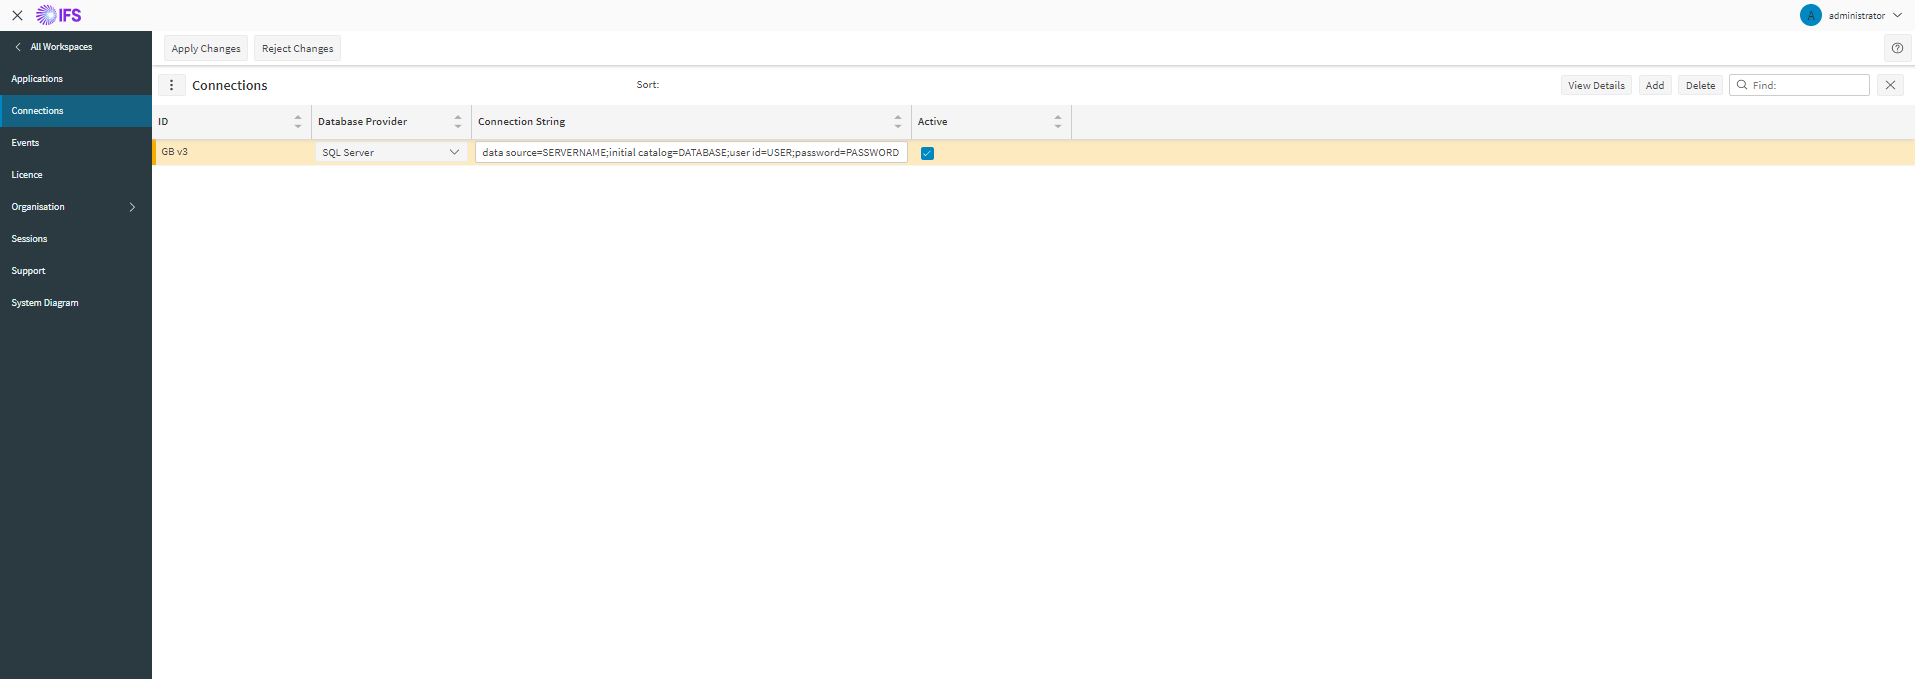
When a provider is selected from the drop down the screen will populate the 'Connection String' column with a template if either the 'Connection String' is empty or equal to another template. When you are finished editing connection strings you need to click 'Apply Changes', if you are adding or editing a connection string the Workbench will validate the connection string before allowing the user to save. Password parts of the 'Connection String' column will never be shown on the page once a connection string has been saved to the database but they can be edited.
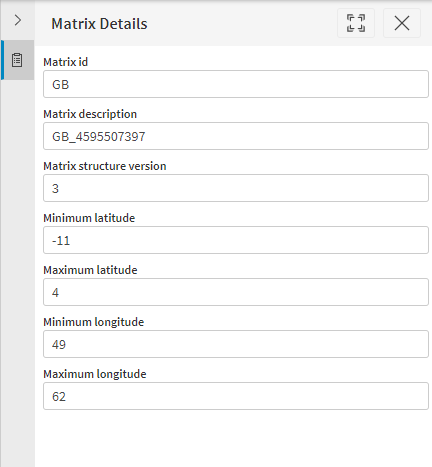
When a row is selected on the Connections page a button called 'View Details' will be enabled to use. When clicked the 'View Details' button will send a request for the matrix details of the selected row. If the connection is valid a side panel will be populated displaying the matrix id, description, structure version minimum latitude, maximum latitude, minimum longitude and maximum longitude.
Events
The events view within the Administration workspace provides details of all events logged by the client during the current session.
For administrative users, this will also show all events logged by the system. On single tenant systems this will show all events generated by the system, while on multi-tenant systems it will show all events related to the user's organisation.
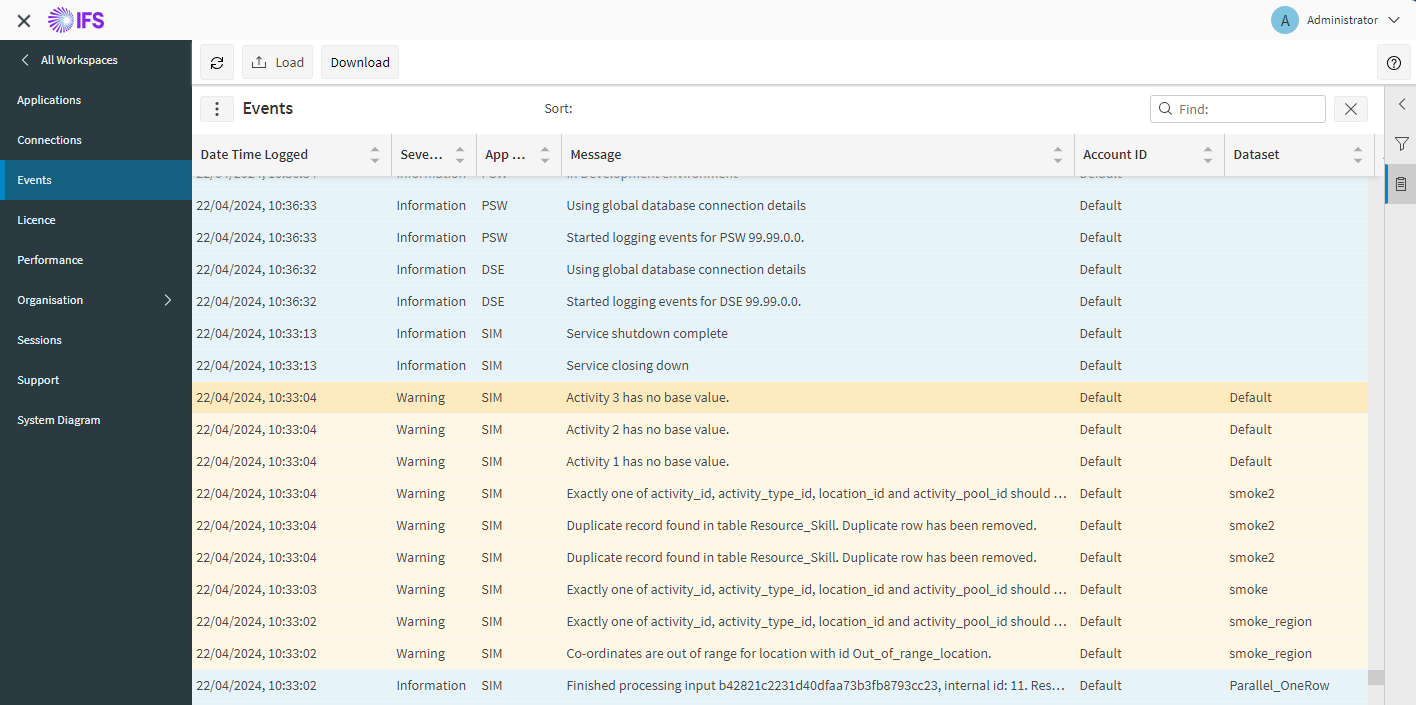
The main data grid shows the events listed with the newest events at the top of the grid. The events are colour coded, with information events showing in blue, warning events in orange and error events in red. The grid will automatically update, and can also be manually refreshed using the 'Refresh' toolbar button.
The 'Download' toolbar button saves the events currently shown as a JSON file. The 'Load' toolbar button opens a JSON file of saved events. While a file is loaded, the 'Load' button shows the file name in brackets. The 'Refresh' button is hidden, and the grid does not update with live events. Use the 'Return to live events' toolbar button to leave the loaded file and show live events again.
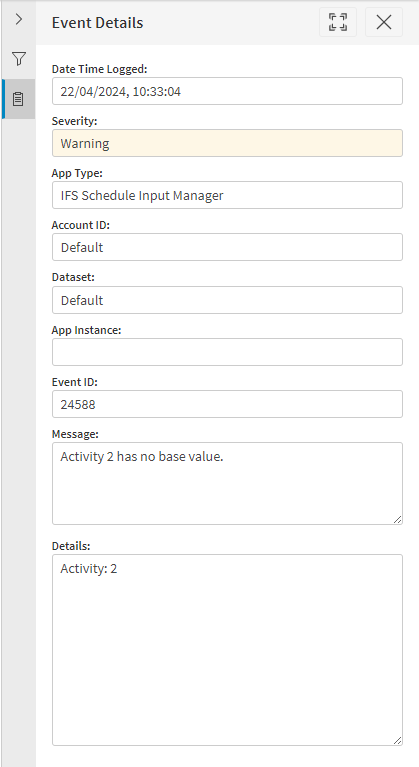
Clicking on any event will bring up the details of the event in a right hand side panel, including any exception details for error events.
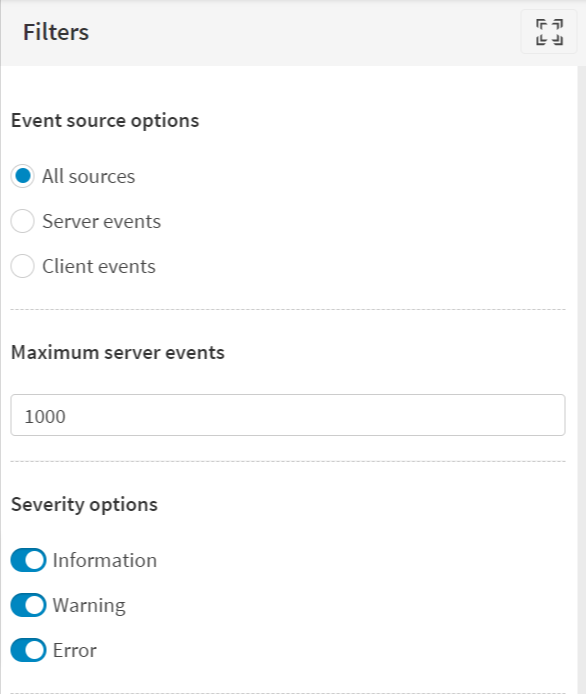
The events can be filtered using the quick find control, or via the event filter panel. This panel can be accessed by clicking on the filter icon on the right most side of the page.
The panel has options to filter based on event severity. In addition, administrative users can choose to display server only events, or client only, or both. They can also choose how many events to retrieve from the server (default 1000).
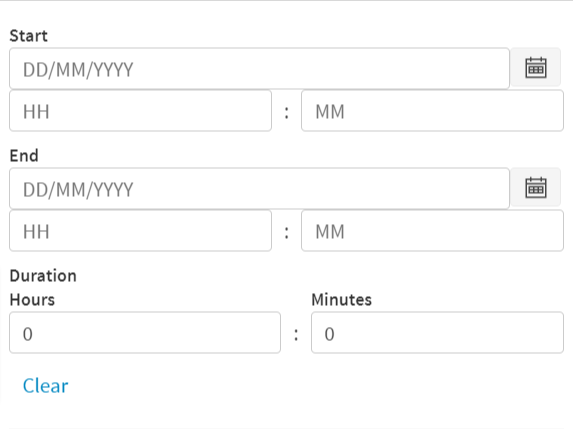
Further it is possible to filter the events based on a date range or start date/time only or end date/time only.
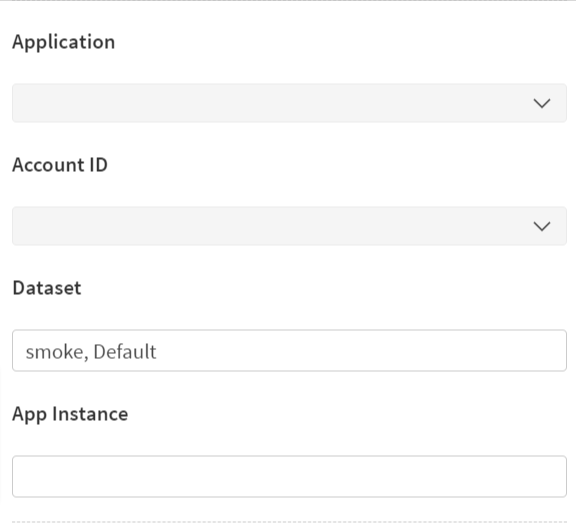
For administrative users it is possible to filter the events based on application type (multi selectable) and Account ID (multi selectable and is visible for Default account users only). Further it is possible to specify data set or application instance value(s) to filter the events. If defining more than one value for dataset or application instance need to specify it as a comma separated list.
Finally, the user can also configure the data grid columns via the event options panel. This panel can be accessed by clicking on the three vertical dots next to the 'Events' title.
Installations
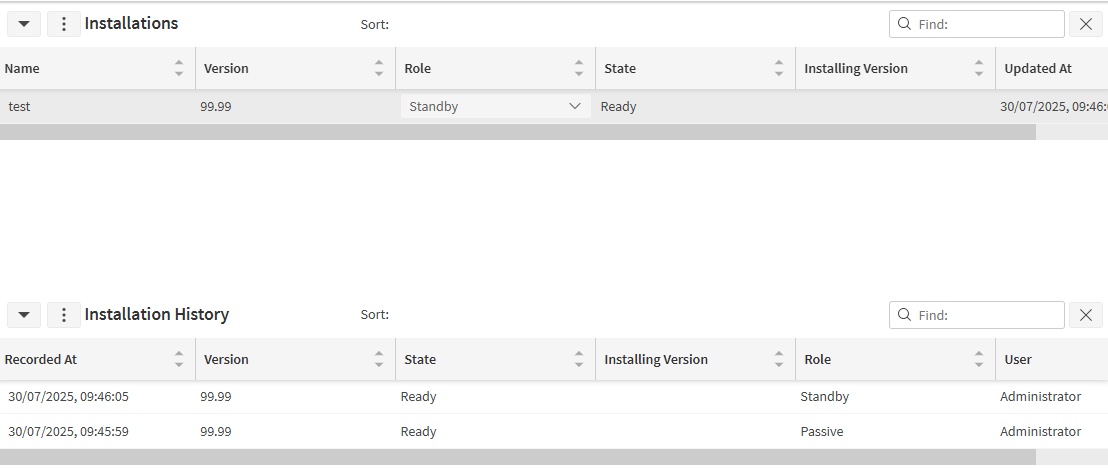
When running on a kubernetes managed environment, the PSO system supports multiple installations of the software for the purposes of disaster recovery and blue-green deployments. In such cases, the installations screen can be used to view the current state of each installation, and to manage the installation roles.
Note
This screen is only available when a system has been installed with named installations.
Licence
The licence screen displays licensing information. This includes which products are licensed, who they are licensed to, when the licence will expire and which MAC addresses are registered.
Performance
The Performance screen allows the user to view performance related metrics for the system.
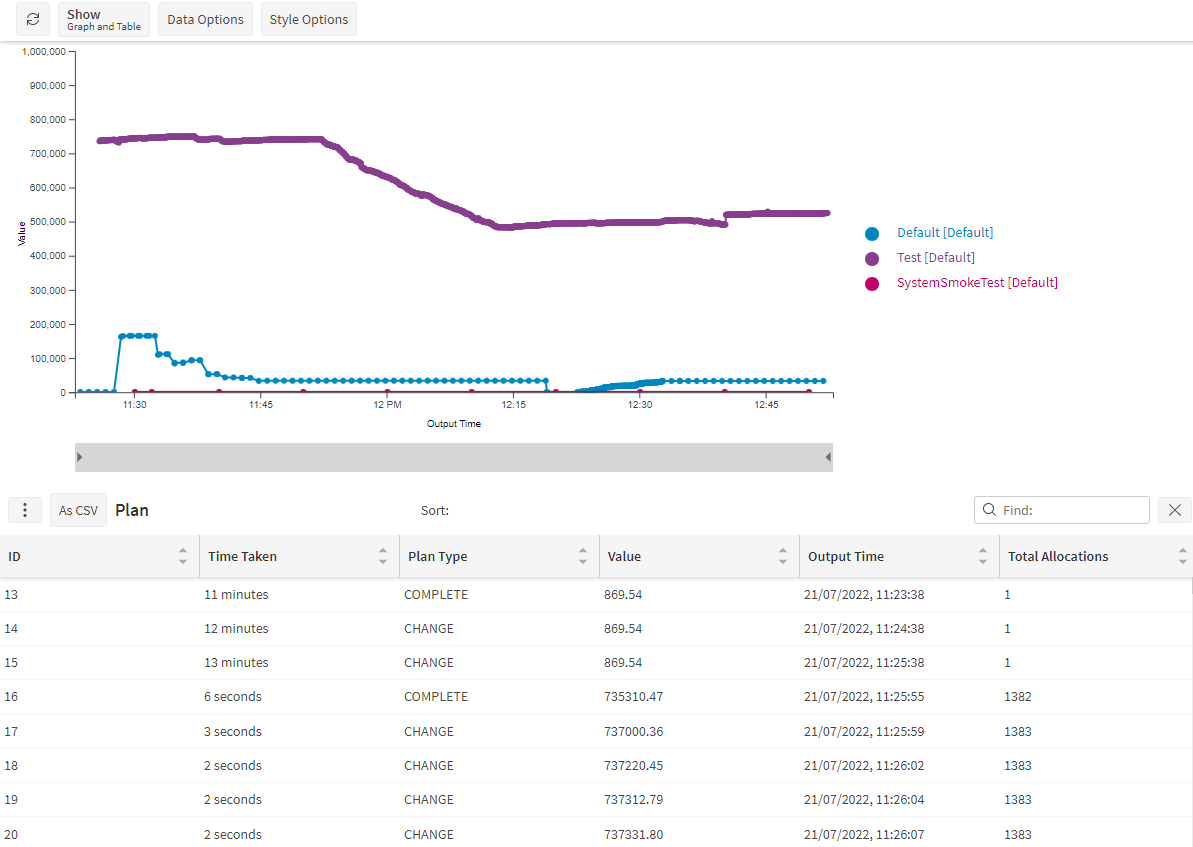
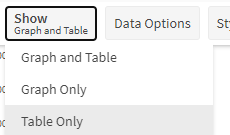
Data is displayed in both graphical and tabular format. The 'Show' button at the top of the screen can be used to choose which formats are displayed.
Note
The 'Total Allocations' value will include activities with class values such as: BREAK, CALL, DEPOT, etc. This may differ from the 'Activities Scheduled' value in the Analysis screen where we only include activities with a class value of CALL.
Data Options
The Data Options panel allows the user to choose which type of data (and therefore which metrics) should be displayed. The user can also choose the date range over which to view the metrics.
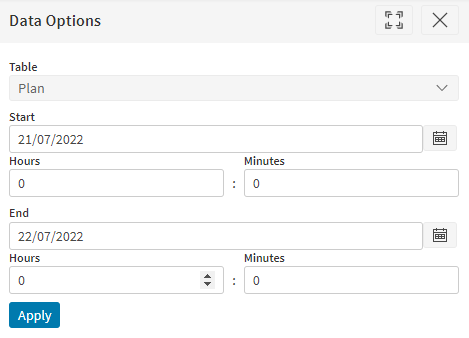
Metrics are available for each of the following:
| Name | Default Graph Type | Default X Axis | Default Y Axis | Default Group By | Description |
|---|---|---|---|---|---|
| Plan | Line Chart | Output Time | Value | Dataset | Displays summaries of schedules produced by the Dynamic Scheduling Engine, based on the details on the Plan row for each schedule. By default the graph shows how the plan value (or margin) changes over time. Metrics such as 'Total Allocations' and 'Average Travel Time' can also be displayed. |
| Appointment History | Line Chart | Request Time | Time Taken | Dataset | Shows a summary of each appointment requested, including the time taken to respond to the request. |
| Broadcast History | Line Chart | Broadcast Time | Send Time Taken | Dataset | Shows a summary of each broadcast sent by the system, including the time taken for the broadcast to be processed by the receiving application. |
| Input Reference | Hourly sum of values | Input Time | Row Count | Dataset | Shows a summary of each schedule input sent into the system, including the number of update rows and the number of deletions in the input. |
| Organisation Usage | Daily average of values | Time Stamp | Activity Count | Organisation | Shows a summary of each organisation in the system, including the number of datasets, unique activities and unique resources. |
| Dataset Usage | Daily average of values | Time Stamp | Activity Count | Dataset | Shows a summary of each dataset in the system, including the number of activities and resources and the scheduling window length. |
| System Status | Line Chart | Time Stamp | Live Footprint | Instance ID | Shows details from the system status rows recorded by the administration service. This includes the total footprint of datasets running on the system, the capability of the system, and the number of warnings and errors recently recorded. |
Note
Appointment History is only available for appointments requested via the 'appointment' RESTful gateway endpoint.
Note
System Status details is only available in the head organisation.
Style Options
The 'Style Options' panel can be used to change the data that is displayed in the graph and table.
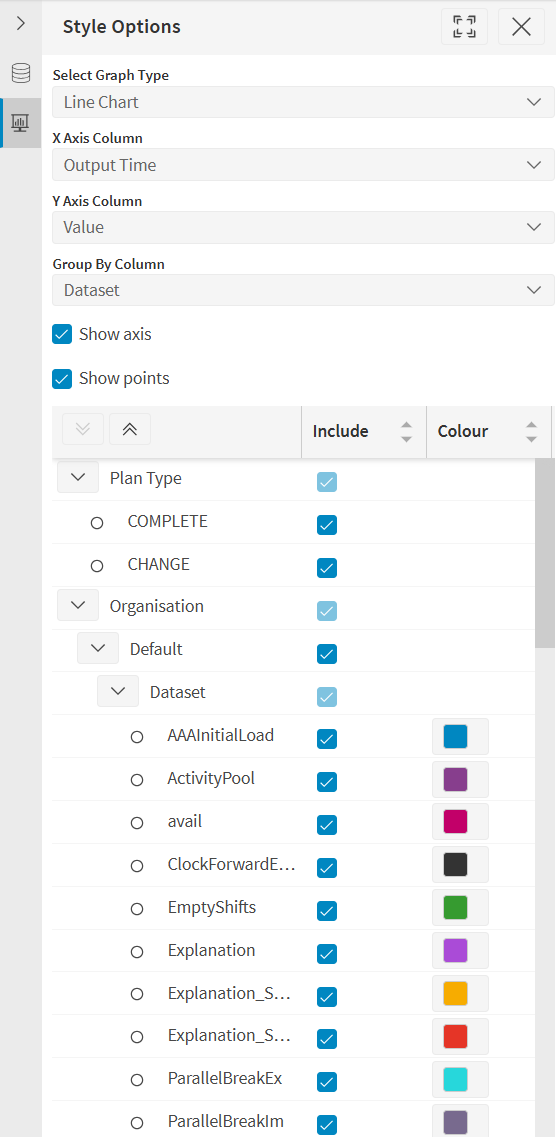
The following options can be selected:
- Graph Type:Choose one of the following options:
- Line Chart: This will show each data point individually.
- Time Bands - Average Values: This will show a bar chart of average values for the metric within a time range.
- Time Bands - Sum Of Values: This will show a bar chart of the sum of the values for the metric within a time range. This is only available in special cases.
- Time Bands - Total Rows: This will show a bar chart of the total number of rows within the time range. There is no y-axis selection in this case.
- Time Band Period: Choose from Daily, Hourly or every minute (does not apply to line charts).
- X Axis: Select the column values to use for the x-axis. Any date based column can be used.
- Y Axis: Select the column values to use for the y-axis. Numeric and duration based columns can be used.
- Group By: Select the column to use to group the data by. A line or bar will be displayed for each group value.
The lower grid allows the user to filter the data based on the group by options. For example, this can be used to display a single dataset, or to filter which application types are included.
Suggested Selections
For each data option, a default display has been selected that provides useful insights.
For the plan table, most of the y column options provide useful information about the schedule. The 'time taken' option can be used to see how long plans are taking to be produced.
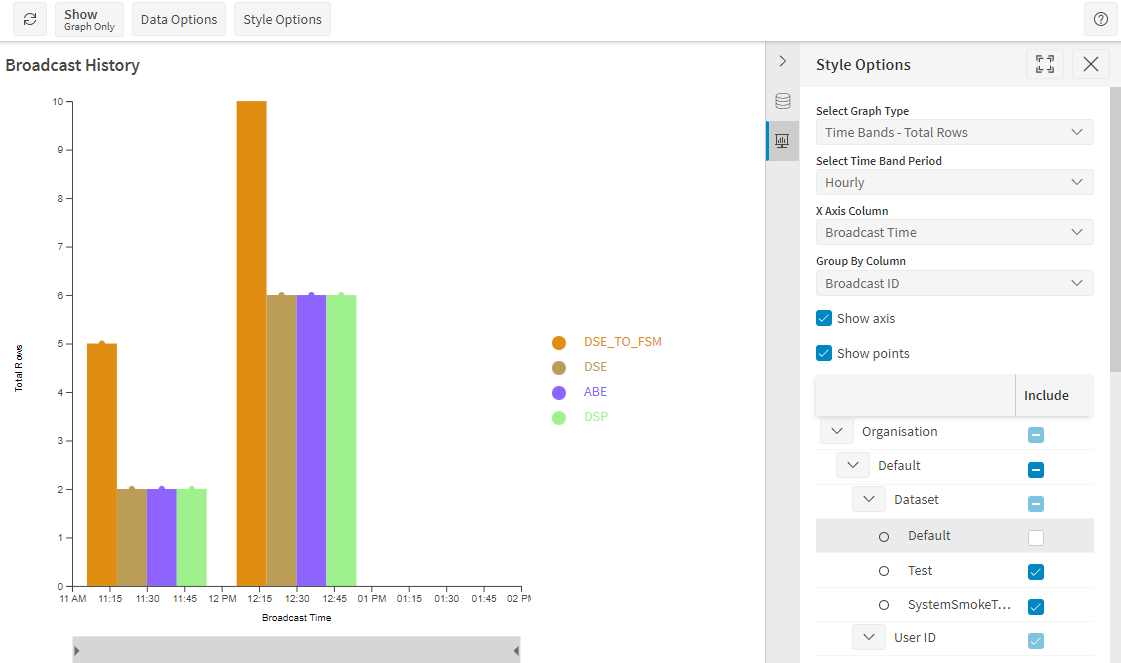
It may also be informative to group the plan data by time bands. The 'Time Bands - Total Rows' option will show the number of plans produced within each period. In this case it may be useful to group the data by application type.
For the Appointment History table, the default view shows the full end to end processing time of each appointment. You can also view the time taken to input the request and the time taken for the appointment booking engine to return a response.
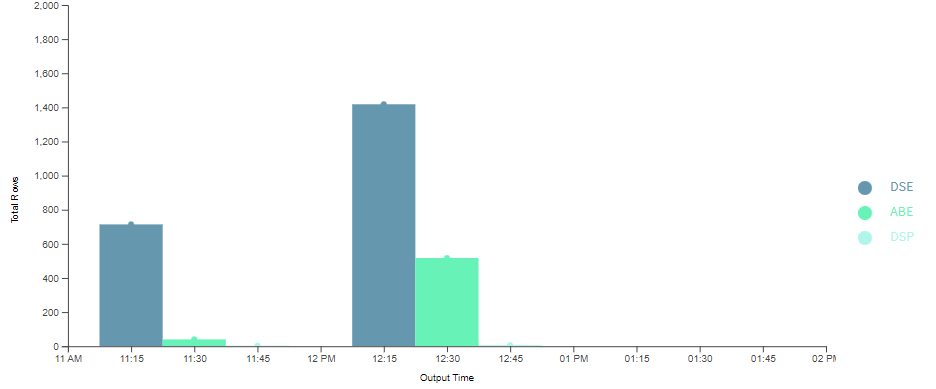
To gain an insight into the load on the system, the 'Time Band - Total Rows' option can be used, which shows the total number of appointment requests being made within each band. The 'Requested Slots' and 'Offered Slots' options also give some insight into the load on the system, and these can be viewed using the 'Time Band - Sum Of Values' option, e.g. to see the total number of slots requested in each time band.
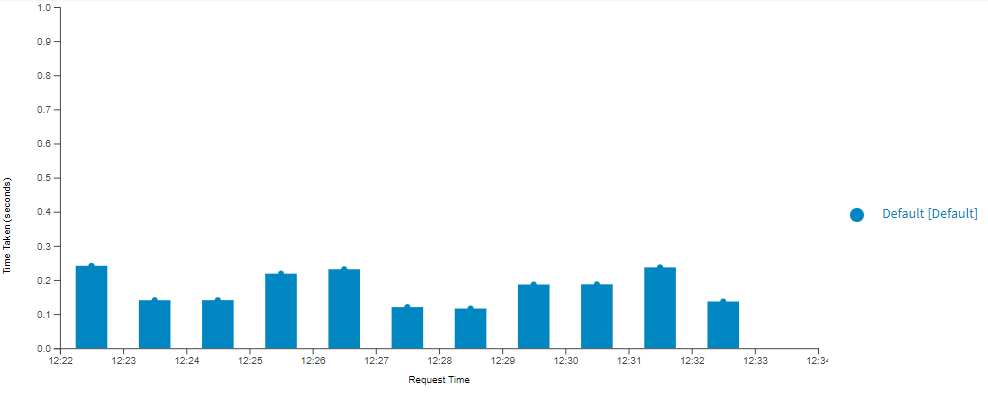
The Broadcast History option will by default show the 'Send Time Taken'. Note that when broadcasting to an external service, this time represents the time taken for the receiving service to handle the broadcast, and for the call to the external endpoint to return. Any significant delays here are likely to be due to the receiving service.
The 'Time Band - Total Rows' option will in this case show the number of broadcasts that have been sent.
The Input Reference option will by default show the number of rows of data sent into the system each hour. It can also be used to see the number of deletions (which are more expensive to process). The 'Time Band - Total Rows' option will show the total number of inputs being sent.
By default this will include both 'load' and 'change' data, but this can be filtered to only show change data using the group filtering grid.
The 'Input Lag' option shows the difference between the schedule time specified in the input data and the time stamp on the data being saved in the system. Any significant differences here may be due to delays in the data reaching PSO, or delays in PSO processing the data, or due to clock differences. For historical data the input lag will not be recorded.
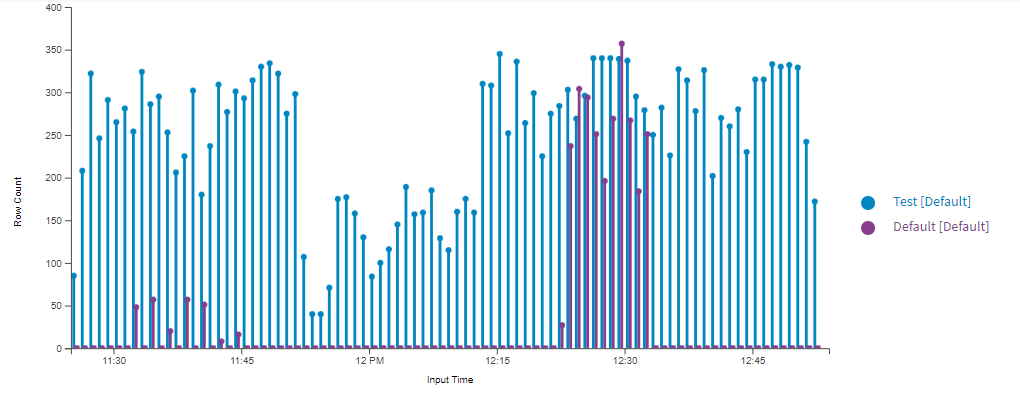
For the Organisation / Dataset Usage options, you may also wish to view the data as a line chart over time.
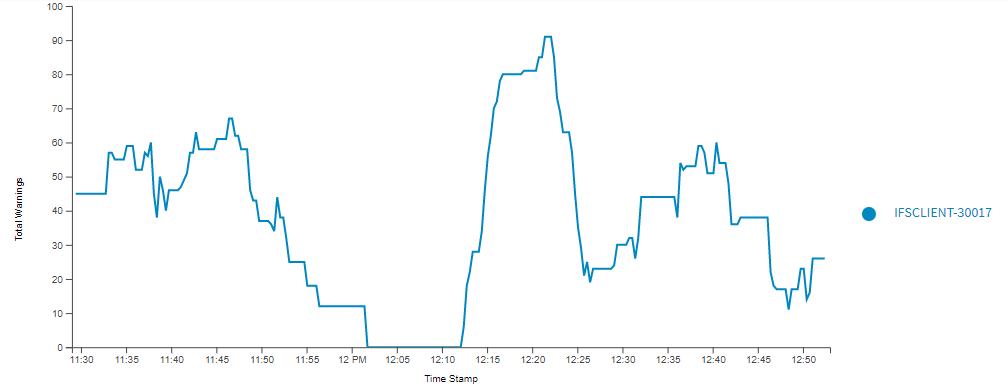
For the System Status option, the default view shows the 'Total Live Footprint', which is a measure of the volume of data being processed in currently running dataset. This can be compared to the 'Total DSE Capability'. The 'Total Errors' and 'Total Warnings' options will show how the number of recent errors and warnings recorded has changed over time (using a 10 minute window by default).
Sessions
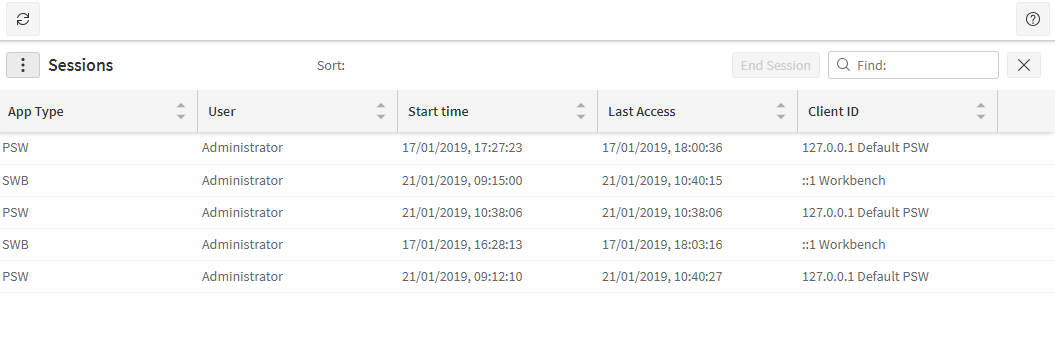
The sessions screen displays the list of active user sessions for the applications. Sessions can be ended by deleting them. If the ended session is a Scheduling Workbench session the user will be presented with a message saying their session has expired and then must re-login to continue.
Support
The support screen allows the user to select specific data to be exported from the Workbench. To be able to access this screen the user needs the permission 'AdminSupportView'. This screen is intended for use when raising support cases for PSO. This screen will allow users to export a large amounts of the data available to the organisation it is a part of so it is recommended that this permission is given out sparing to users, specifically it should be given to the user who raises support cases.
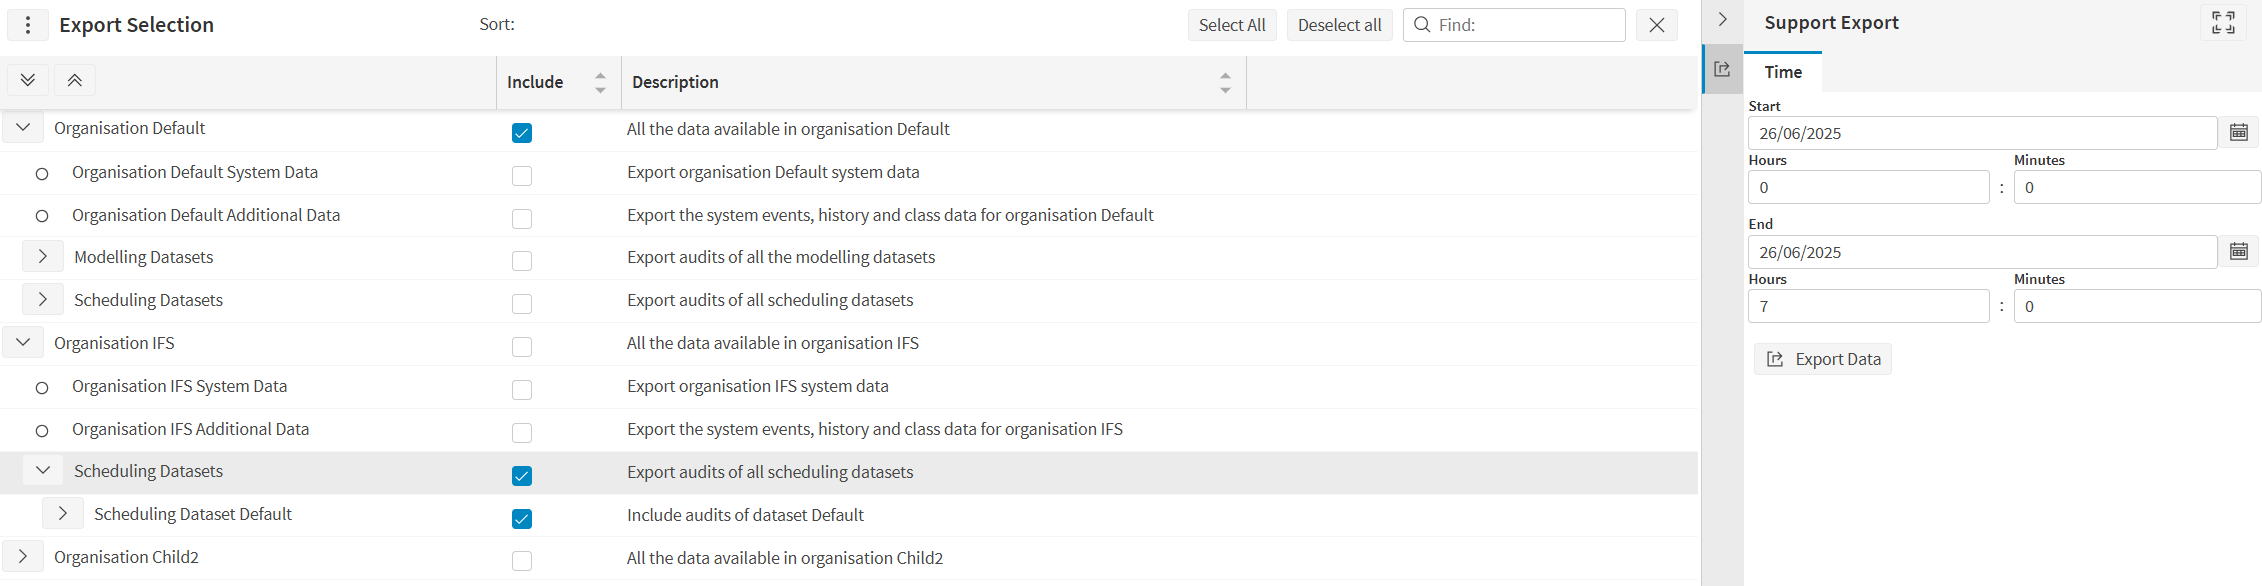
On the screen the user is able to select organisation specific data Which includes the system data, the audit trails of both scheduling and modelling datasets, an ARP export of each modelling dataset, a previous saved schedule of a scheduling dataset, the option to create and export a saved schedule at the schedules current time and WISE investigations. The user will be able to select any combination of the data but it is recommended for support cases being raised to include as many of the options for the organisations or dataset which are relevant.
Once the user has selected the items they wish to include in the export they can filter the data by a time period by using the side panel. Selecting dates in this filter will restrict the Workbench to exporting audits and system events whose audit_timestamp and date_time values respectively are within the filter. If there is no scheduling LOAD during the selected dates then additional data will be downloaded to ensure a LOAD is always included in the export. When the user is ready to export they will need to click the Export Data button at the bottom of the panel which will trigger the Workbench to begin downloading the requested data. Once the data has collated the user will be given the option to download the file which should be given as a compressed folder called 'PSO_Support_Data'.
Note
When a large amount of items have been selected the download may take a long time to complete. To improve download reliability we advise exporting no more than a single day. If multiple days of data is required multiple exports can be done.
System Diagram
Displays a diagram of the complete system running against the System Database. The point of the diagram is to give the user a full graphical overview of the system.
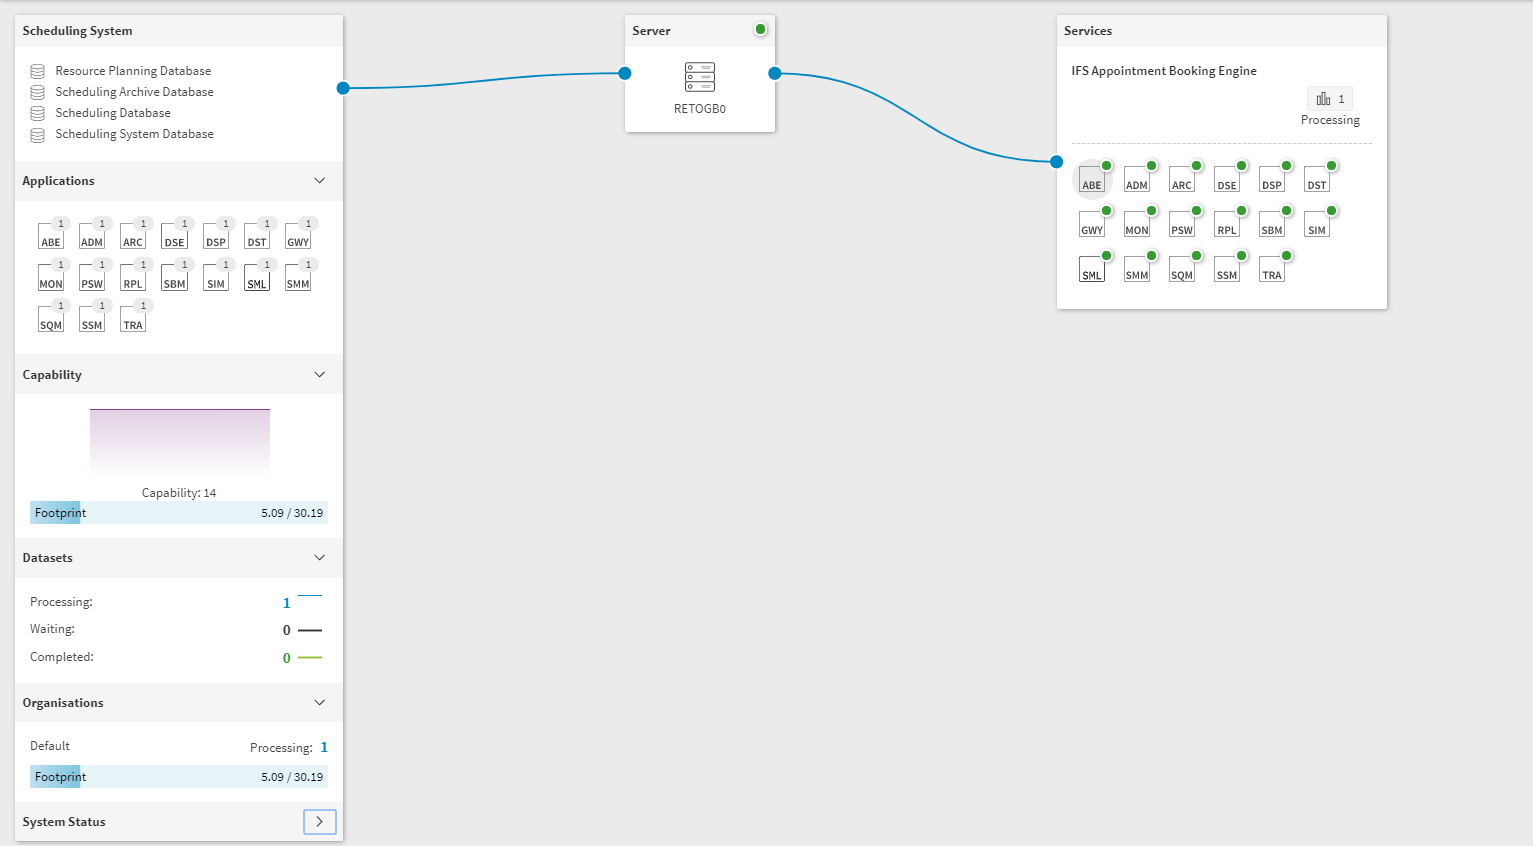
At the centre of the diagram is the servers connected to the Scheduling System. Servers link to services section which indicates the running services within each server. The CPU and memory usage of the servers can be shown by enabling the LogStatistics parameter.
Warning
The LogStatistics parameter is not enabled by default since it has a performance impact. Once enabled the system should be monitored to ensure there are no adverse effects.
If the services are running, a green notification will show on the top right side of each server.
Each server is linked to the Scheduling System. Scheduling System holds information about external databases connected to the system, total running services, existing organizations, and system status.
The bar charts on this page display a comparison between footprint and capacity. The footprint of a processing dataset is an estimate of how difficult the dataset is to schedule. The capacity is the capability of a server multiplied by the overload factor, where capability is the estimate of how powerful a server is and the overload factor is a parameter which specifies how much each server may be overloaded. The default value has been chosen to ensure optimal use of each server. The value of the capacity indicates the amount of footprint a server is able to process.
If viewing the system diagram as a child organisation you can see information for the organisations you have permission to see. Information for other organisations and datasets will be aggregated and displayed under the heading of 'Other'.