Getting Started
The Scheduling Workbench provides a full spectrum of screens and tools to allow users to monitor, manage and interact with the scheduling system.
Accessing the Scheduling Workbench
This section describes how to directly access the client.
Note
In some installations it may also be possible to access the Scheduling Workbench from within another application.
For example, for customers using IFS Applications, there will be a link to the Scheduling Workbench from within the IFS Applications user interface.
Open a supported browser and point to the URL of your Scheduling Workbench installation. The exact URL will be dependent upon your installation, but is likely to be in the format below:
https://root_url/pso/workbench/account_id
Here the root_url is the root URL to the Scheduling system installation. For on premise installations this may be a server name. The account_id is the account that your organisation is set up to use. For on premise and private cloud installations this is likely to be 'Default'. The account_id is case-sensitive, logging in with 'Default' is not the same as 'default'. Your system administrator should be able to provide you with this information if you are unsure.
Note
On IIS and Azure VMSS deployments the Workbench default path is /IFSPSOWorkbench.
You will need to have been granted access rights to the workbench by your system administrator.
Note
In earlier versions of Azure installs the database was created as case-insensitive allowing the account_id to be entered in either case.
Logging In
Depending on your installation, you may be required to log into the Scheduling Workbench each time you use it. If so the log-in screen will appear when you first start the application.
Note
If your installation is set up to use an Active Directory mechanism, or Single sign on, you will not be required to login, and the main scheduling workbench application will launch immediately.

To login, simply type your Username and Password into the fields provided, then click login.
You may be prompted to change your password. If so simply type a new password and repeat it to confirm. You can change your password at any time if desired by clicking the 'Change Password' link.
Once you have successfully logged in, the main workbench application will appear
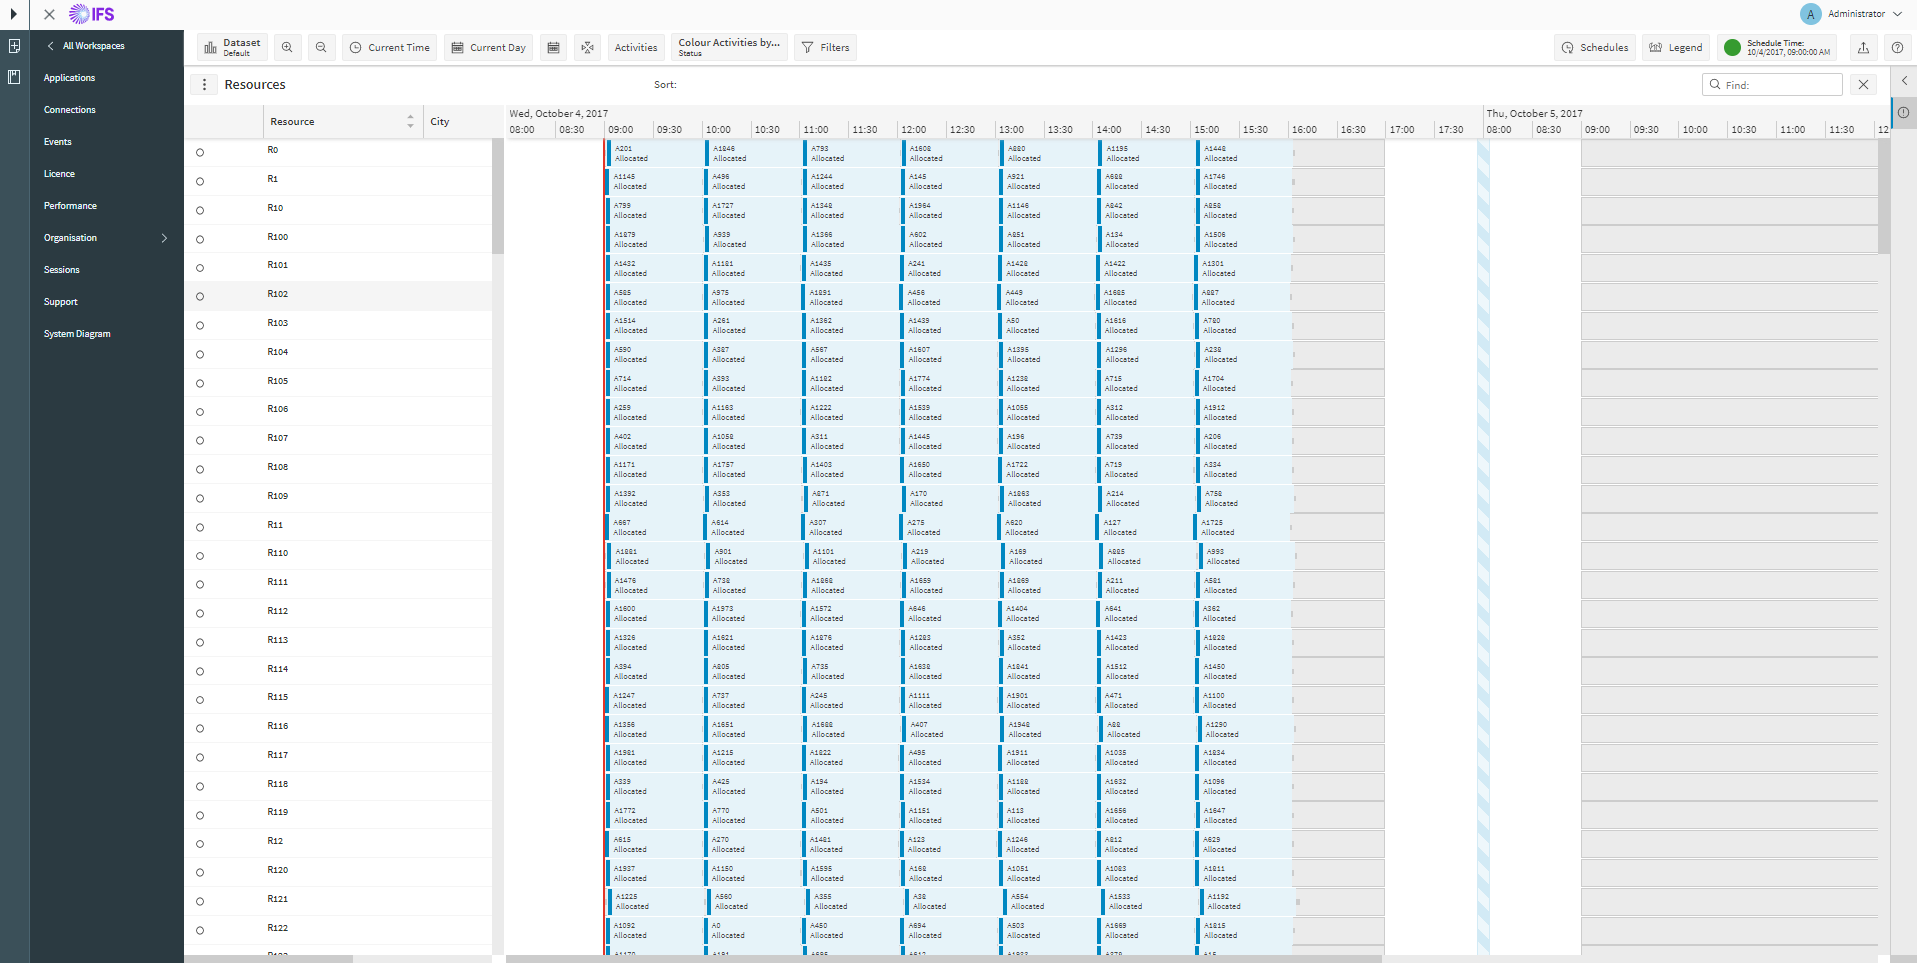
Workspaces
The Scheduling Workbench consists of a number of workspaces, each providing functionality in a different area. Each workspace consists of a number of individual screens, or views, and a summary of this is detailed below.
Scheduling Workspace
This shows the plans produced by the Dynamic Scheduling Engine, and allows users to interact with them. It consists of the following views.
| View | Description | Visibility | Detailed Description |
|---|---|---|---|
| Resources | Displays a Gantt showing the activities scheduled to each resource. | Shown by default. | Scheduling - Resources and Activities |
| Activities | Displays a Gantt showing the allocation of each activity. | Shown by default. | Scheduling - Resources and Activities |
| Mapping | Displays a map showing the routes of each resource. | Requires a map provider to be set up. | Scheduling - Mapping |
| Itinerary | Shows allocation details for individual resources. | Not visible by default. | Scheduling - Itinerary |
| Analysis | View statistics related to the current schedule. | By default only admin users see this screen. | Scheduling - Analysis |
| Compare | Allows easy comparison between activities and resources by displaying their details side by side. | Shown by default. | Scheduling - Compare |
| Schedule Assistance | Provides help with manually matching activities to resources. | Not visible by default. | Scheduling - Schedule Assistance |
| Explanations | Provides detailed information for the allocations in the current schedule, for example to explain why an activity have not been scheduled. | Shown by default. | Scheduling - Explanations |
Planning Workspace
The focus of this workspace is to set up base data to support the schedule input data, and in particular to plan the shifts that resources will be working.
The workspace consists of many data grid style data entry screens (Activity Types, Resources, Skills, SLA Types etc.). In addition, the Resource Planner screen is where resources can be planed into divisions and teams, and shifts can be generated for the resources.
Administration Workspace
This workspace provides details about administrative tasks in the PSO Workbench. It consists of an 'Organisation' section, which allows the user to manage organisational data such as parameters and permissions, and other system level screens that display details about the applications running and the system performance. A child organisation will not usually have access to the system level screens.
Archive Workspace
This workspace provides an audit trail of all recent updates to the system. It also allows scheduling snapshots to be taken, for example to capture the end of day schedule each evening.
Simulation Workspace
This workspace includes a range of simulation functionality, including the WISE where users can investigate the effect of changes to their current workload and resourcing.
Navigation Menu
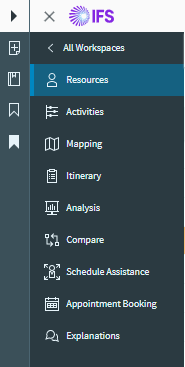
The navigation menu appears on the left hand side of the screen. This allows the user to switch between the various workspaces and screens that make up the Scheduling Workbench.
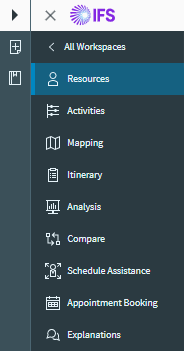
The menu can also be hidden by clicking the 'X' in the top left above the menu. Once, hidden, click the three horizontal lines image to reopen the menu.

User Options
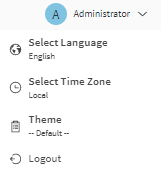
In the top right of the screen the name of the current logged on user is displayed. Clicking on the user brings up an options menu, where the user can choose to change the language and time zone that the data is displayed in. There is also the option to logout.
Bookmarks
A bookmark is a "short-cut" to a PSO page. For some pages this can also specify a selection of filters, time zone and dataset, or it can just be a bookmark for the page. Several bookmarks can be created for the page if they have different settings for dataset, timezone or filters, but each bookmark must be unique in some way.
If the Multi-screen feature is enabled, bookmarks can also be configured to open in the main window or to open as a new child window in a separate browser tab. If the application is closed and reopened, open child windows will be reopened as browser tabs. When a child window is closed the bookmark will still be configured to use a child window. Only one instance of each bookmark can be open in a child window at a time.
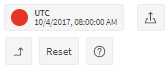
If the Multi-screen feature is enabled, there will be a Multi-screen features button in the toolbar. The Reset button will close all open child windows and set all bookmarks and pages to operate in the main page. Finally, the pop in to main window button will close the child window and set all bookmarks back to use the main window.
Bookmark Menu
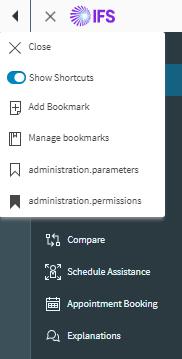
The arrow at the top left of the screen opens a dropdown bookmarks menu. The close button will close the popup. The Show Shortcuts toggle controls whether the bookmarks bar on the left of the screen is displayed, this is on by default. The next button will start to add a new bookmark, by opening a new control in the tools panel. The second button will open the manage bookmarks tool panel. After these, the users defined bookmarks will be displayed. The icon used for each bookmark is defined when creating or editing the bookmark. The ordering of the user defined bookmarks can be changed in the manage bookmarks panel. By selecting on one of the user defined bookmarks the user will be redirected to that bookmark (in the main page, or by opening a child window).
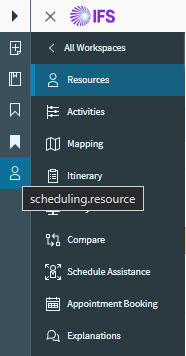
The bookmarks bar appears on the left hand side of the screen if it is on. This has similar options to add, edit or use a bookmark. By hovering over the icons in this menu a tooltip will appear displaying the name of the bookmark.
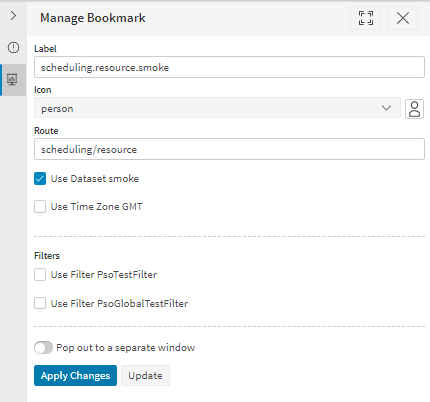
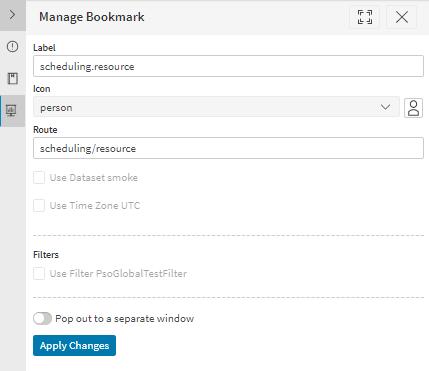
By selecting Add Bookmark from the bookmark menu a new panel called manage bookmark will open on the right side of the screen. In this panel the user will be able to create a new bookmark for the PSO workbench. This panel by default will open using the systems current state, for example if this panel was opened on the Scheduling Resources page using dataset Smoke and time zone GMT the panel will look similar to below:
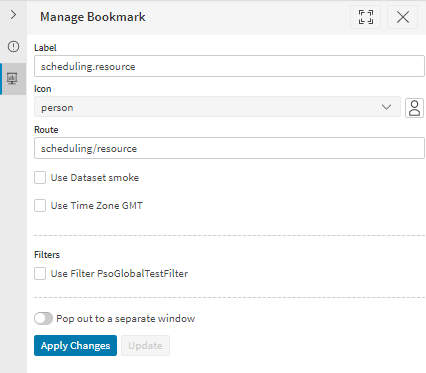
When adding a new bookmark the user will be able to modify the label, icon and (if it is appropriate to the page) options to use the current dataset, time zone and any of the currently applied filters. The option to select a dataset is restricted to the scheduling and modelling pages. Similarly, the option to select filters is restricted to scheduling pages. If the user has the MultiScreen permission they will also have the option to pop out to a separate window. The label of the bookmark has a useful default value which depends on the selected options, or can be changed.
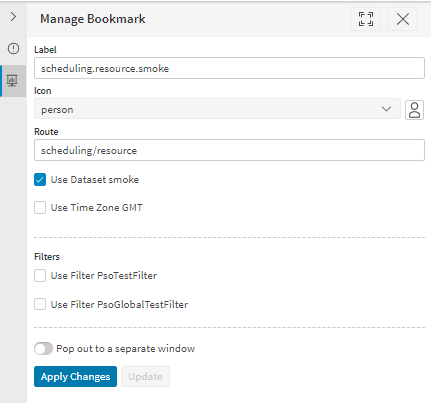
In the above image notice that selecting Use Dataset Smoke has also given the option to use more filters. The option to use filters on a bookmark are dependant on whether the bookmark is using a dataset. If the bookmark is not using a dataset then only global filters will be available to use on that bookmark. If the bookmark is using a dataset then global filters and any filters specific to that dataset will be available to use on that bookmark. In the above example PsoGlobalTestFilter is a global filter which can be used regardless of using the dataset Smoke and PsoTestFilter is a filter that is specfic to dataset smoke.
The icon of a bookmark will also be prepopulated by this panel. If the target page of your bookmark has an icon, this will be the default icon for the bookmark. The icon can be changed by selecting a new icon from the dropdown list. Only built in icons are available for bookmarks.
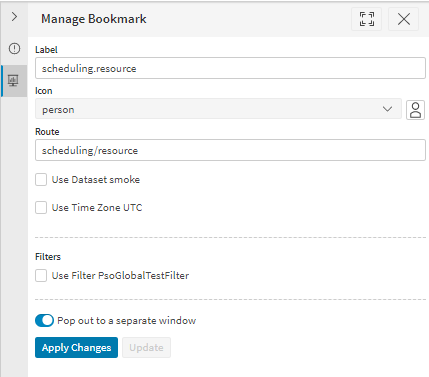
When adding a bookmark an update button will be shown on the manage bookmark panel. This button will be disabled when the panel is first opened. If the workbench state changes after the panel was opened then the update button will be enabled. In the example below, changing the time zone enables the update button.
Clicking this button will update the fields of the bookmark to the current workbench state. In the example below, changing the time zone enables the update button and by clicking this the choice of time zone is updated from GMT to UTC.
Clicking the Apply Changes button will add the bookmark to the list of user bookmarks. This will become immediately available in the bookmark menu to use. If the user has selected Pop out to separate window then the bookmark will open in new browser tab.
By selecting the Edit Bookmarks from the bookmark menu a new panel called Edit Bookmarks will open on the right side of the screen. From this panel the user will have the option to add, edit, delete and reorder bookmarks. By pressing the add button the user will be redirected to the manage bookmark panel which will behave the same way as previous demonstrated. By clicking delete the user will delete the currently selected bookmark. By selecting the up and down arrows to the right of each bookmark the user is able to reorder the bookmarks. By clicking the up arrow the bookmark and the bookmark above it in the list will swap positions. Similarly by selecting the down arrow the bookmark and the bookmark below it in the list will swap positions. Bookmarks can also be reordered by dragging them in the popup bookmark menu.
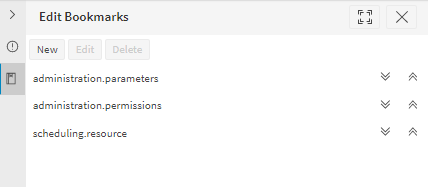
By clicking the edit button from the panel, you will be redirected to the manage bookmark panel again. However, when opening this panel from the edit button the panel will be populated with the details of the bookmark. When editing a bookmark the user can only modify the label, icon and whether the bookmark pops out to a new window. To change other values the bookmark should be deleted and a new one added.
Toolbar
At the top of each page is a toolbar with specific options for that page and workspace. For details of what is included in this toolbar, see the appropriate section of the guide.

Gantt controls
A number of screens within the Scheduling Workbench contain a Gantt control. In each case this will consist of tabular information on the left hand side of the screen, with a timeline to the right hand side.
There are a number of ways to navigate around the Gantt, either using the mouse or using the Gantt navigation buttons included in the toolbar.
- Zooming in or out. The zoom in and zoom out buttons can be used for this purpose. In addition, double clicking on the Gantt timeline will zoom the Gantt in, centred at the mouse position. If the user holds the shift key while double clicking this will zoom out instead.

- Changing the display date. Use the horizontal scroll bar to scroll left or right. There are also toolbar options to centre on the Current Time (keeping the current zoom level), to show the first day of the schedule, to select a particular day, and to show the entire schedule.

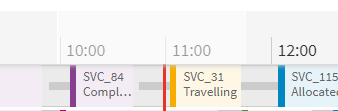
- Zoom to a specific period. This can be done by highlighting the period you want to zoom to on the timeline. Hold the left mouse button down at the start of the period you want to zoom to, and release it at the end of the period. The selected period will appear in lighter shading.
- Find box. The find box can be used to filter the rows in the Gantt, based on any text in the columns or in the Gantt itself.

Grid Controls
A number of screens contain data grids where tabular data is displayed and can be edited.
When data is added or changed in these screens, the row show with an orange background, like this:

Changes may then be saved or discarded using the 'Apply Changes' or 'Reject Changes' buttons in the toolbar.

If the data in the row is invalid, the row will show with a red background any columns containing invalid data will show with a red border.

Terminology
The following table defines the terminology used in the scheduling workspace, and in this document. This includes particular terms for certain concepts related to scheduling, which may differ from those commonly used in your organisation.
| Terminology | Description | Common Synonyms |
|---|---|---|
| Activity | Work or period of time to be scheduled. | Call, Job |
| Location | Geographic location identified by its latitude and longitude. | Site |
| Parts | Physical items required to complete an activity. | Materials, Equipment |
| Plan | Output list of activities and their start times, current status, and assigned resource. | Schedule |
| Resource | Mobile workforce to be scheduled. | Engineer, Operative, Agent, Technician |
| Shift | Period of time that a resource is available to be scheduled. | Capacity, Availability |
| Visit | Activities may be split into a number of sections. This may be due to the duration of the activity or the need for a resource to have a break. Each section is referred to as a visit. An activity must have at least one visit. | Activity, Call, Job |