Scheduling - Analysis
Analysis
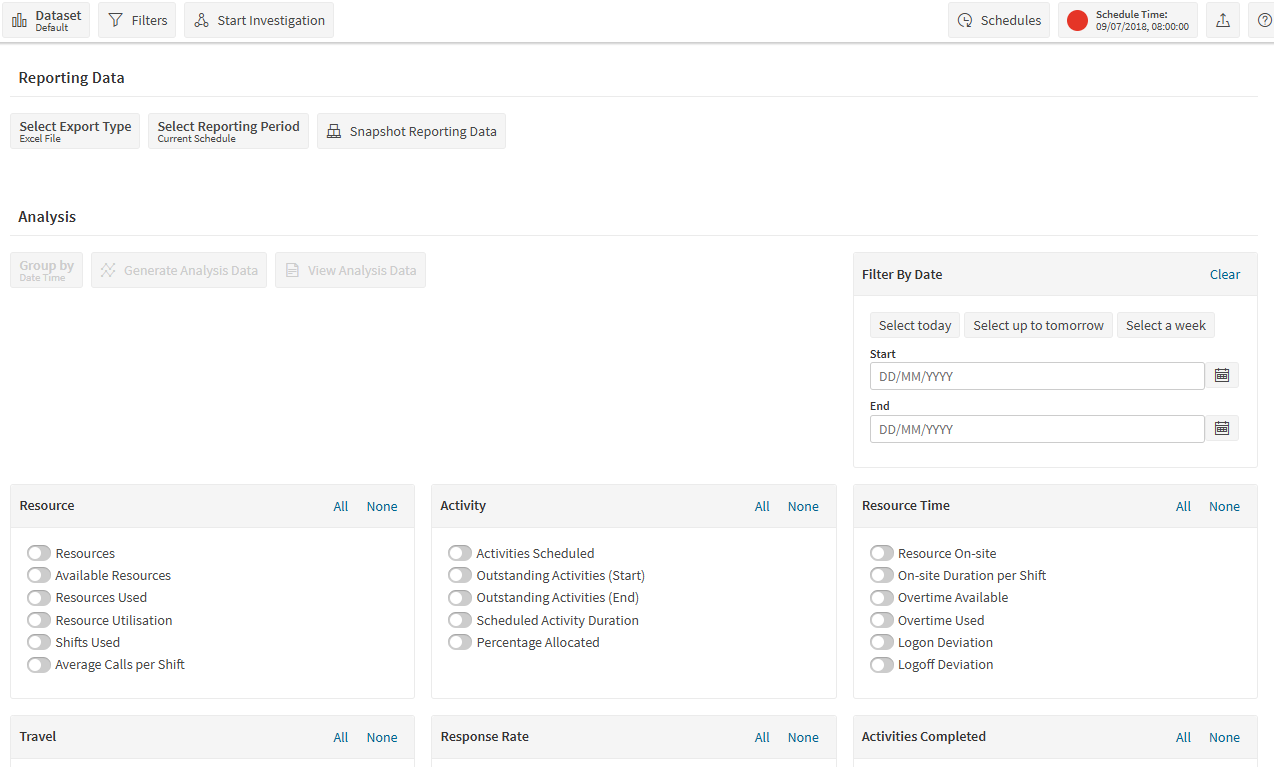
The Analysis view provides the user with the ability to view statistics about the resources and activities in the current schedule, both for the whole scheduling period, and on a day-by-day basis.
The analysis is comprised of two parts - generating full reporting data and generating analysis data.
Only customers with a licence for reporting will have the option to generate full reporting data.
Note
The 'Start Investigation' button in the top menu will take the user directly to the WISE screen, with the current dataset ready to be pre-loaded as a baseline schedule. This is only available for users with permission to use the WISE.
Warning
When using a Group By, the results returned will be dependent on the input data and if entries are missing in the input data then the value returned for "All" may not match up with the sum over the constituent rows. For example, if grouping by Activity Type and there are Activity rows in the input data that have an activity_type_id but there is no corresponding parent Activity_Type row for that activity_type_id (i.e. bad input data) then the Analysis results will only show the constituent results for valid data. However, the value for "All" will include all activities, irrespective of any grouping. As another example, if grouping by Activity Region and the Locations in the input data do not have a corresponding region defined (via either a region_id on the Location row or a Location_Region entry) then the constituent values in the Analysis results will not sum to the total given by "All". Examples such as this indicate problems with the input data that should be addressed to allow accurate scheduling and analysis.
Reporting Data
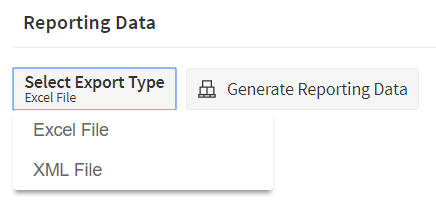
Reporting data can be generated as either an XML file or an Excel file. The data format is the same as that used in the Schedule Archive Reporting tables. However the data is taken solely from the current loaded schedule, so does not include any historical archive data. See the Schedule Archive User Guide for further details on the data format.
To generate data, simply select the file type you wish to export to (Excel or XML) and click the 'Generate Reporting Data' button. The data can then be analysed either with a third party tool or by creating pivot tables in Excel.
Historical Data
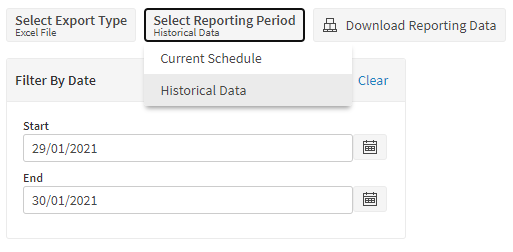
If historical reporting data is available then the option to download this data is available by selecting 'Historical Data' as the reporting period. A date period can then be selected to filter this data. See the Archive > Timetables section for information on enabling the generation of historical reporting data.
Analysis Data
Analysis data allows the user to view or generate an Excel file containing tables of statistics relating to the current loaded schedule. This can be an historical or saved schedule, as well as the current live schedule.
The data can be grouped in a variety of ways. These include by date, or by data relating to either the activities or the resources (customer, resource region etc.). The data can also be grouped by individual resource.
Any filters applied on the Workbench will also be applied when calculating the statistics. In addition a quick date range filter can be applied from the analysis screen itself.
The statistics themselves are grouped into different types (resource, activity, travel, etc.). To select the statistics you would like results for simply toggle the option on. You can also switch on all options of a given type using the 'All' button.
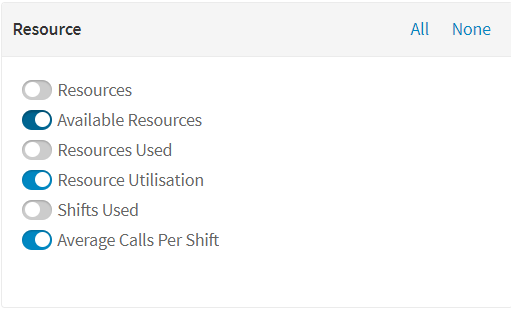
Once some statistics are selected the option to generate analysis data or view analysis data will become enabled.
- Resources – the number of resources in the schedule.
- Available Resources – the number of resources with shifts planned.
- Resources Used – the number of resources with activities allocated to them.
- Resource Utilisation - the percentage of available shift time in which the resources are planned to be either on-site or travelling. Private and break time is ignored from the calculation. Also excludes bucket and parallel resources.
- Shifts Used - the number of shifts with activities allocated to them.
- Average Calls per Shift - total activity calls allocated / total number of shifts with activities in them. Excludes depot activities and other activity types. Also excludes any shifts that are fully unavailable.
- Activities Scheduled - the number of call activities allocated to resources.
- Outstanding Activities (Start) - total number of call activities available to be scheduled in whole scheduling window.
- Outstanding Activities (End) - total number of call activities unplanned.
- Scheduled Activity Duration - total duration of all scheduled call activities.
- Percentage Allocated - the percentage of call activities that are allocated.
- Resource On-site - the percentage of shift time in which the resources are planned to be on-site. Private and break time is ignored from the calculation. Also excludes bucket and parallel resources.
- On-site Duration per Shift - total time resources are expected to be on-site / total number of available shifts. Excludes bucket and parallel resources, and excludes any shifts that are fully unavailable.
- Overtime Available - the sum of the overtime on all shifts for all resources.
- Overtime Used - the sum of the overtime used on all shifts for all resources.
- Logon Deviation - the total difference between the shifts start time and the actual resources logons. The value will be positive if the actual logon is after the shift start and negative if before the shift start.
- Logoff Deviation - the total difference between the shifts end time and the actual resources logoffs. The value will be positive if the actual logoff is after the shift end and negative if before the shift end.
- Distance Travelled - total distance travelled to activities (not including travel home from last activity).
- Travel Duration - total travel time to activities, including travel home from last activity.
- Travel Distance per Activity - total distance / total number of call activities.
- Travel Duration per Activity - total duration / total number of call activities.
- Travel Distance per Shift - total distance / total number of shifts. Excludes shifts that are fully unavailable, and excludes bucket and parallel resources.
- Travel Duration per Shift - total duration / total number of shifts. Excludes shifts that are fully unavailable, and excludes bucket and parallel resources.
- SLA Hits - total number of activities scheduled in the primary SLA.
- Activities Outside SLA - total number of activities scheduled outside the primary SLA.
- Activity Hit Rate - total number of activities scheduled in the primary SLA in the period / number of calls in period.
- SLA Hit Rate - total number of allocations whose start time is before the end of the primary SLA whose SLA is ending in the current period / number of SLAs that end in the current period.
- Average Response Time - average time difference between the schedule start time and the planned start time of each call.
- Activities Completed - the number of call activities completed successfully.
- Activities Incomplete - the number of call activities marked as incomplete when finished.
- Activities Finished - the number of complete and/or incomplete activities.
- Completed / Finished - total activities completed / total activities finished.
- Actual / Predicted Duration - total actual duration / total predicted duration for finished activities.
Note
Travel is counted if travelling to the relevant activity type. Travel home at the end of the day, will not count towards the statistics for any individual activity type, but will count towards the combined statistics for all activity types.
Note
When calculating usage percentages (e.g. Resource Utilisation), the value shown is the percentage of 'available time' for each resource that is being used. Available time includes all shift time that is not covered by either a private activity or a break. For example, suppose a resource is working an 8 hour shift where the final 4 hours is unavailable due to a private activity. If the resource carries out a 2 hour call in the morning then the on site time for this shift would be 50% (2 hours on site out of 4 available hours).
Note
'On site' time will include time spent on depot and repeatable activities, but these are not included in the counts of calls scheduled.
Note
When calculating averages per shift (e.g. Average Calls per Shift), the shift total includes any shift which is at least partly available. A shift that is fully covered by a private activity will not be counted.
Generate Analysis Data
Once the selection is finalised click Generate Analysis Data button and an Excel file will be generated for you to download.

Note
Timespan values will be shown in seconds when downloaded to Excel.
View Analysis Data
Once the selection is finalised click View Analysis Data button to view the statistics on the table. A new button called Back to Analysis will appear on the top left corner of the menu to take you back to the Analysis page.

Note
Timespan values will be shown in seconds when downloaded to a CSV. The value may contain fractional seconds as we are converting the raw timespan value. This may differ from the rounded figure we display on the Statistics table.