Troubleshooting
Possibilities for tracing and debugging can be very important when trying to find the reason for problems like the examples below:
- The message is not sent to the customer's web service
- Incoming messages are not received by IFS Cloud
- Event is not sent by mail
Note: When debug is activated the performance will be slower. Do not have it activated during normal operation.
Overview of the IFS Connect debug concept
It is recommend to read about the IFS Connect overview before you start to use the debug concept.
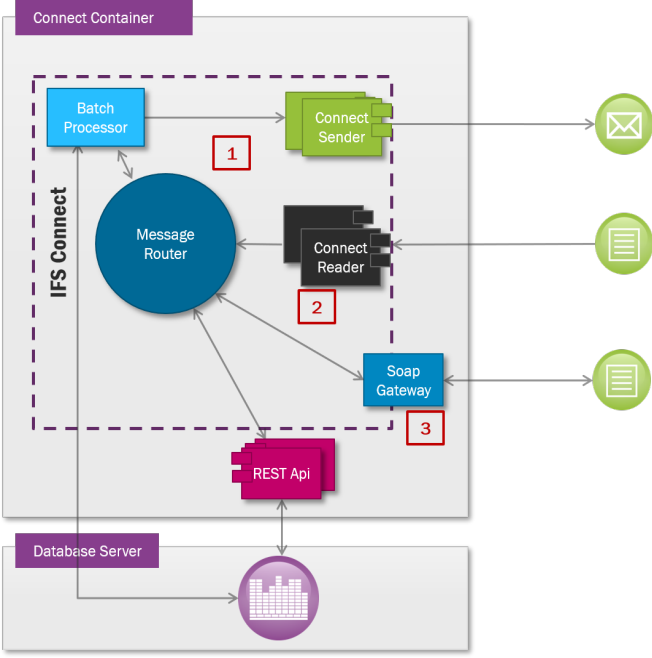
- Ability to debug all message executions that occur in the IFS Connect JEE application.
Example of message executions: - A message is read by Connect Reader and is stored to a message queue
- Batch Processor starts to execute a message located on queue.
- Ability to debug the Connect Readers. For example the file reader which polls a directory for files.
- The message traffic to/from the SOAP Gateway can be traced.
Where to find Error messages
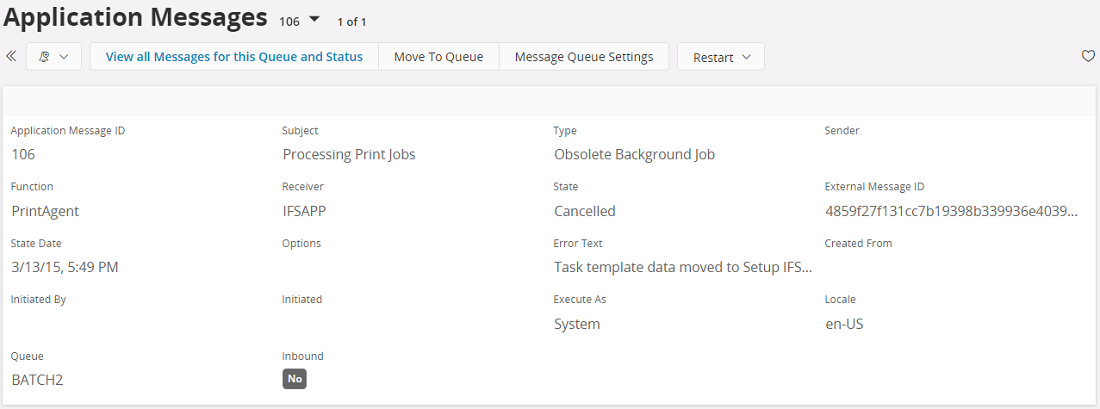
On Application Messages
If message located on a queue has failed or is in retry mode the error will be shown like below:
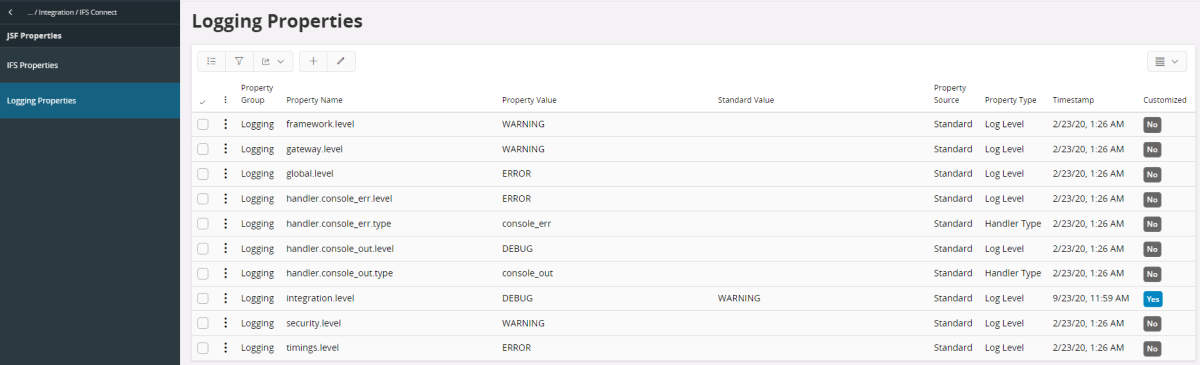
Logging and Debugging of IFS Connect
IFS Connect code is using the new logging framewor for logging and debugging. The amount of logged information is controlled by the level of categories 'integration' and 'batchprocessor' (for the core IFS Connect parts) and 'gateway' (for SOAP Gateway).
There is a Solution Manager page underIntegration, IFS Connect, JSF Properties, Logging Propertiesfor the user to enable and modify looging properties.
Batch Processor troubleshooting
Application flow that involves Batch Processor typically starts in the database and end with sending a message to an external system. An error can occur in any stage of the flow execution and may require different approach to surround the problem. Message processing can involve following steps:
- PLSQL Access Provider creates an Application Message.
A suitable method in PLSQL Access Provider is called from PL/SQL Business logic. A new Application Message record in state Released is then created and inserted to the FNDCN_APPLICATION_MESSAGE_TAB table. A database trigger on this table, after changing the record state to Processing, is send a JMS message. An error that occurs during this process (in PLSQL AP or trigger) will cause the entire transaction initiated by the business logic to be rollbacked and no JMS be sent. - In house built message queueing framework is storing JMS messages in database table BATCH_PROC_QUEUE_TAB.
- Runtime Exception that occurs during message processing by the Bach Processor's Message Driven Bean will cause the entire transaction to be rollbacked and the JMS message in the application is marked for redelivery. If the processing will continue failing after a number of attempts, the JMS message will be suspended in the JMS queue.
- An error that occurs during the message processing by the Batch Processor code in the connect container will cause the Application Message to be set to state Failed with proper error message saved on the message.
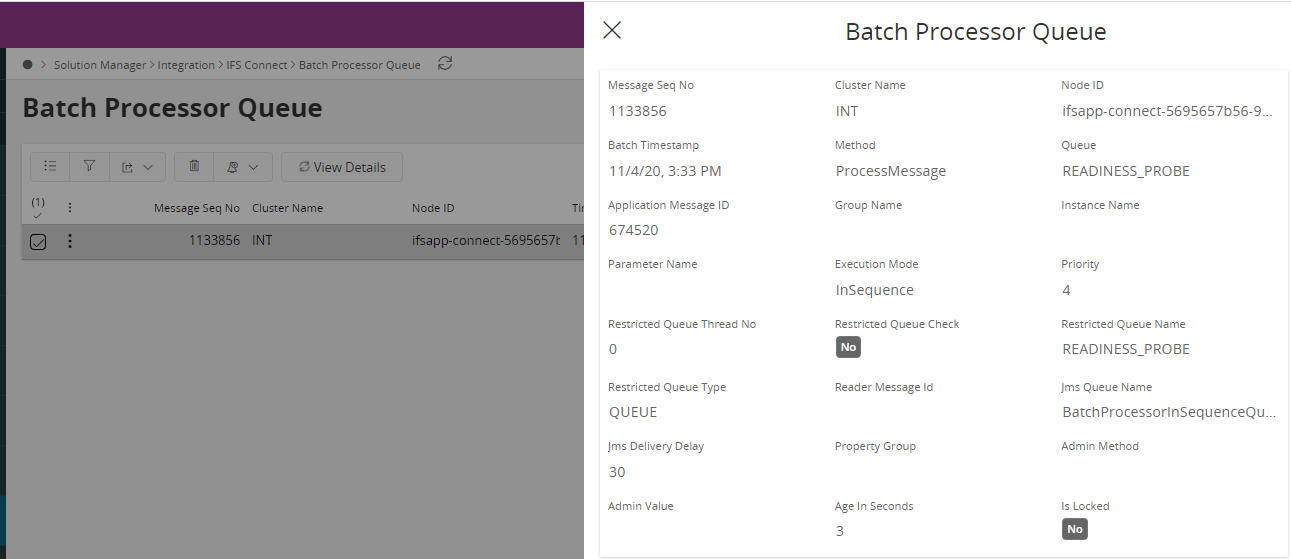
Monitoring JMS Message in the Database
JMS Message created in the database side relevant to an application message can be monitor using Aurena page Batch Processor Queue.
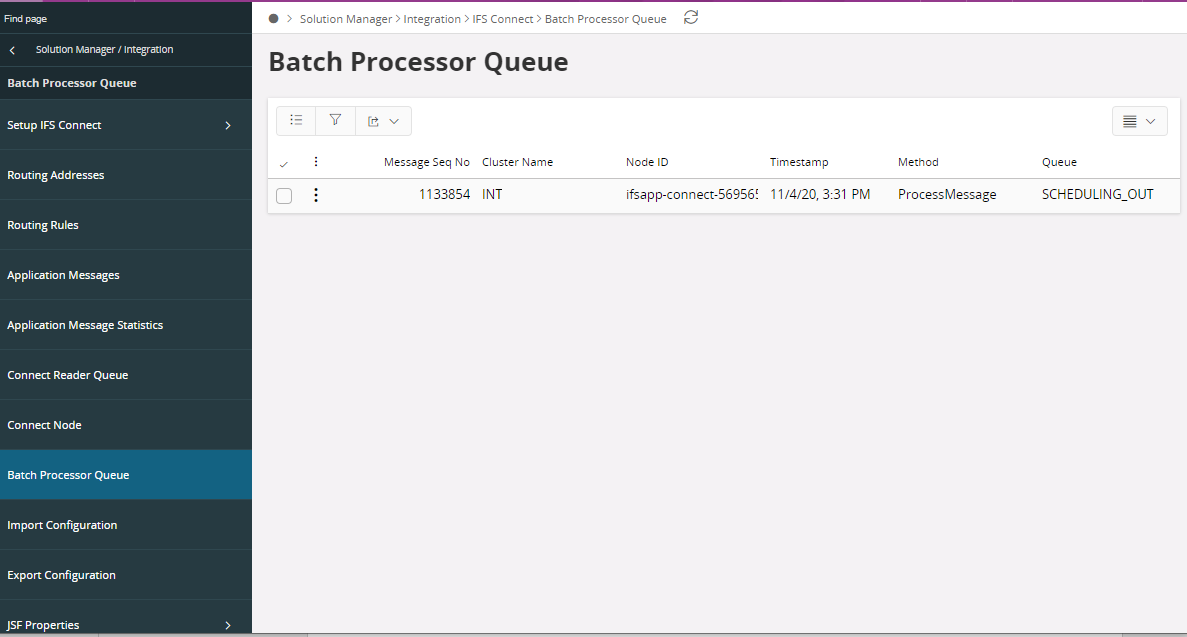
Details of a JMS message can be also seen.