Whenever the framework performs a dispatch, a trace with details about it is
being available in the debug console using the following arguments:
Category: Framework
Sub Category: Customization.
Trace Example: Instance of 'frmPersonInfo' replaced with customized 'frmPersonInfo_Cust'
Depending on the origin of the dispatch, the trace can sometimes also include details of the framework method that made the dispatch like:
Trace Example: cSessionManager.SessionModalDialog: Instance of 'dlgInfoText' replaced with customized 'dlgInfoText_Cust'
A customized window can be "disabled" in order to let the "original" window be opened instead. This feature is something that might help developers, administrators or support personal to pinpoint certain problems, establishing if the error is found in the core window, the customized window or in both windows.
To disable/enable a customized window, do the following:
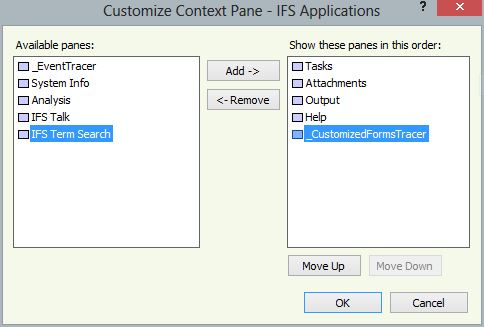
That should have enabled the _CustomizedFormsTracer window in the
Context Panel.
Here, you can disable any customized window by uncheck its checkbox. Remember
that a customized window that is already opened must be re-opened again in order
to get an affect.
The navigator must be re-loaded in order to make all its URL's be re-initialized
or you will otherwise keep navigating to the customized window when you click
its corresponding navigator node.