Analyze Forecast
Explanation
Working/Analyzing the forecast for an item/group are done in 2 different places either the Forecast Graph or the Forecast Table, we will start by looking at the Forecast Graph.
Forecast Graph
Use this window to view a graphical presentation of all the data elements of IFS/Demand Plan. The x-axis unit is time (periods) from the first period of historical data for the current item/group to the last period of the forecasting horizon. The choice of period unit (quarter, month, week or day) is done with the TimeLine Selection in the main toolbar, note that the period version marked as Standard (the period version selected during the configuration of the Demand Plan Server) is the only period version that will show the accurate historical sales. The y-axis unit can be either the standard inventory unit for the current Part No or based on inventory value, planned sales price (cost set for costing or other price info.), net weight, part flow value(unique value for the base flow part), period price(unique value for the base flow part and period).
The y-axis is automatically scaled to fit the data presented. If the window is too small to fit all the data onto the x-axis, you can also scroll through the graph by dragging the x-axis scale in the desired direction. You also have a small picture of the entire graph in the upper left corner with a shadow marking the current selection show, you can also use this are to scroll the big graph section.
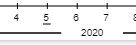
Periods with added period comets are marked in the x-axis with an underline on the period that has a comment added.
A small padlock on the balls indicate that a manual adjustment has been done to the line, if the Adjusted demand and the Historical demand differs without a padlock this indicates that the period has been adjusted by the Demand Cleansing algorithm.
the elements available in this graph are the same as for the:
| Element | Color | Read/Write | Description |
| Demand |  | Read-only | The demand or usage figures read from the base flow SQL. |
| Adjusted demand |  | Read-only | The demand data adjusted in order to provide the best possible basis for calculating forecasts, e.g., adjustments for removing outliers (such as unusually large or small data values and non-annual campaigns), entering data in zero sales periods (due to missing data), run-out situations, strikes, etc. Editing must be performed in the Forecast Table, e.g., removing exceptionally large or small values and entering data for periods where data is missing. Features as sold out analysis and data cleansing will also be reflected in this vector. |
| Inherited demand |  | Read-only | The demand for the item entered in the Predecessor field in Forecast Part page. Note that you also must define the start and end dates for the inheritance period. This functionality facilitates forecasting in situations where one part is phased out and its replacement phased in. When the Inheritance function is activated, the forecast model uses the sum of Adjusted Demand and Inherited Demand to calculate the forecast. |
| Historical forecast |  | Read-only | Before generating a new forecast at the start of a new period (month), the system saves the first forecast period as the current period's historical forecast, in the current forecast. It is also possible to take the parts lead time into account when storing the historical forecast see Advance Server Settings for details. |
| Budget |  | Read-only | The economical budget values may be entered in the Forecast Table window, at any level and compared with the bottom-up cost price forecasts. |
| Target sales plan |  | Read-only | The sales figures from the sales and marketing department. These must be entered or edited in the Forecast Table window. |
| Events |  | Write | Intended for special campaigns or sales when the events have a significant impact on the total usage or demand. Negative values are permitted. Historical event data may explain exceptions/irregularities in the demand data. You can work with event data directly in the graph or in the Forecast Table window. Note that you have individual events in the forecast horizon for each scenario. Only the events in the main scenario will be used as historical events. Note that periods with event adjustments will not be treated as fixed when copy rule From Previous adjusted is selected. The Event period adjusted forecast will be based on the new system forecast and then the event is added to form the new adjusted forecast for the period. |
| Unauthorized Events | Read-only | This is a period in the forecast horizon that is unauthorized, the events in this period is always 0. The users are not allowed to make any adjustments in these periods. These periods are defined by the phase in and phase out dates on forecast part. See Authorize Intervals. | |
| Adjusted forecast |  | Write | Adjusted Forecast = System Forecast + Events + Campaigns, for the selected scenario (see Detail View). You can make changes to this element directly in the graph or in the Forecast Table window. |
| Changed/Locked Adjusted forecast | Write | Changed or locked adjusted forecast, will keep its value after the next periods create forecast job is ran, if you have selected the from previous adjusted in the copy rule of the DP Server see Demand Plan Server Setup | |
| Unauthorized Adjusted forecast |  | Read-only | This is a period in the forecast horizon that is unauthorized, the adjusted forecast in this period is always 0. The users are not allowed to make any adjustments in these periods. These periods are defined by the phase in and phase out dates on forecast part. See Authorize Intervals. |
| System forecast |  | Read-only | A mathematical forecast based on the models and parameters selected in Detail View and calculated using the adjusted demand. |
| Collaborate forecast | Read-only | This is the collaborate forecast that you have made in the collaborate partner graph. If you have not removed any of the collaboration partners from then the collaborate forecast will be the average of the suggested forecast from all your collaboration partners. | |
| Campaigns |  | Read-only | This is the sum of all campaign quantity on the part/group for the period, the campaign quantity will be distributed only on the campaign dates when the forecast is distributed to MS/MRP. But this shows the aggregated quantity. |
| Explanation forecast |  | Read-only | The Explanation Forecast displays the result of applying the Historical Forecast to a forecasting model selected from Detail View. It provides you with some insight on how the System Forecast is calculated. |
| Qty Lost | Read-only | The part's sold out qty in the period. See Sold Out. | |
| Weather Symbols |  | Read-only | When selecting the Daily Weather time line. And you have bought and activated the ML Weather forecast model then you will se a weather symbol for each day in the weather forecast horizon. There are different symbols depending on the forecasted weather, if you hover over the symbol you get the weather details displayed. |
| Start level |  | Read-only | The start level of the LifeCycle model, the sales/forecast of the phase in period. See forecast model and detail view for details |
| Saturation level |  | Read-only | The saturation level of the LifeCycle model, the level where the part reaches its adulthood/full potential. The forecast/sales of the phase in Stop period. See forecast model and detail view for details. |
| Phase out Start |  | Read-only | This marks the start of the phase out period in the LifeCycle model, the period where the forecast start the decline against 0. See forecast model and detail view for details. |
| Phase In Stop |  | Read-only | This marks the end of the phase in period in the LifeCycel model, the period where the forecast/sales reaches the saturation level. See forecast model and detail view for details. |
| Phase In Start |  | Read-only | The phase in period, the first period where its allowed to enter a forecast on this part. See detail view. |
| Phase Out Stop |  | Read-only | The phase out period, the last period where there is allowed to enter a forecast value on this part. See detail view. |
Graph adjustments
Data in Adjusted Forecast and Events may be altered directly in the graph by dragging the graph elements. The system displays the on-line value of the periodical elements as they are dragged
Changes to other elements of the Demand Plan (Adjusted Demand, Budget, and Target Sales Plan) may be done in the Forecast Table. Advanced graphical adjustments are made possible by using the Ctrl and Shift buttons when dragging:
| Key | Name | Description |
| - | Single period | Drag an individual forecast element up or down directly in the graph to raise or lower the forecast value. |
| Shift | Straight line | Drag an index value to the right while holding the Shift key to arrange the elements in a straight line from the initial position of the period to where it was finally dropped. |
| Ctrl | Level | Hold the Ctrl key while dragging any forecast element up or down to raise or lower all elements of this type equally. |
| Shift+Ctrl | Free Draw | Hold the Shift+Ctrl key while dragging any forecast element up or down to draw a freeform line of forecasts. |
Forecast Table
Use forecasts, events, target sales plans, and budgets. Available data elements for the table are:
| Element | Read/Write | Description |
| Toggle Pad Lock |  | Toggles the padlock on the selected adjusted forecast periods. An padlock indicates that the numer for this period has been changed manualy by the user. All non padlocked periods will get there valuse chagned during the next create forecst job where they will be set equal to the system forecast + events and campaing values. |
| Demand | Read-only | The demand or usage figures from IFS/Inventory. |
| Adjusted demand | Write | The demand data adjusted to provide the best possible basis for calculating forecasts, e.g., removing outliers and non-annual campaigns, entering data in zero-sales periods (due to missing data), run-out situations, strikes, etc. Outliers are indicated with a red background (outside 2 standard deviation) in the cells. Yellow background is all demand between 1 and 2 standard deviation. |
| Inherited demand | Read-only | The demand for the item entered in the Predecessor field in Forecast Part. Note that you must also define the start and end dates for the inheritance period. When the Inheritance function is activated, the forecast model uses the sum of Adjusted Demand and Inherited Demand to calculate the forecast. |
| Historical forecast | Read-only | Before generating a new forecast at the start of a new period (month), the system saves the first forecast period in the current forecast as current period's historical forecast. It is also possible to take the parts lead time into account when storing the historical forecast see Advance Server Settings for details. |
| Sold Out Days | Read-only | A day is treated as ’sold out’ when there are no sales recorded on that day and Quantity on stock/hand is 0 at the end of the day. See Sold out Days |
| Qty Lost | Read-only | The “Qty Lost” is the demand expected in sold out days. |
| Holiday Demand | Read-only | Holiday demand is the additional demand occurred due to Moveable Holiday. See Holiday Profile |
| Budget | Write | Budget values may be entered at any level and may be compared with the bottom-up cost price forecasts. Note that the visibility, updatebility for this field can be configured in the Publish Forecast screen. |
| Target sales plan | Write | E.g., sales figures from the regional sales and marketing departments. Note that the visibility, updatebility for this field can be configured in the Publish Forecast screen. |
| Events | Write | Intended for special campaigns, sales, and other events when they have a significant impact on the total usage or demand. Negative values are permitted. Historical event data may help to explain outliers/irregularities in the Demand data, or why changes have been made to Adjusted Demand. When a period is unauthorized then the background color will be gray for that period. See Authorize Intervals. Note that you have individual events in the forecast horizon for each scenario. Only the events in the main scenario will be used as historical events. Note that periods with event adjustments will not be treated as fixed when copy rule From Previous adjusted is selected. The Event period adjusted forecast will be based on the new system forecast and then the event is added to form the new adjusted forecast for the period. |
| Adjusted forecast | Write | Equal to the System Forecast + Events, for the selected scenario. When a period is unauthorized then the background color will be gray for that period. See Authorize Intervals. |
| System forecast | Read-only | A mathematical forecast based on the models and parameters selected in Detail View and calculated using the adjusted demand. |
| Collaborate forecast | Read-only | This is the collaborate forecast that you have made in the collaborate partner graph. If you have not removed any of the collaboration partners from then onwards the collaborate forecast will be the average of the suggested forecast from all your collaboration partners. |
| Campaign | Read-only | This is the sum of all campaign quantity on the part/group for the period, the campaign quantity will be distributed only on the campaign dates when the forecast is distributed to MS/MRP. But this shows the aggregated quantity. |
| Explanation forecast | Read-only | The development of the mathematical forecast (up to the most recent period) with historical data. This provides insight into how the System Forecast develops. |
| Period Price | Write | The price/value of the part in that particular period, will allow the for different price in different time/period. See Select Unit. Note that the visibility, updatebility for this field can be configured in the Publish Forecast screen. |
| Temperature | Read-only | Average Temperature in Celsius, for the base flow location set on the base flow forecast part selected. |
| Humidity | Read-only | Humidity in percentage, for the base flow location set on the base flow forecast part selected. |
| Wind Speed (kmh) | Read-only | Wind speed in km per hour, for the base flow location set on the base flow forecast part selected. |
| Wind Direction (degree) | Read-only | Wind Direction in degrees, for the base flow location set on the base flow forecast part selected. |
| Precipitation (mm) | Read-only | precipitation in mm, for the base flow location set on the base flow forecast part selected. |
| Snow (cm) | Read-only | Snow fall in cm, for the base flow location set on the base flow forecast part selected. |
| Comment | Write | The period comment for this period. |
Prerequisites
- Demand Plan Server needs to be running.
- Forecast part or Group selection needs to have been made
System Effects
<Text>
| Example | Table |
| Use | if appropriate |
| Delete | if not needed |
| <Text> | <Text> |