| Foundation1 / Development Guide / User Interface / Ee Dev / Tools / Debug Console / |
The Debug Console is an analysis tool assisting developers and support teams to debug Enterprise Explorer. The Debug Console can be used for analyzing client as well as server traces.
Debug Console can be started by Tools -> Debug Console menu in the Enterprise Explorer or using the shortcut key combination Ctrl + Shift + D.
This guide describes how the Debug Console works.
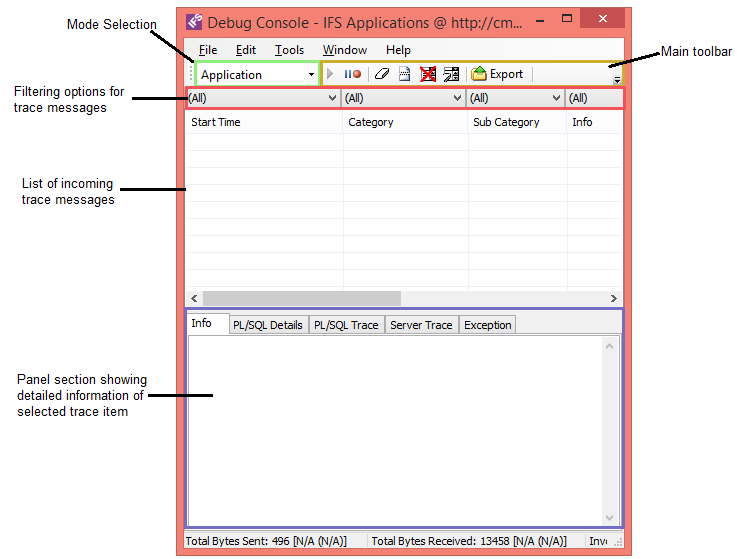
The Debug Console consist of three sections.
In the toolbar you can do the following:
Below the toolbar is the filtering panel which consist of one group box for each column that is visible in the trace view. The group boxes are populated with all unique entries that has been displayed in the corresponding column. If a group box is not empty then the user may filter the trace output by one of the unique entries that can be found. Filtering can be applied on multiple columns simultaneously if desired.
Underneath the filtering pane is the main trace window in which all traces are outputted. Each item in the list can be selected. When an item is selected in the trace view more detailed information related to the item is shown below the trace window. The information section consists of a number of customizable panes (user may choose to hide/show panes by configuring the modes) showing more detailed and formatted information related to the trace item.
The debug console can be run under different modes. Three predefined modes
exists in the mode selection box. The predefined modes are the following;
• Framework: Focused on the framework developers. Most of the trace
options are enabled to make the debug console outputs as much as possible.
• Application: Focused on the application developers. Only outputs
traces related to application forms. Both client and server traces are enabled
but server traces are only focused on application forms.
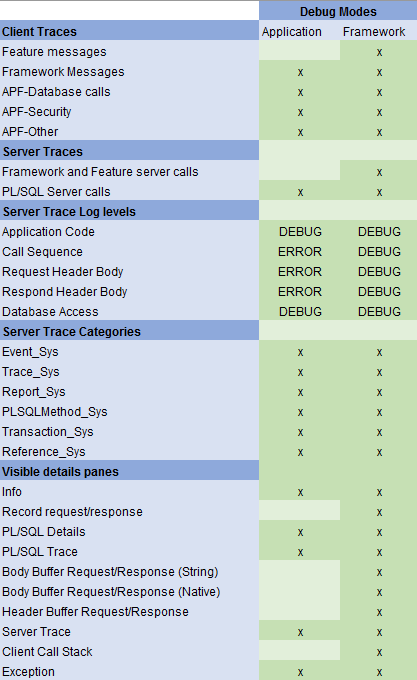
Default settings for the predefined modes are listed in the table below.
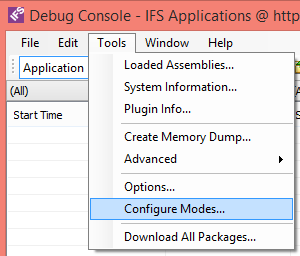
Each debug mode that is available in the Debug Console can be configured. Navigate to the Tools menu and then select the “Configure modes…” menu item. This will open up the options dialog in which the user can configure the modes’.
The upper part of the options dialog is a area dedicated for switching, creating and removing modes. The selection box contains all modes that are currently available in the Debug Console. The area below the selection box reflects the settings that apply for the currently selected mode. Selecting another mode from the selection box will cause the dialog to change the settings located in the the tab windows to the values that applies for the selected mode.
If a user has done changes to one of the preconfigured modes (Application, Framework or Translation) and saved the changes. The name of the mode is extended with "(Mod)", indicating that the mode has been modified from its default configuration. The "Reset Mode" button located in the bottom left section of the dialog is enabled when a predefined mode is modified. Pressing this button will cause the currently selected predefined mode to be reset to the default values that applies for that mode
Note: Default values are "hard coded" and cannot be changed from within the Debug Console.
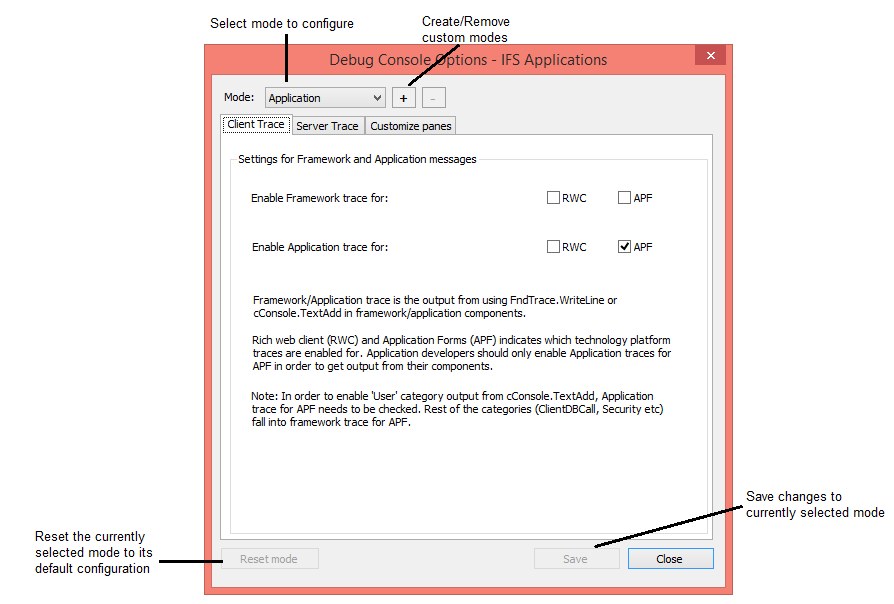
Besides configuring the three default modes, users can also create their own custom mode. In the upper section in the "Configure modes" dialog there is a button marked with a plus sign. By pressing this button the user is presented with an input dialog in which the user is asked to enter the name for the new mode. Pressing OK will create a new custom mode. A prefix of a star symbol (*) is added to the name for the custom mode to mark that it is a custom mode. The user can select the new mode from the mode selection box in the options dialog as well as from the selection box in the main debug console window.
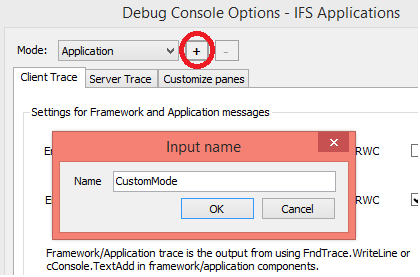
Note: A custom mode does not have any default settings which the user can reset the mode to. So the “Reset Mode” button located in the bottom of the options dialog is always disabled when configuring a custom mode.
Client trace messages can be added by calling the
Ifs.Fnd.FndTrace.WriteLine function, these will end up in the Feature
cathegory.
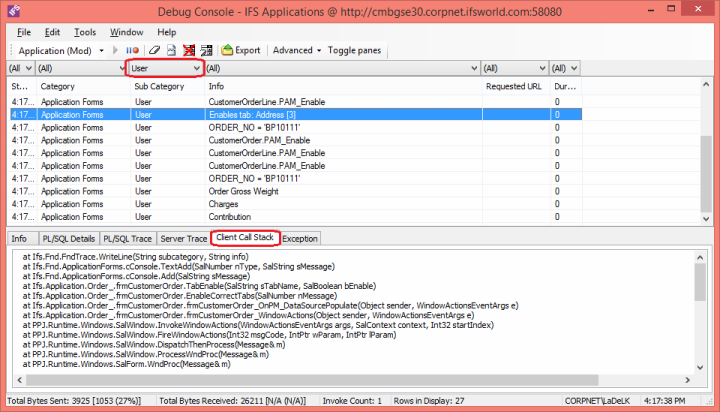
Client Call Stack shows all method calls inside client. This can be very useful to track client-side problems.
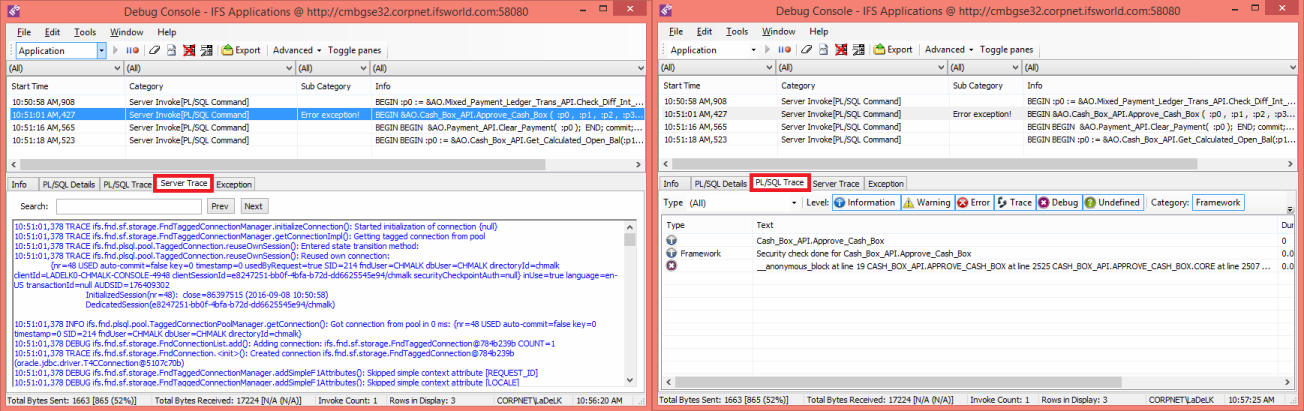
Traces related to server calls often contain trace information received from the server. This information can be found in the "Server Trace tab and PL/SQL traces can be found in "PL/SQL Trace" tab. T
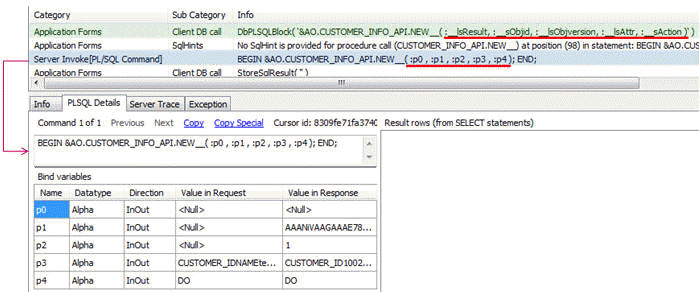
When you conduct an operation that results in a server invoke, two significant trace messages are sent to the debug console. The first message, highlighted in green in the picture below (highlighting is done for documentation purpose and will not be present in runtime), is traced from the application level. The second one comes when the requested operation has been invoked. When analyzing PL/SQL invokes, the focus should be put on the later trace message, as both the request and response information is contained within that trace message. The second trace does however not contain the names for the parameters that were used in the application code. In order for the user to know which parameter is which he needs to check for them in the first message.
The PL/SQL Details tab is dedicated for showing the command information of the server invoke. The command is shown in the first field while the parameter information are shown in the table below. Response values for the parameters are shown in the last column in the parameter table.
Note: One server invoke may contain more that one command in which case the previous and next buttons should be used for iterating through them.
Exceptions do sometimes occur, and when they do occur, they are highlighted in a red color in the trace message list. The exception information can be found in the server trace if the user unchecked both of the filtering options located in the "Server trace"-tab.

Scanning though the server trace is often time-consuming so there's also the
possibility to open the Exceptions-tab in which a filtering of the server trace
has been done. The filtering filters out the most common client and server exceptions.
Note: All exceptions are not shown in the Exceptions-tab. In those cases the
user should search for them in the server trace.
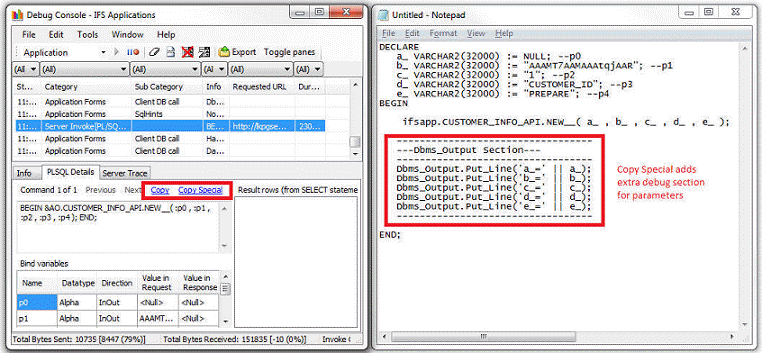
Copy / Copy special functionality adds support for copying the PL/SQL code
from a trace message (categories as "Server Invoke [PL/SQL Command]") and converting it into an executable code snippet.
All bind variables in the snippet are set so that the code snippet is ready for
execution.
The copy/copy special functionality is located under the PL/SQL Detail tab that
can be enabled from the options dialog. Pressing the Copy button will format the
current statement into an executable one, making it possible to run in e.g.
SQL/Plus or PL/SQL Developer.
Copy Special works the same as Copy but only available for PL/SQL statements as
it will also include a “Dbms_Output” section (printing out trace information),
making it possible to trace the output in whatever external tool used.
The menu "Loaded Assemblies" show information about the client assemblies that have been loaded by IFS Enterprise Explorer.
The menu "Plugin Info" show information about the plugins that have been loaded by IFS Enterprise Explorer and their time logs.
Creating a memory dump will save the current state of the application into a dump file. To create a memory dump from within the debug console, users can navigate to the debug console menu and under the Tools menu select “Create memory dump…”. The file can then be used for debugging and analysis of the current state of the application. Support personnel can use the memory dump for debugging. The memory dumps can e.g. be used by developer to see the exact version of files that are being used in the application and thereby exclude possible error sources. Developer can also use the file to rebuild the entire environment and try and run the same application locally in order to reproduce the errors.
The menu "Download All Packages" downloads all client assemblies available in the clickonce deployment location. Downloading all packages at once will eliminate time spent for downloading packages on demand each time you visit a window in IFS Enterprise Explorer.
Prerequisites:
Grant role FND_DEVELOPER to user
IFSSYS.
Note: The application server will
most likely require a restart for the changes to take place.
Setup in Developer Studio
Make sure to debug compile the package you want to debug.
Set breakpoint where you want to stop. Make sure to do this in Database Source, source is grey (This can be done via the context menu by selecting "Go To Database Source").
Select "Attach debugger..." from the the Debug menu.
Specify the connection information in the Attach-dialog and make sure the Connector-field is set to "SocketAttach".
Setup in IFS Enterprise Explorer
Open the debug console from the Tools menu.
In debug console, select "Remote Debug" under Advanced options.
Specify the host address and port you want to connect to and then save the changes and close the dialog.
Remote debugging is now configured and breakpoints should be hit when server invokes are made.
Profile Server Invokes option available under Advanced options will enable profiling data gathered by the Oracle DBMS_PROFILER. Click here for more information.
SQL Trace option available under Advanced options will enable a way to identify performance issues in PL/SQL or SQL. Click here for more information.