SQL Trace
If you have a performance problem that is related to PL/SQL or SQL the best way of finding the problem is to make a SQL Trace. SQL Trace is an Oracle tool that makes it possible to find PL/SQL or SQL that performs bad. This tool traces all PL/SQL and SQL statements until you stop tracing it. In the trace files there is all information needed to find performance problems related to PL/SQL and SQL. The trace files must be formatted in order to be human readable, this is done by using the Tkprof tool. Sometimes it is also necessary to use the TrcSess tool to consolidate several trace files into one larger trace file. Lots of information about Oracle trace exists on Internet, just google Oracle trace files or similar.
Client Id
Every client generates a client id that is unique for the client. Client id can be viewed in the Debug console in the client. Upon start of SQL trace we set Client id in the framework using the Oracle method Dbms_Session.Set_Identifier(client_id_). When SQL trace is run and Client id is set, SQL trace writes client id into every trace file produced, in this way we know which client that has produced a specific trace file.
SQL Trace
SQL trace is the tool that makes the database create user trace files for PL/SQL and SQL. SQL Trace can be started from the IFS IEE client debug console. Remember that all trace files are written to a directory on the database server. Trace files produced from the IEE debug console is post-fixed "_IFS", so a typical trace file from the IEE debug console is called sb_ora_3880_IFS.trc.
Lets say that some end user is reporting that a specific business flow is very slow. This is where SQL trace is very handy to use. You as a developer can start SQL trace and then run Tkprof on the trace files, to get the files human readable, to find out where the performance problem exists.
SQL trace produces one trace file per client call, this means that for one business process there might be many trace files created. These trace files can be consolidated into a single trace file using Trcsess tool.
Enable SQL trace
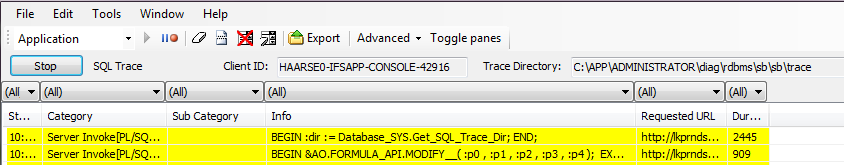
SQL Trace is enabled from the debug console in the IEE client. Choose SQL trace in advanced and press the start button. You can see the directory where the SQL trace files will be placed and also the value of your Client_Id.
Enable SQL trace for OData Requests
To enable SQL tracing, OData provider should receive the request header X-IFS-Trace-Id with a value of five alphanumeric characters (eg: 1X2y3). After sending the request header, OData Provider will alter the database session to create a new trace file. If the trace file gets created you will receive the response header X-IFS-Client-Id, this client ID will be useful to separate the respective trace file from all the ‘_IFS.trc’ files. For a given X-IFS-Trace-Id request header, the client ID will always be the same. This would make it possible to control the tagging of Oracle trace files from the client side so that the trace information can be conveniently filtered using Oracle tools.
Trcsess
IFS Cloud clients can run several server calls for one business process. Theoretically each server call can use a new Oracle session. This means that we can end up with a lot of trace files for one client running one business process. In order to be able to consolidate many SQL trace files into one bigger file you can use the Oracle tool Trcsess. The Trcsess tool can consolidate files in many ways, but the preferred one for IFS Cloud is to use Client Id for consolidation. If used in a correct way you can end up with all your trace files in one consolidated trace file. This file can then be made human readably with Oracle tool Tkprof.
trcsess [output=<output file name >] [session=<session ID>] [clientid=<clientid>]
[service=<service name>] [action=<action name>] [module=<module name>] <trace
file names>


output=<output file name> output destination default being standard output.

session=<session Id> session to be traced.

Session id is a combination of session Index & session serial number e.g. 8.13.


clientid=<clientid> clientid to be traced.
service=<service name> service to be traced.
action=<action name> action to be traced.
module=<module name> module to be traced.

<trace_file_names> Space separated list of trace files with wild card '*'
supported.
Trcsess example
This example searches for all trace files named *_IFS.trc and checks if client_id equals LKPRNDSB2013-IFSAPP--1848 and consolidates these trace files into one big ifs.trc file.
C:\trace> trcsess output=ifs.trc clientid=LKPRNDSB2013-IFSAPP--1848 *IFS.trc
Tkprof
Tkprof is an Oracle tool that makes SQL Trace files human readable. In a Tkprof output file you can see information about each PL/SQL and SQL statement, such information can be execution plan, disk reads, cpu time, waits and so on. In a Tkprof output it is possible to sort the statements in many different ways, the preferable way is often to sort on cpu or elapsed time.
Usage: tkprof tracefile outputfile [explain= ] [table= ] [print= ] [insert= ] [sys= ] [sort= ]

table=schema.tablename Use 'schema.tablename' with 'explain=' option.
explain=user/password Connect to ORACLE and issue EXPLAIN PLAN.
print=integer List only the first 'integer' SQL statements.

aggregate=yes|no<br/>insert=filename List SQL statements and data inside INSERT statements.<br/>sys=no TKPROF does not list SQL statements run as user SYS.<br/>record=filename Record non-recursive statements found in the trace file.<br/>waits=yes|no Record summary for any wait events found in the trace file.<br/>sort=option Set of zero or more of the following sort options:<br/>prscnt number of times parse was called<br/>prscpu cpu time parsing<br/>prsela elapsed time parsing<br/>prsdsk number of disk reads during parse<br/>prsqry number of buffers for consistent read during parse<br/>prscu number of buffers for current read during parse<br/>prsmis number of misses in library cache during parse<br/>execnt number of execute was called<br/>execpu cpu time spent executing<br/>exeela elapsed time executing<br/>exedsk number of disk reads during execute<br/>exeqry number of buffers for consistent read during execute<br/>execu number of buffers for current read during execute<br/>exerow number of rows processed during execute<br/>exemis number of library cache misses during execute<br/>fchcnt number of times fetch was called<br/>fchcpu cpu time spent fetching<br/>fchela elapsed time fetching<br/>fchdsk number of disk reads during fetch<br/>fchqry number of buffers for consistent read during fetch<br/>fchcu number of buffers for current read during fetch<br/>fchrow number of rows fetched<br/>userid userid of user that parsed the cursor
Tkprof example
This example takes the consolidated trace file ifs.trc and makes it into a human readable ifs.txt file using tkprof.
C:\trace>tkprof ifs.trc ifs.txt explain=ifsapp/ifsapp@lkprndsb2013/sb sys=n
Sample Tkprof output (ifs.txt):
TKPROF: Release 12.1.0.1.0 - Development on Wed Jan 14 09:57:22 2015


Copyright (c) 1982, 2014, Oracle and/or its affiliates. All rights reserved.

Trace file: ifs.trc
Sort options: default


* * * * * * * * * * * * * * * * <br/>count = number of times OCI procedure was executed<br/>cpu = cpu time in seconds executing<br/>elapsed = elapsed time in seconds executing<br/>disk = number of physical reads of buffers from disk<br/>query = number of buffers gotten for consistent read<br/>current = number of buffers gotten in current mode (usually for update)<br/>rows = number of rows processed by the fetch or execute call<br/><br/> * * * * * * * * * * * * * * * * <br/><br/><br/><br/>declare<br/>p0$_ varchar2(32767) := :v0 ;<br/>p1$_ varchar2(32767) := :v1 ;<br/>p2$_ varchar2(32767) := :v2 ;<br/>p3$_ varchar2(32767) := :v3 ;<br/>p4$_ varchar2(32767) := :v4 ;<br/><br/>begin<br/><br/>BEGIN <br/>IFSAPP.SCHEDULING_SITE_CONFIG_API.NEW__( p0$_ , p1$_ , p2$_ , p3$_ , p4$_ ); <br/><br/><br/><br/>EXCEPTION <br/>WHEN OTHERS THEN <br/><br/>rollback; <br/><br/>raise; <br/><br/>END;<br/>:v5 := p0$_;<br/>:v6 := p1$_;<br/>:v7 := p2$_;<br/>:v8 := p3$_;<br/>:v9 := p4$_;<br/><br/>end;:= p4$_;br>call     count      cpu    elapsed       disk      query    current       rows<br/>------- ------ -------- ---------- ---------- ---------- ---------- ----------<br/>Parse        1     0.00       0.00          0          0          0          0<br/>Execute      1     0.03       0.05          0          0          1          1<br/>Fetch        0     0.00       0.00          0          0          0          0<br/>------- ------ -------- ---------- ---------- ---------- ---------- ----------<br/>total        2     0.03       0.05          0          0          1          1<br/><br/><br/><br/>Misses in library cache during parse: 1<br/>Misses in library cache during execute: 1<br/>Optimizer mode: ALL_ROWS<br/>Parsing user id: 49 (IFSAPP)<br/><br/><br/>Elapsed times include waiting on following events:<br/>Event waited on                          Times   Max. Wait Total Waited<br/>---------------------------------------- Waited ---------- ------------<br/>SQL*Net message to client                     1       0.00         0.00<br/>log file sync                                 1       0.00         0.00<br/>SQL*Net message from client                   1       0.00         0.00<br/><br/> * * * * * * * * * * * * * * * * <br/>SQL ID: ahfztab4fd3qy Plan Hash: 0<br/><br/>...