| Foundation1 / Administration Guide / Core Server / Middle Tier / Middleware Server / Troubleshooting / |
This page explains some techniques that can be used to find out what is causing problems with IFS Middleware Server, for instance Connect message problems, security issues, slow running system, etc.
In general, in order to figure out where to look for problems, it is important to understand which part of the system is involved. Is IFS Middleware Server involved at all? The process where you have problems, is it a synchronous call? Is the client doing a direct call to IFS Middleware Server or is the database invoking methods in IFS Middleware Server (using the PL/SQL Access Provider)?
In addition to the tools described here, IFS Solution Manager can also be used to monitor some parts of the system, such as message queues, database sessions, background jobs, etc.
For latest IFS Middleware Server tips and tricks include tuning and troubleshooting recordings please refer to Technology home (IFS Internal)
There are quite a few techniques available that will help you figure out what is going on in the system. Sometimes the error report you get from an end user is the exception message presented by the used IFS Applications client. This exception message will in most cases give a hint as to where to continue your investigation. In other cases, when a business process executes in the background you may have to find the appropriate server log files or monitor database sessions, database background jobs, message queues, etc using IFS Solution Manager.
Basically, the following tools are available:
IFS Middleware Server logging
IFS Middleware Server contains different components and therefore produces different logs in different places in the directory structure.
| IFS specific logs e,g. alert, managedservers, batch and connect logs | <ifs_home>\instance\<instance>\logs\j2ee |
| Generic Application Server Logs - Log files with messages produced for the Managed Server. There will be one for each Managed Server on that host in the cluster. | <ifs_home>\wls_domain\<instance>\servers\<server>\logs |
| The Webserver logs - The HTTP Server log files. | <ifs_home>\wls_domain\<instance>\system_components\OHS |
| Node Manager logs with messages produced by the MWS Node Manager. | <ifs_home>\wls_domain\<instance>\nodemanager |
IFS Applications logging
Applications from IFS deployed to the Application Server use the server logging API to output log records to a number of log files.
Server logging is configured in the <ifs_home>\instance\<instance>\conf\j2ee-logging.properties file. By default, the following log files are created in <ifs_home>\instance\<instance>\logs\j2ee:
Read more about IFS Application logging
If the users are having unknown issues when trying to authenticate to any of the clients, it can help to turn on the detailed logging for the identity asserter. This function can be found in the administration console. You can find more information about it in the administration console documentation.
Log files produced by the system where a problem has occurred often needs to
be analyzed by external personnel, e.g. IFS Support Engineers. In these
situations, it is very difficult to know in advance which logs may be
interesting to examine in order to solve the problem.
The different components in IFS Middleware Server store their logs in different
directories and may be hard to find for someone who is not familiar with the
architecture.
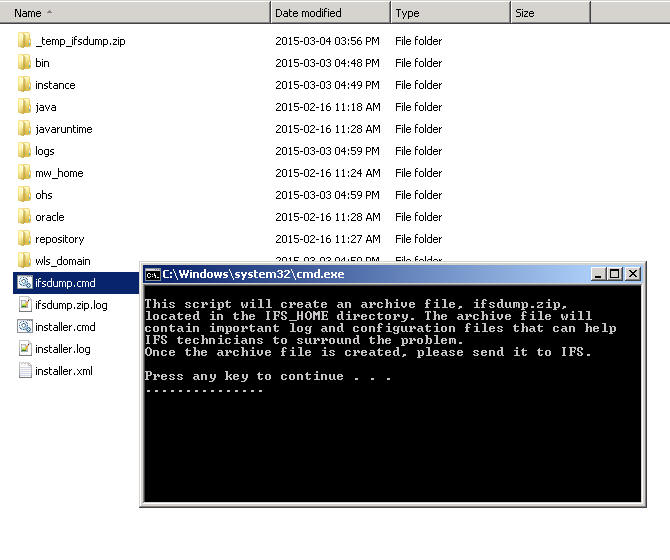
In order to gather all the relevant configuration- and log files that may be
interesting to examine off-site, there is a new utility called the IFS Dump-utiity.
This utility is a command-line tool (.cmd or .sh) residing in the IFS Home. Once
executed, it will extract all necessary information into a zip-file. It is
recommended to attach this zip-file to support cases since IFS Support Engineers
will most likely want to examine it.
In order to use the real-time monitoring techniques based on querying JMX MBeans such as IFS System Monitoring and Java Mission Control, there are some considerations:
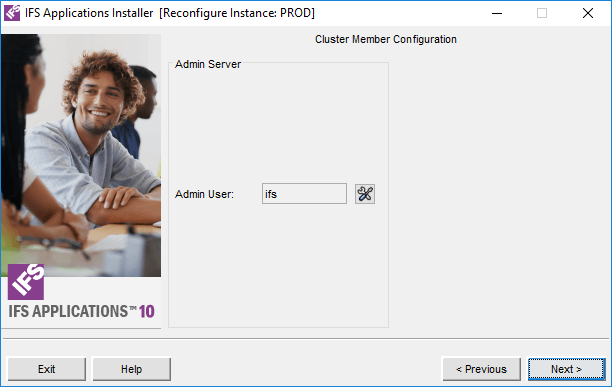
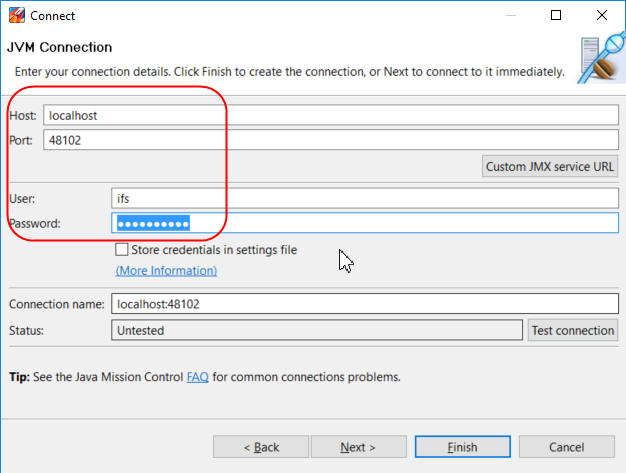
First of all, access to JMX Beans is protected by default in IFS with the same security settings as IFS Middleware Servers' Admin Server. You will need this username and password when starting any monitoring session.
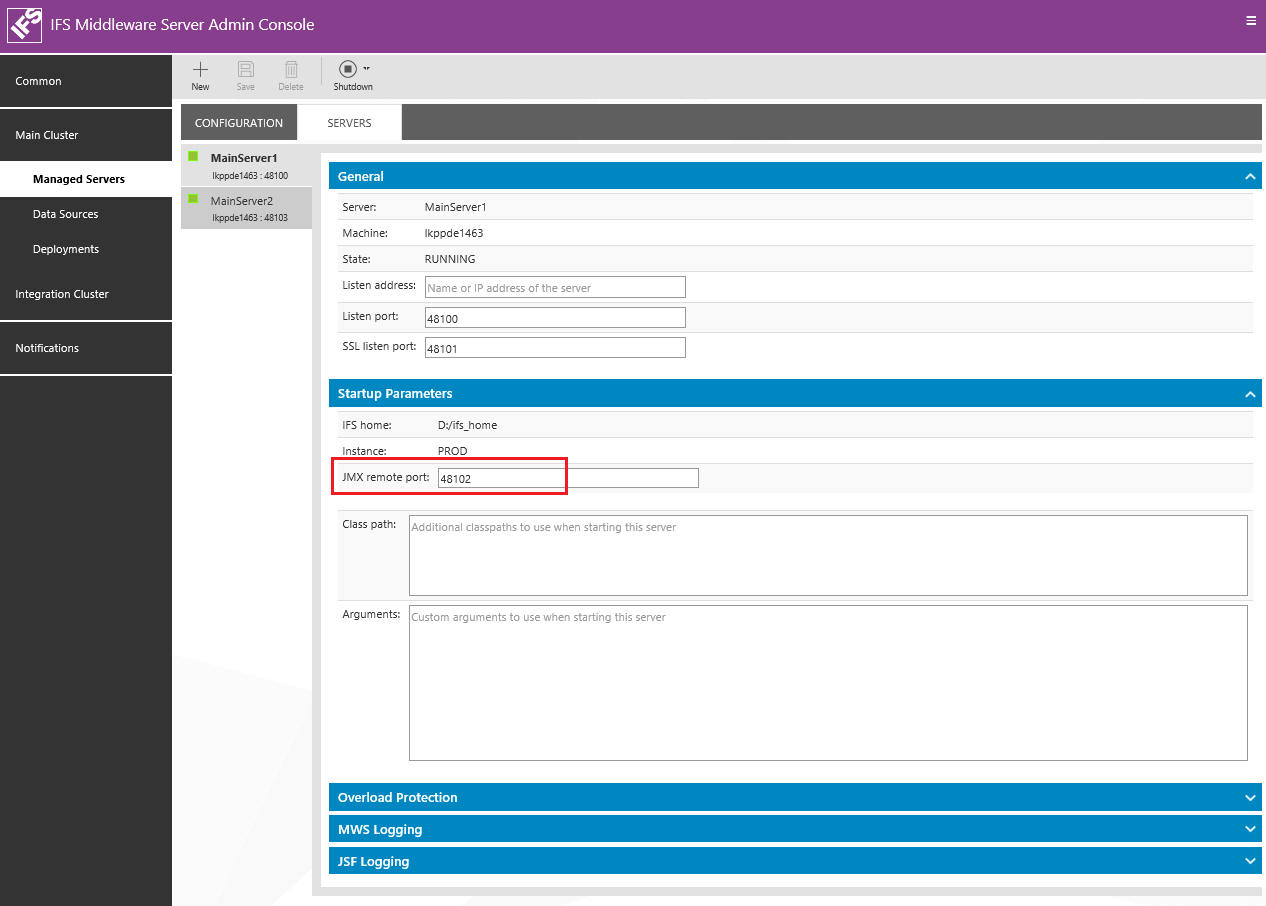
Secondly, access to JMX MBeans requires that the JVM is started with a number of arguments. Among these arguments, you need to specify a unique port that will be used by the monitoring application. This port is called the "JMX Port" in IFS Installer and you specify it's value when registering Managed Servers.
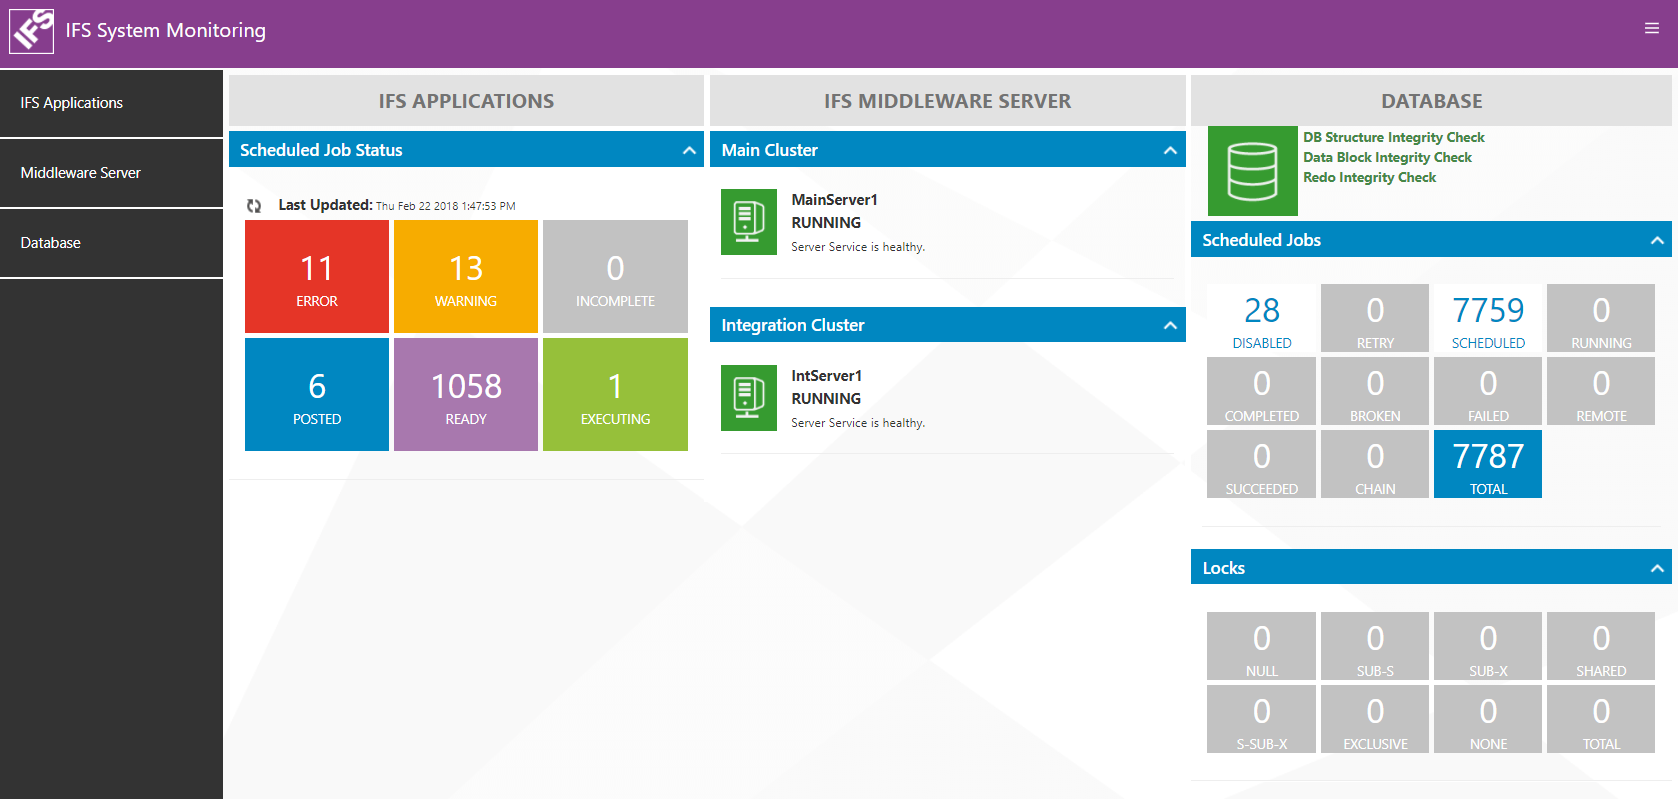
The IFS System Monitoring Console is a tool for monitoring the performance of IFS Applications. When it comes to performance, all layers in a production environment needs to be monitored. Thus the monitoring console, looks into the database, middleware server as well as critical areas within IFS business logic to find clues that indicate performance issues
The monitoring application should be used to quickly get an idea of the overall system performance and behavior. It should not be a replacement for other more advanced tools and applications.
The IFS System Monitoring tool can be accessed from the following URL for a given environment. Use the middleware server admin user credentials or ifs monitoring user to login to the monitoring tool.
http://<system_host>:<admin_listener_port>/monitoring
More details about each monitoring area can be found in the tool itself (help/documentation).
Java Mission Control and Flight Recorder are Java Virtual Machine monitoring applications included in the Sun Java distribution as of JDK 7 Update 45. The tool is to be used only by IFS employed support personell due to license restrictions and is available in the IFS_HOME (in <ifs_home>\mw_home\java\bin). With Java Mission Control you can monitor the behavior of the JVM running IFS Middleware Server.
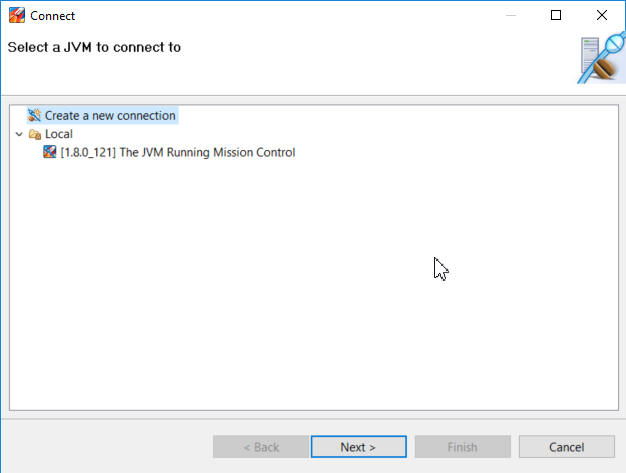
After starting the Java Mission Control, you need to create a connection to the server and enter credentials as described above.
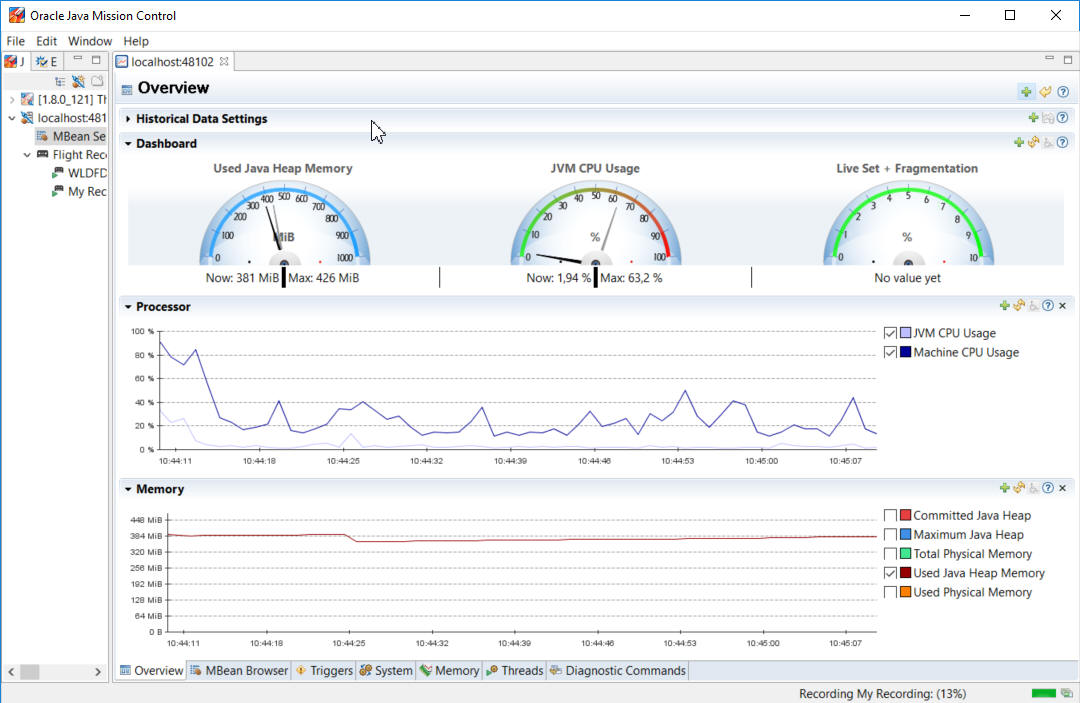
Once connected to the server, there are two tools available: The JMX Console and the Flight Recorder.
In the General section of the JMX Console, you can get an overview of memory consumption, garbage collection and CPU usage.
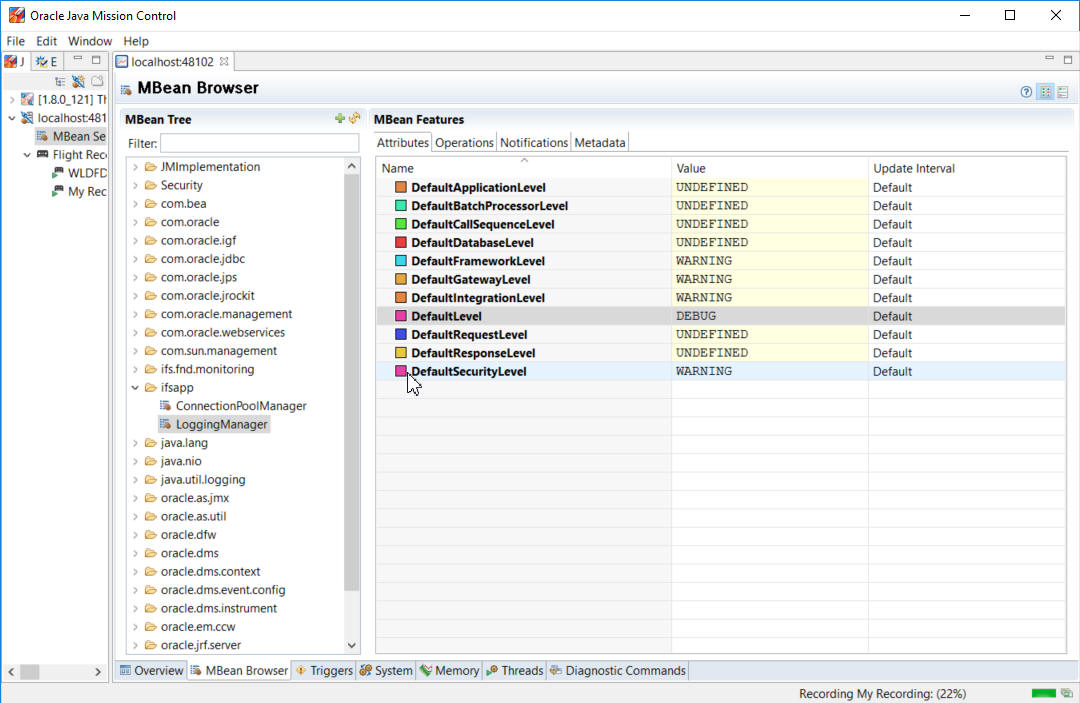
There is also a section to browse and manage MBeans. In the MBean Tree, you can find detailed information about various settings in the system. Some MBeans, like the LoggingManager allows you to change behavior on the fly.
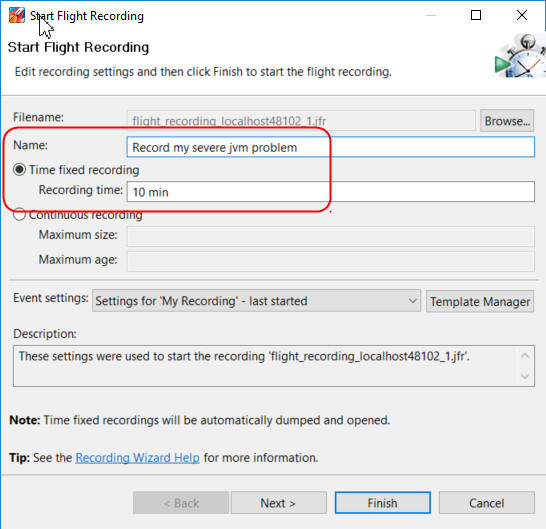
In the Flight Recorder, you can record what is going on in the JVM and analyze the behavior at a later point in time. This will of course have an impact on the performance of the system but according to Oracle, the degradation is less than 2%.
For a complete description of all the features of Java Mission Control, please consult Oracle's documentation.
Application Monitoring Metrics (AMM) is a set of defined metrics describing the status of different parts of IFS Applications. These metrics are available via a command line interface (CLI) and can be used by external monitoring tools. Many important aspects of IFS Middle Tier have Metric & Service Groups that can be very useful when troubleshooting.
Where do you start looking if you have a problem with your system? This depends on what kind of problem you have and which parts of the system is involved. The key to chasing down problems are to understand how the system works, or at least which parts of the systems participate in the process where you have problems.
Many things can cause a non-responsive system, but if you suspect something in IFS Middleware Server rather than in the database a good start is to monitor heap memory usage and CPU usage using the System Monitoring tool or JConsole. When memory consumption start to approach your maximum configured Java heap size, CPU usage often also goes up. If you notice this behavior, does it happen periodically? Is it when you do something special? Really large reports or Connect messages has been known to consume lots of memory, in some rare cases even to the point where you get an OutOfMemoryException (there's not enough memory available to complete the request).
If you do get OutOfMemoryExceptions (it will be written to the appropriate server log files) it's important to understand that the client that got an OutOfMemoryException isn't necessarily the one that used "too much" memory. It simply means that there aren't enough memory available to complete the request. Also note that the application server usually handles OutOfMemoryExceptions without needing a restart.
If you have problems processing queue messages, make sure you enable queue logging using IFS Solution Manager.
Make sure you enable queue logging using IFS Solution Manager.
Outgoing synchronous bizAPIs, report previewing, security checkpoints, etc use the PL/SQL Access Provider to communicate with the application server. Has it been configured correctly? The configuration is in the PLSQLAP_ENVIRONMENT_TAB database table (automatically configured during installation). You can also use the Monitoring Console in IFS Solution Manager.
