Debugging PL/SQL code using a Test Block
| Step 1 Fetch source |
Fetch the required code to be debugged from the database using Show Source in Database... menu option on the database node. See Using and Exploring the Database If an apy file is already open in the editor the corresponding database code can be fetched using the RMB option Go to Database Source |
* |
|
| Step 2 Place breakpoints on required lines |
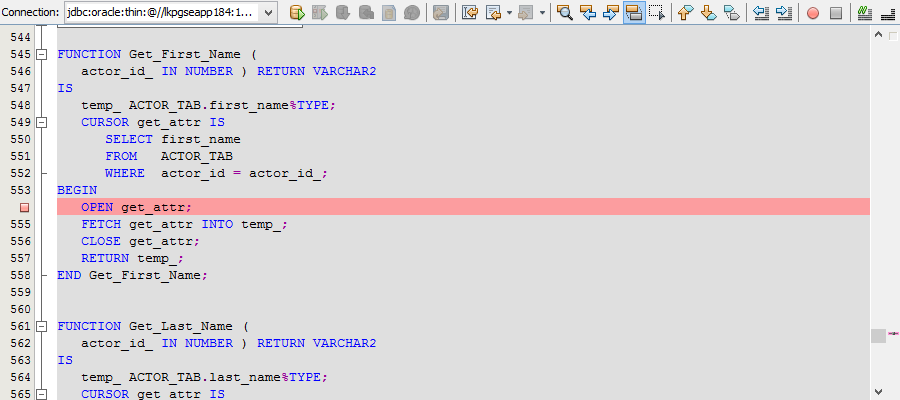
Place breakpoints on necessary source lines within a PL/SQL function or procedure by clicking on the left gutter in the editor. >  > > Figure: Create a Test Block |
* |
|
| Step 3 Create a Test Block |
Place the cursor anywhere within the body of the function or procedure and select the RMB option Create Test Block This will open a new SQL command window containing a test block which calls the PL/SQL method to be debugged. |
* |
|
| Step 4 Start Debugging |
Press the Debug button in the command window toolbar. This will execute the test block which in turn will call the PL/SQL method and hit the relevant breakpoint(s). For Oracle 12c and forward, new security restrictions exist, ACL (Access Control List) must be set up in the database. If this is not done Developer Studio will try to do this, it will prompt the user, asking if this should be done. Doing this could have security implications on customer environments. > > > Figure: Debug button icon >  > > Figure: Note: The package will be compiled with 'DEBUG' option first before executing the test block. |
* |
|
| Step 5 Breakpoint hit |
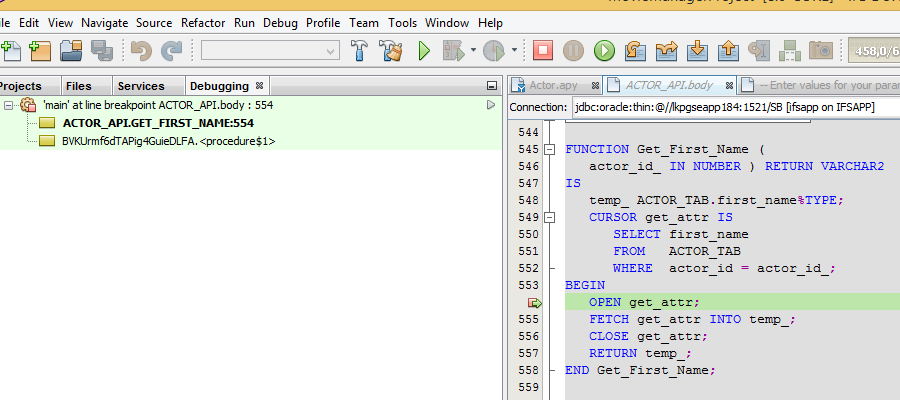
When a relevant breakpoint is hit, the relevant editor will be shown with a green line indicating the location in the flow. >  > > Figure: Breakpoint hit |