Application Monitoring Console Configuration
This sections describes how to configure the Application Monitoring Console. The configuration is about defining categories and entries for the monitoring.
The purpose of this tool is to set up monitoring on the checkpoints that are of interest for a specific installation at a specific moment. The tool is delivered with a set of predefined categories and entries to get a quick start using this tool. The predefined entries are described in the Reference Manual - Public Interfaces.
Monitor Category
This window contains the different monitor categories. A category consists of Category ID and Description. The Description is what will be displayed in the Monitoring Console.
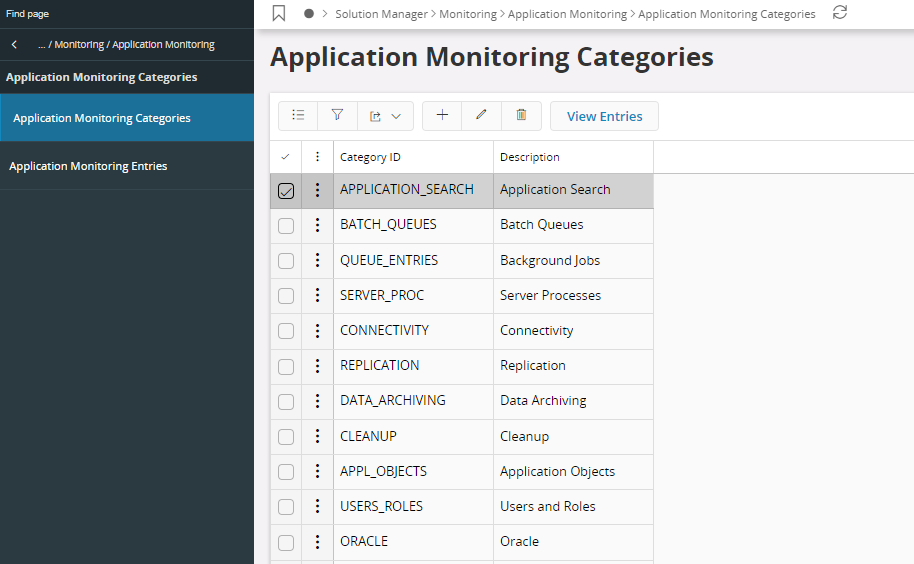
Figure 1 - Application Monitoring Categories
Monitor Entry
This window contains the different monitor entries. An entry consists of Entry ID, Description, Category ID, Order Sequence, SQL Statement, Lower Warning Limit, Upper Warning Limit, Active flag, Drill Down Statement, Help Text, System Defined flag, Default Lower Warning Limit and a Default Upper Warning Limit. Default Lower Warning Limit and a Default Upper Warning Limit are only applicable to System Defined entries.
System Defined
System Defined entries are delivered by IFS and are read only for the most part. Only Lower Warning Limit, Upper Warning Limit and the Active flag can be changed for entries of this type. System defined entries can be identified using the flag System Defined.
Note: If the Lower Warning Limit and the Upper Warning Limit of a system defined entry are same as their default values, they will be replaced with new values during next import.
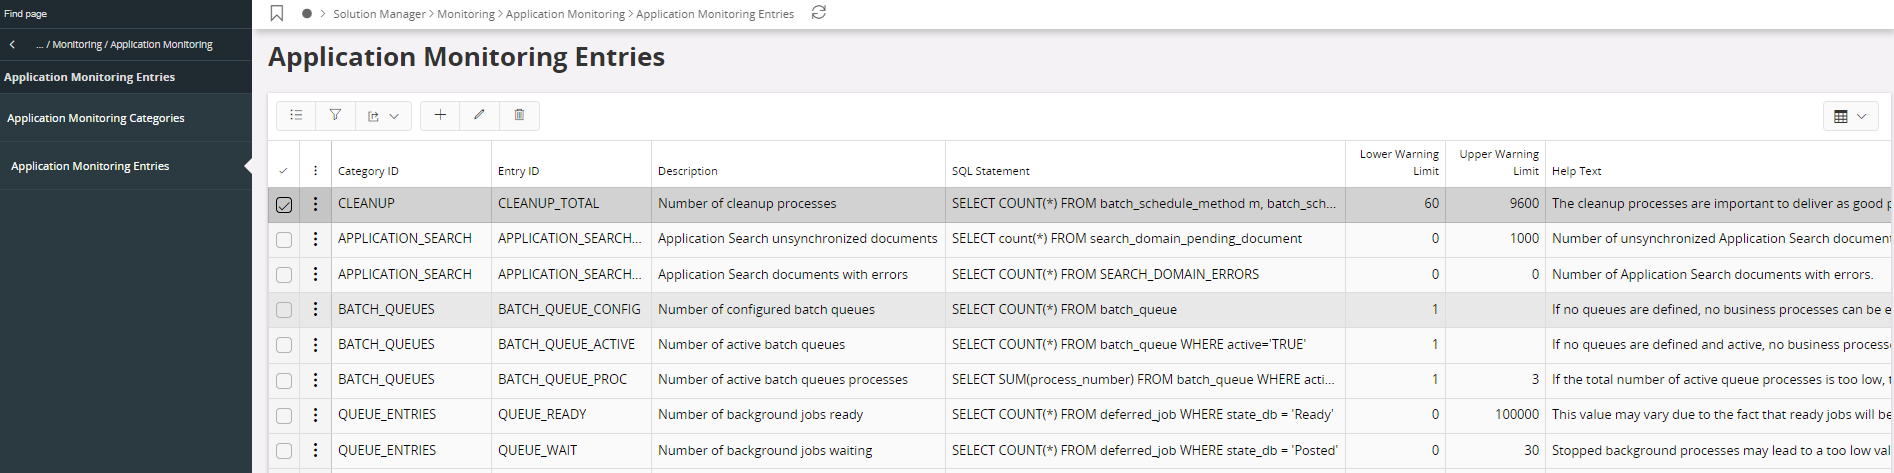
Figure 2 - Application Monitoring Entries
The most important part of an entry is the SQL Statement that will select the desired information from the database. The result of the statement should be a single value of type NUMBER or DATE. The statement will be validated when saving an entry.
The Active flag controls whether an entry will be displayed in the Monitoring Console or not.
The Order Sequence for the Monitor Entry controls the sort order internally within the Monitor Category.
The Drill Down statement is used to present details about the entry from the Monitoring Console. For instance if the number of invalid package bodies are monitored, then it could be of interest to find out more detailed information about these invalid package bodies. In most cases, when the SQL statement is a simple SELECT COUNT(*), it is not necessary to specify a drill down statement, since it will automatically be created by the Monitoring Console in runtime by simply changing “SELECT COUNT(*)” to “SELECT *”. However, if this is not possible, then a drill down statement will have to be entered that selects details about the entry. If no drill down statement is specified and the Monitoring Console cannot create it automatically, the menu option Details will not be accessible in the Monitoring Console. The Help Text can be accessed from the monitoring console in runtime and should give an extensive explanation of the purpose of the Monitor Entry and how its result should be interpreted.
Note: Note that it’s not possible to show details of the type RAW in a detail about a monitor entry. If a view consists of columns of that format, then a drill down statement excluding these columns will have to be entered.
Scheduled Monitoring
It is possible to configure monitoring to run as a scheduled task. To be able to take advantage of scheduled monitoring, the event MONITOR_ENTRY_WARNING has to be setup in the Event Registry. This is necessary to make it possible to notify the appropriate person about console entries with warnings.