Debugging
Error Reporting in IFS Aurena
Client error dialog
If you encounter a bug while running the Aurena client you will most likely will be presented with the Client-error dialog. The dialog is shown to let the user know that the client has ended up in a state from which further execution of commands cannot be guaranteed to have a stable and predicted outcome.
This dialog is shown even for minor errors that may not have any big impact on the user experience, but because of the environment in which the client is running it is hard for the framework to know for sure which components and areas in the client that have been affected by the bug.
The dialog presents you with a couple of options. You may click on the “Report” command and this expands the dialog to show more information about the error. This also provides the facility to copy the error log in to clipboard, so that when reporting the bug, this log message can be included.
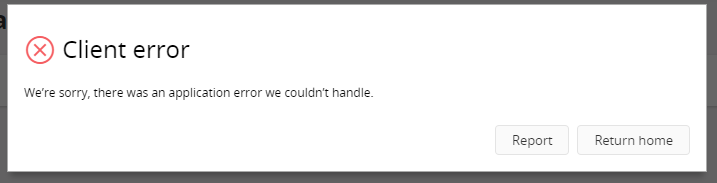
Figure 1 - Client Error dialog
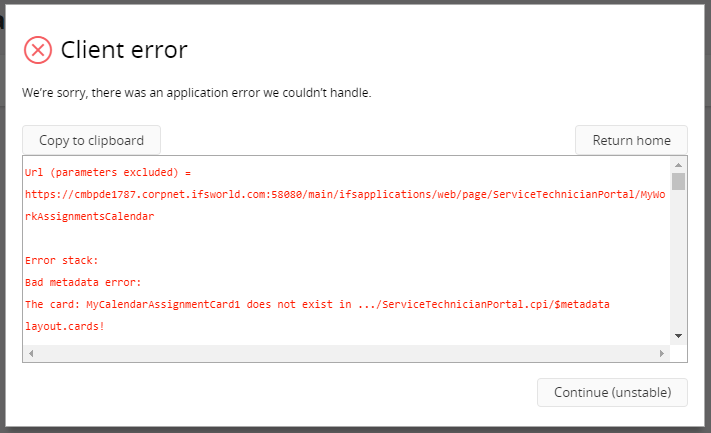
Figure 2 - Client Error dialog displaying the error report
The other option this dialog provides is to either “Return Home” if it is no longer possible to continue with the flow or “Continue (Unstable)” which allows you to continue working with the flow if the error is a minor issue.
Server errors
This type of errors will be displayed when there is an error occurring in the server side. There are two types of server errors:
- Application errors - Application errors are always shown in toast messages and never in the server dialog.
- Server errors - Server errors can be shown either as toasts or in the server error dialog.
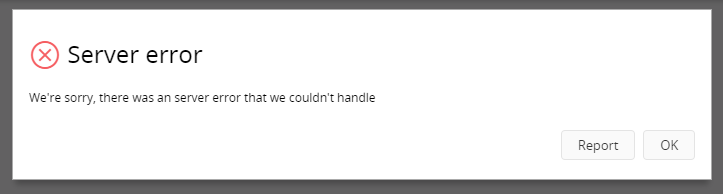
Figure 3- Server Error dialog
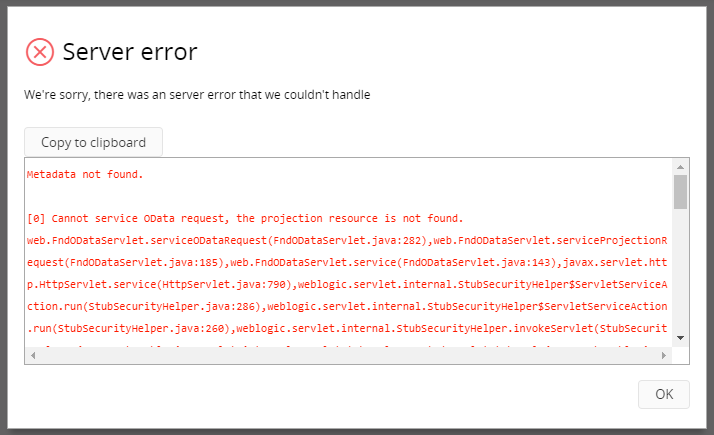
Figure 4 - Server Error dialog displaying the error report
Database Tracing Support
It is possible to view the trace data in the response by adding odata-debug=json parameter to the request URL of the entityset.
For example:
https://EnvironmentId.corpnet.ifsworld.com:58080/main/ifsapplications/projection/v1/ProjectionName.svc/EntitysetName?$skip=0&$top=25&odata-debug=json
The output from this URL includes a multitude of debug information about the https request that was made, server environment, runtime information about the server Olingo library etc.
At the bottom of the output of this URL, trace output from the database is contained in the ifs-trace json array. Each item of this array is a database trace line parsed in to a JSON structure. Included in this array is the SQL that is generated from the metadata in the entityset to retrive data to the page.
Logger in IFS Aurena
The afore-mentioned information can also be viewed using the Logger in IFS Aurena. To open this click on the name of the current logged in user and select ' Enable Logging '.
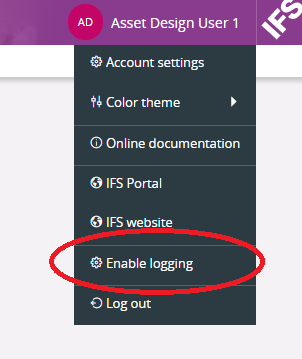
Figure 5 - Enable Logging option
This will open a pop up window in the browser and when you refresh the page, the debug information will be shown in the window. Note: Some browsers may block this popup window; therefore, popup should be enabled. All the errors logged in to this console is related to application developers and the errors can be in the projection or the client file.
To only view what is running in the application user and filter out noise, it is possible to filter using “MT” in the search box. A more detailed search can be done using "MT","type":"sql","text":"SELECT” or using the regular expression (MT)+.*(select)+
Trace support
Trace information can be added to the.plsvc file and this information will appear in logging dialog. Trace information can be added using the following method.
Log_SYS.Fnd_Trace_(Log_SYS.debug_, 'Trace Message');
There can be different log levels given to this method. Log_SYS.debug_ is one such level. The other levels are Log_SYS.error_, Log_SYS.info_, Log_SYS.trace_ and Log_SYS.warning_.
Eg: Let’s consider an action that accepts an assignment. We can add the above trace method in to the implementation of the action in.plsvc file as below.
PROCEDURE Accept_Assignment (
    taskseq_                   IN NUMBER,
    execution_instance_seq_     IN NUMBER )
IS
BEGIN
    Log_SYS.Fnd_Trace_(Log_SYS.debug_, 'This is a custom trace message');
    Jt_Execution_Instance_API.Set_Accept(task_seq_, execution_instance_seq_);
END Accept_Assignment_;
Then if we enable logging in Aurena client and execute the action ‘AcceptAssignment’, we will be able to see the information we have added.
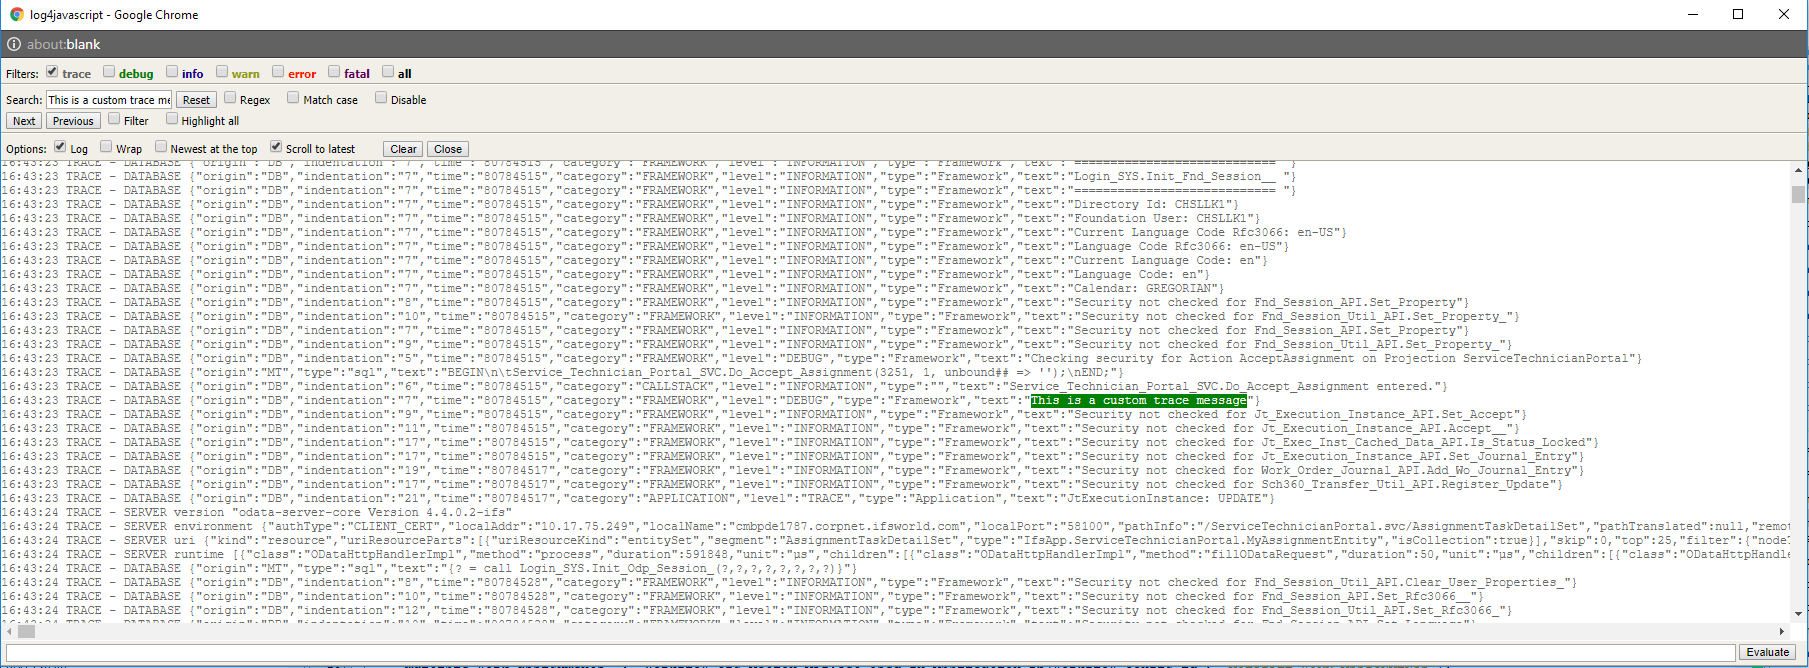
Figure 6 - Logging Trace
If a parameter is need to be added to this trace message, then it is possible to add it using string interpolation as shown below.
PROCEDURE Accept_Assignment (
    taskseq_                   IN NUMBER,
    execution_instance_seq_     IN NUMBER )
IS
BEGIN
    Log_SYS.Fnd_Trace_(Log_SYS.debug_, 'This is a custom trace message '||task_seq_||' with task seq as parameter');<br/>    Jt_Execution_Instance_API.Set_Accept(task_seq_, execution_instance_seq_);<br/>END Accept_Assignment_;<br/>
Developer Tools
Another way to get more information about the requests and the responses sent and received when loading a page in Aurena is to user the browser tools. This can be opened in Google Chrome by 'Customize and Control Google Chrome (Three vertical dotted line at the rightmost corner of the browser below the close button) --> More tools --> Developer Tools'. Or you can open this by simply pressing F12.
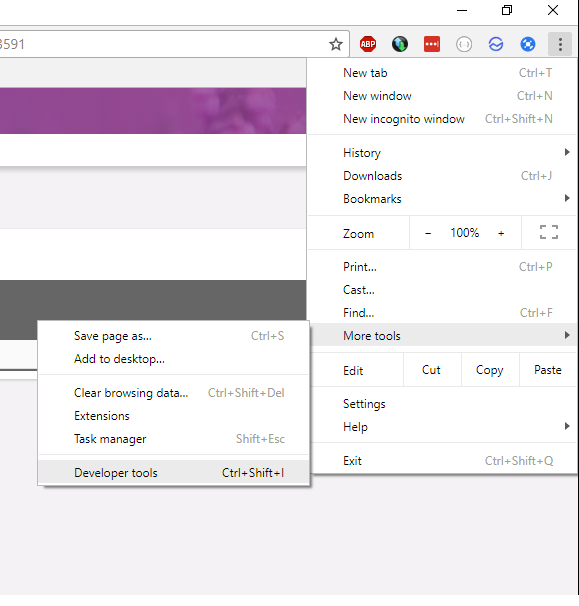
Figure 7 - Debugging through Browser (Google Chrome) Developer Tools
Network Tab
Open developer tools and then refresh the Aurena page that requires debugging. Then all the requests will appear under the network tab. By clicking on each request, it is possible to see more information about each request.
Headers tab will include information about the request sent and the Preview tab will contain ifs-trace json array. Response tab contains the metadata of the response and in case of an error, error information can be viewed using this tab. Also in the timing tab, it is possible to view information about how long it takes for the current request to communicate with the server and fetch the data to the client. This is a good indication where performance need to be tested. If the data is fetched from a view and the request takes a long time, then an issue can be that the performance of the given view is not optimized.
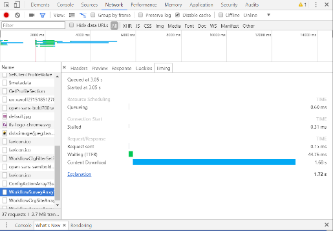
Figure 9 - Use of the Network Tab
If debugging is enabled, RMB on the request → Open in New Tab will open the same information as in database trace support. If debugging is disabled then the same step will view the data fetched from the request.
In case of an action or a function, by clicking on the request of the action, it is possible to view the parameter values that are passed in the Headers tab. The returned value for a function can be viewed using the response or the preview tab.
Console Tab
This mainly include any errors that occurs on framework side and should be reported to framework.
Device Testing Mode
By clicking on the “Toggle Device Toolbar”, it is possible to enter to device testing mode. This allows a page to be viewed in different UI sizes. It can be used to test how the page appears in different devices.
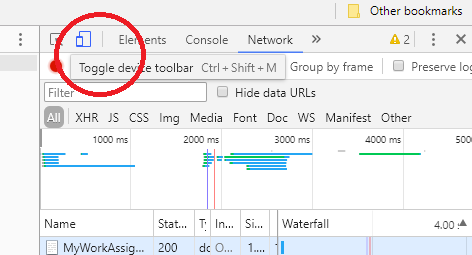
Figure 10 - Toggle Device Testing option
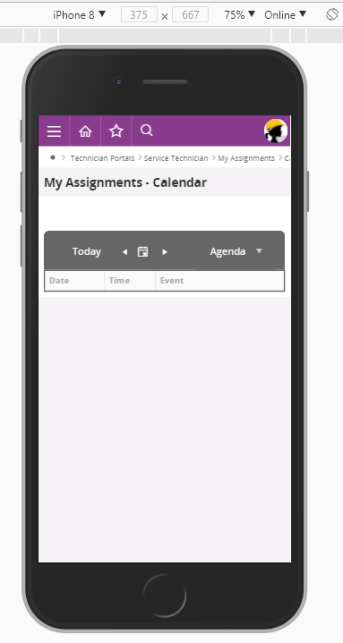
Figure 11 - Testing client on mobile device mode
Additional Tools - POSTMAN
Postman is a third part Chrome plugin that allows you to interact with the REST API. It is possible to make different kinds of HTTP requests - GET, POST, PUT, PATCH and DELETE. This is a tool that can be used to test the actions and function in a projection.
In addition to postman plugin you are required to install chrome plugin "Postman Interceptor". This will fetch the cookies for the environment page from your web browser once you log in to the environment page, and use in the postman tool to authenticate your requests.
Once postman plugin is installed to chrome browser, it is possible to create a new request as shown below or you can close this dialog and directly move to the main window.
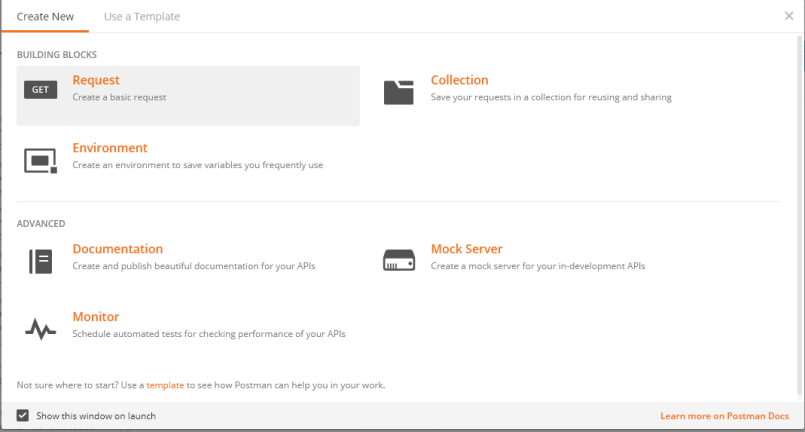
Figure 12 - POSTMAN Tool
This allows you to select the type of request you want to send and add the request URL.
Before sending a request make sure that the “postman interceptor” is turned on. If not you will get a login error and will not be able to send the request successfully. It can be turned on as shown below.
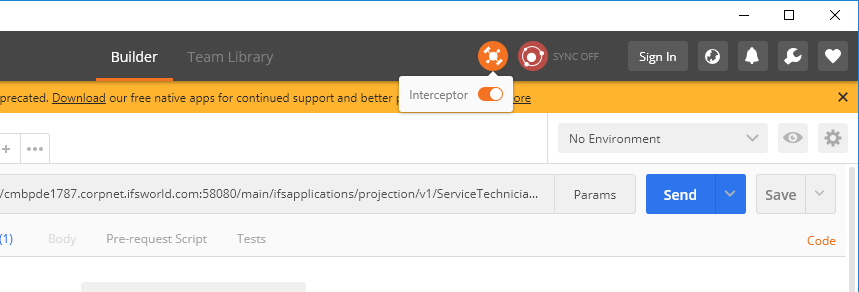
Figure 13 - Turning on Interceptor of the POSTMAN Tool
As shown in the screenshot below it is possible to select the required request type and add the URL of the request. Then the request can be sent using the sent button and the results will be shown in the "Body" tab.
Eg: To test a function call that accepts a parameter as an input and returns a structure as the output as given below, URL that should be entered can be similar to as follows. This is a GET request and the request type should be set as GET.
function GetExpenseInInfo Structure(ExpenseInInfoStruct) {
    parameter TaskSeq Number;
}
https://environment.corpnet.ifsworld.com:58080/main/ifsapplications/projection/v1/ProjectionName.svc/GetExpenseInInfo(TaskSeq=3220)
The output for this request is shown in JSON format. This can be changed using the drop down provided by POSTMAN.
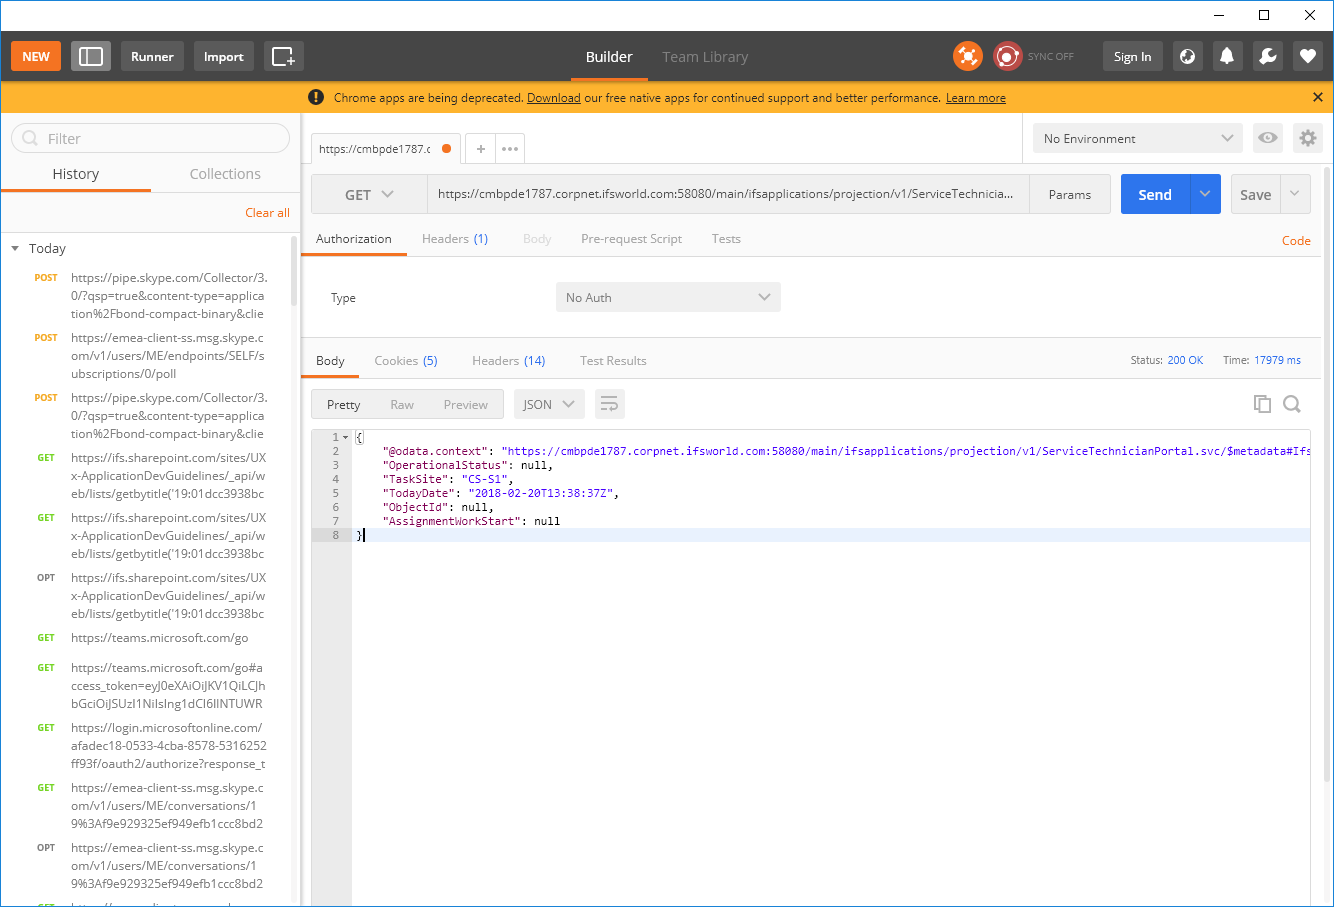
Figure 14 - Testing GET request with the POSTMAN Tool
It is possible to test other types of requests using POSTMAN as well. If we want to test a action in a projection then we can follow the similar pattern to enter the action in to the URL. But the request type should be set as POST.
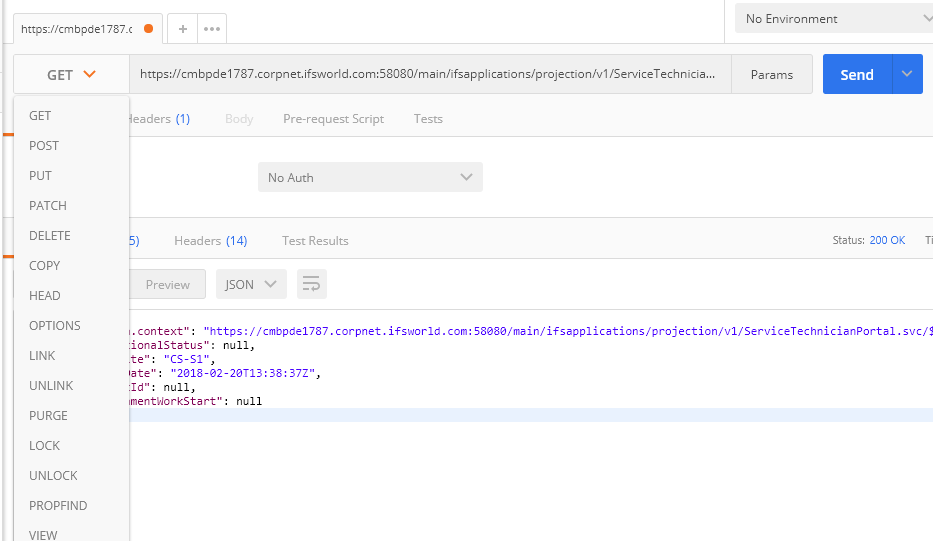
Figure 15 - Testing POST request with the POSTMAN Tool