Analytics Report Generator Elements
The analytics report generator adds features to let users quickly and without advanced knowledge of tools like Power BI create charts based on Power BI datasets. This feature can be turned off using the system parameter "Comma separated list of disabled features".
When using a layout with more than 1 visual the slicing of the data works the same as it does within Power BI, meaning that if you select a dimension member in one visual the other visuals will slice the data based on the selection.
To be able to use this feature the Power BI Service needs to be installed and configured (part of IFS Advanced Analytics).
Analytics Report Generator properties
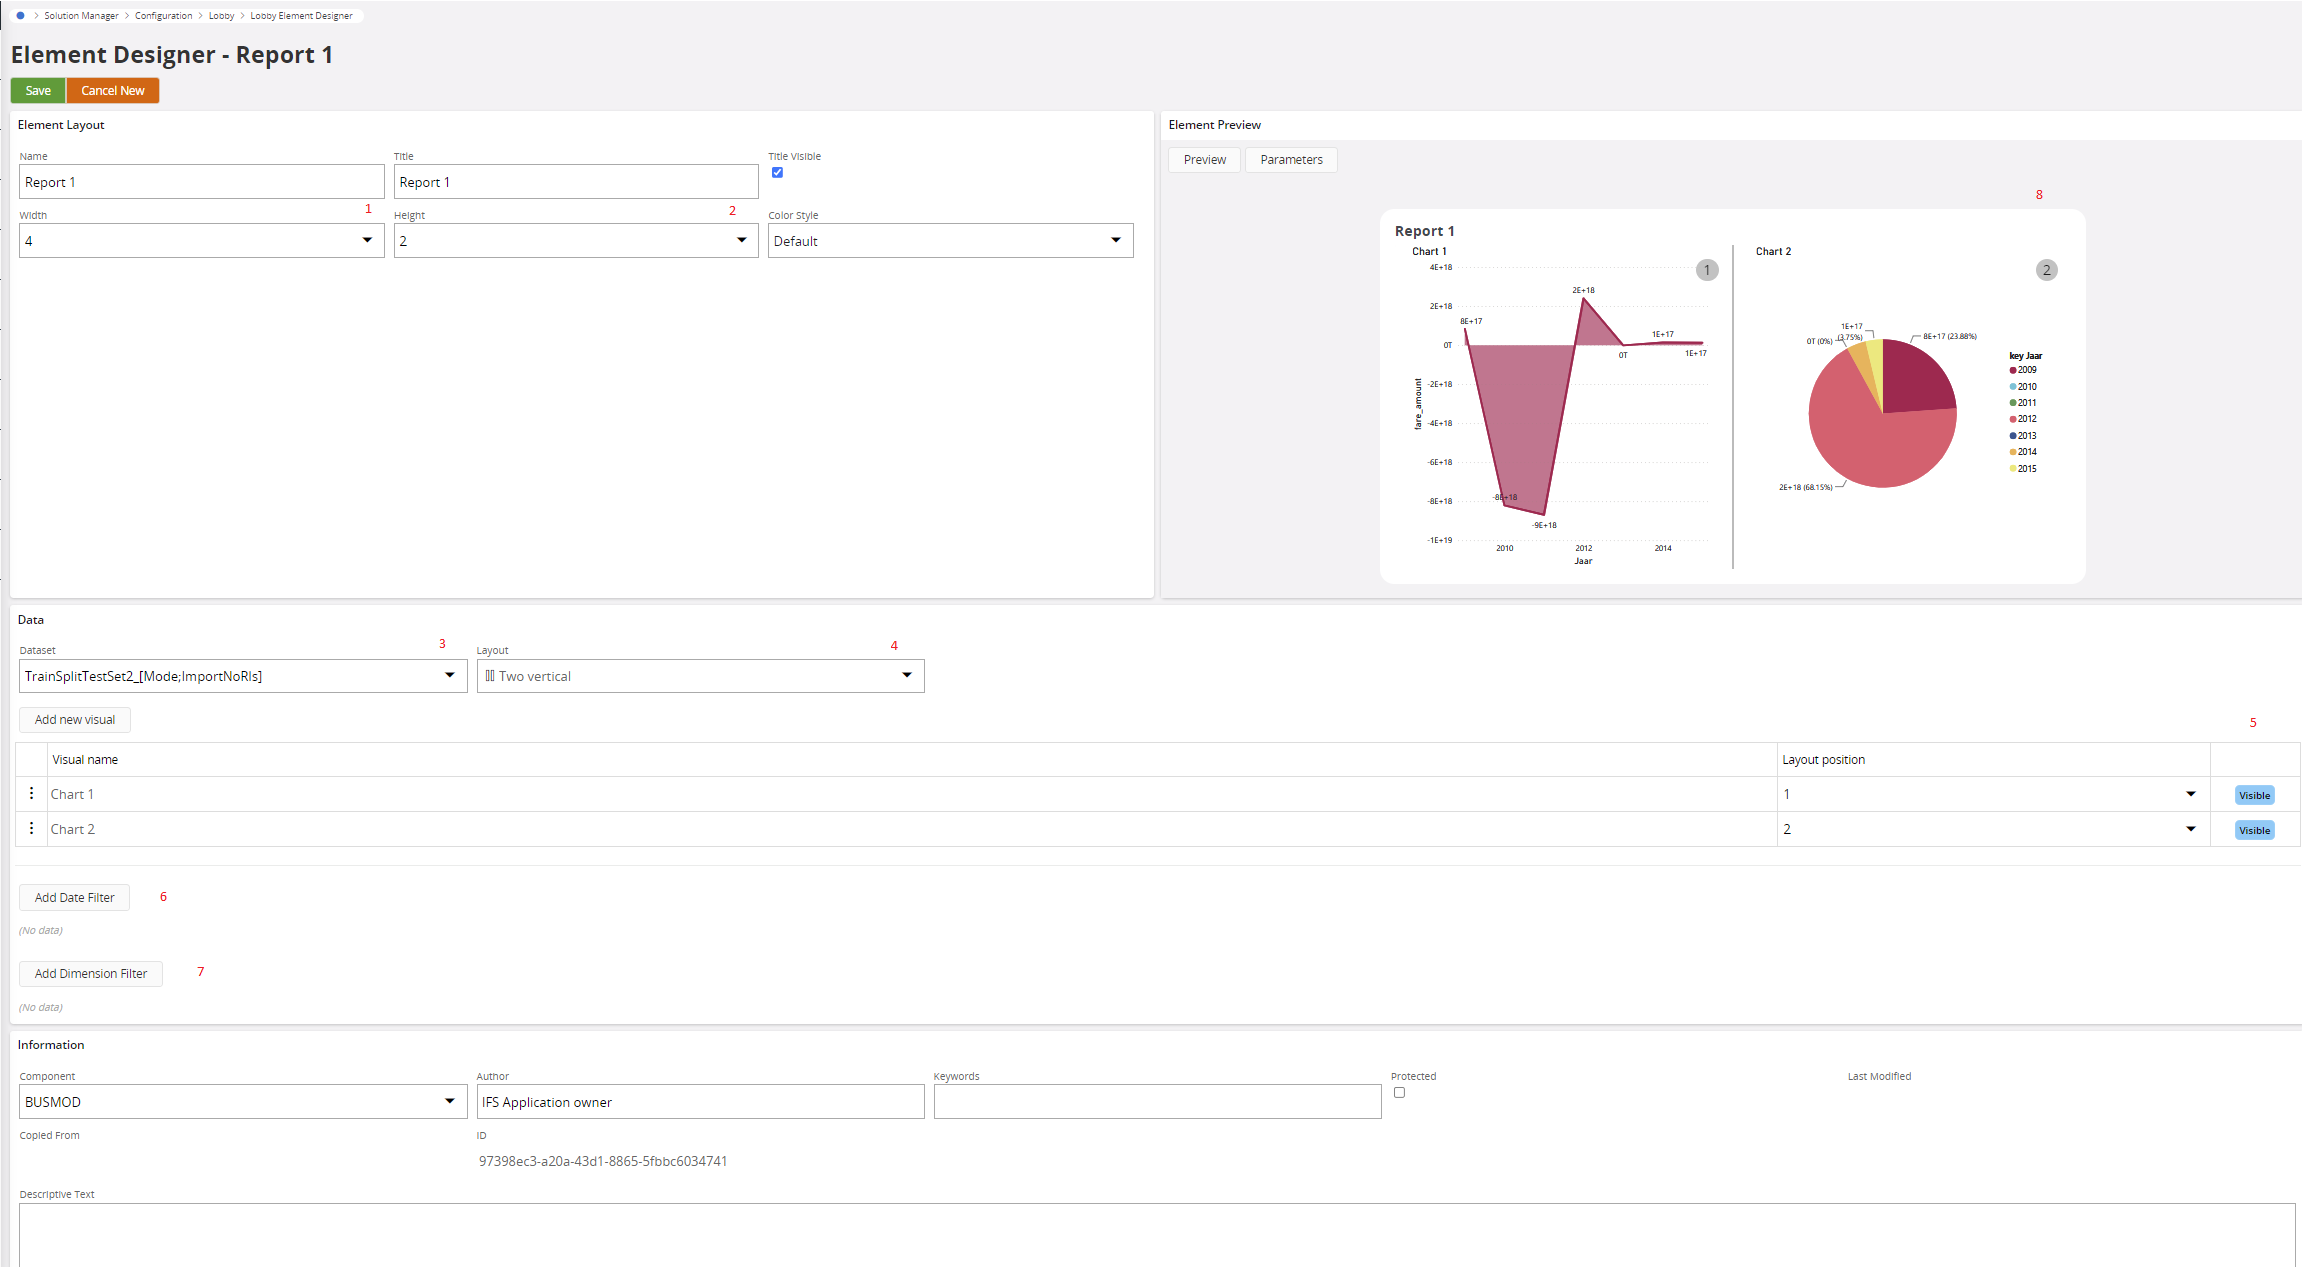
Element Layout and Information
The element layout and information properties sections work the same as for the other elements.
Data
| Name | Description |
|---|---|
| Dataset | The Power BI Dataset to use for this visual, it is only possible to use data from one dataset for a report. |
| Layout | The layout determines the number of visuals that can be placed on the report and the positioning of the visuals. |
| Add new visual | Can be used to add a new visual to the report, see Adding / editing a visual |
| VisualsTable -> Visual Name | The name of the visual, this is also used as the title of the visual when Visual Format Properties -> Title is turned on. |
| VisualsTable -> Layout position | The position this visual will be showed on, the locations are visualized in the preview section. |
| VisualsTable -> visible / hidden | It is possible to define visuals that are not shown on the report, visuals are not shown when the layout position is set to the empty string or to a position that is outside the available positions of the layout, in these cases this column will show "Hidden" instead of "Visible". |
| VisualsTable -> ... -> Edit | Edit the visual of the selected row. |
| VisualsTable -> ... -> Delete | Delete the visual of the selected row. |
| Add Date Filter | See Power BI Element Data properties -> date filter |
| Add Dimension Filter | See Power BI Element Data properties -> Dimension filters |
Adding / editing a visual
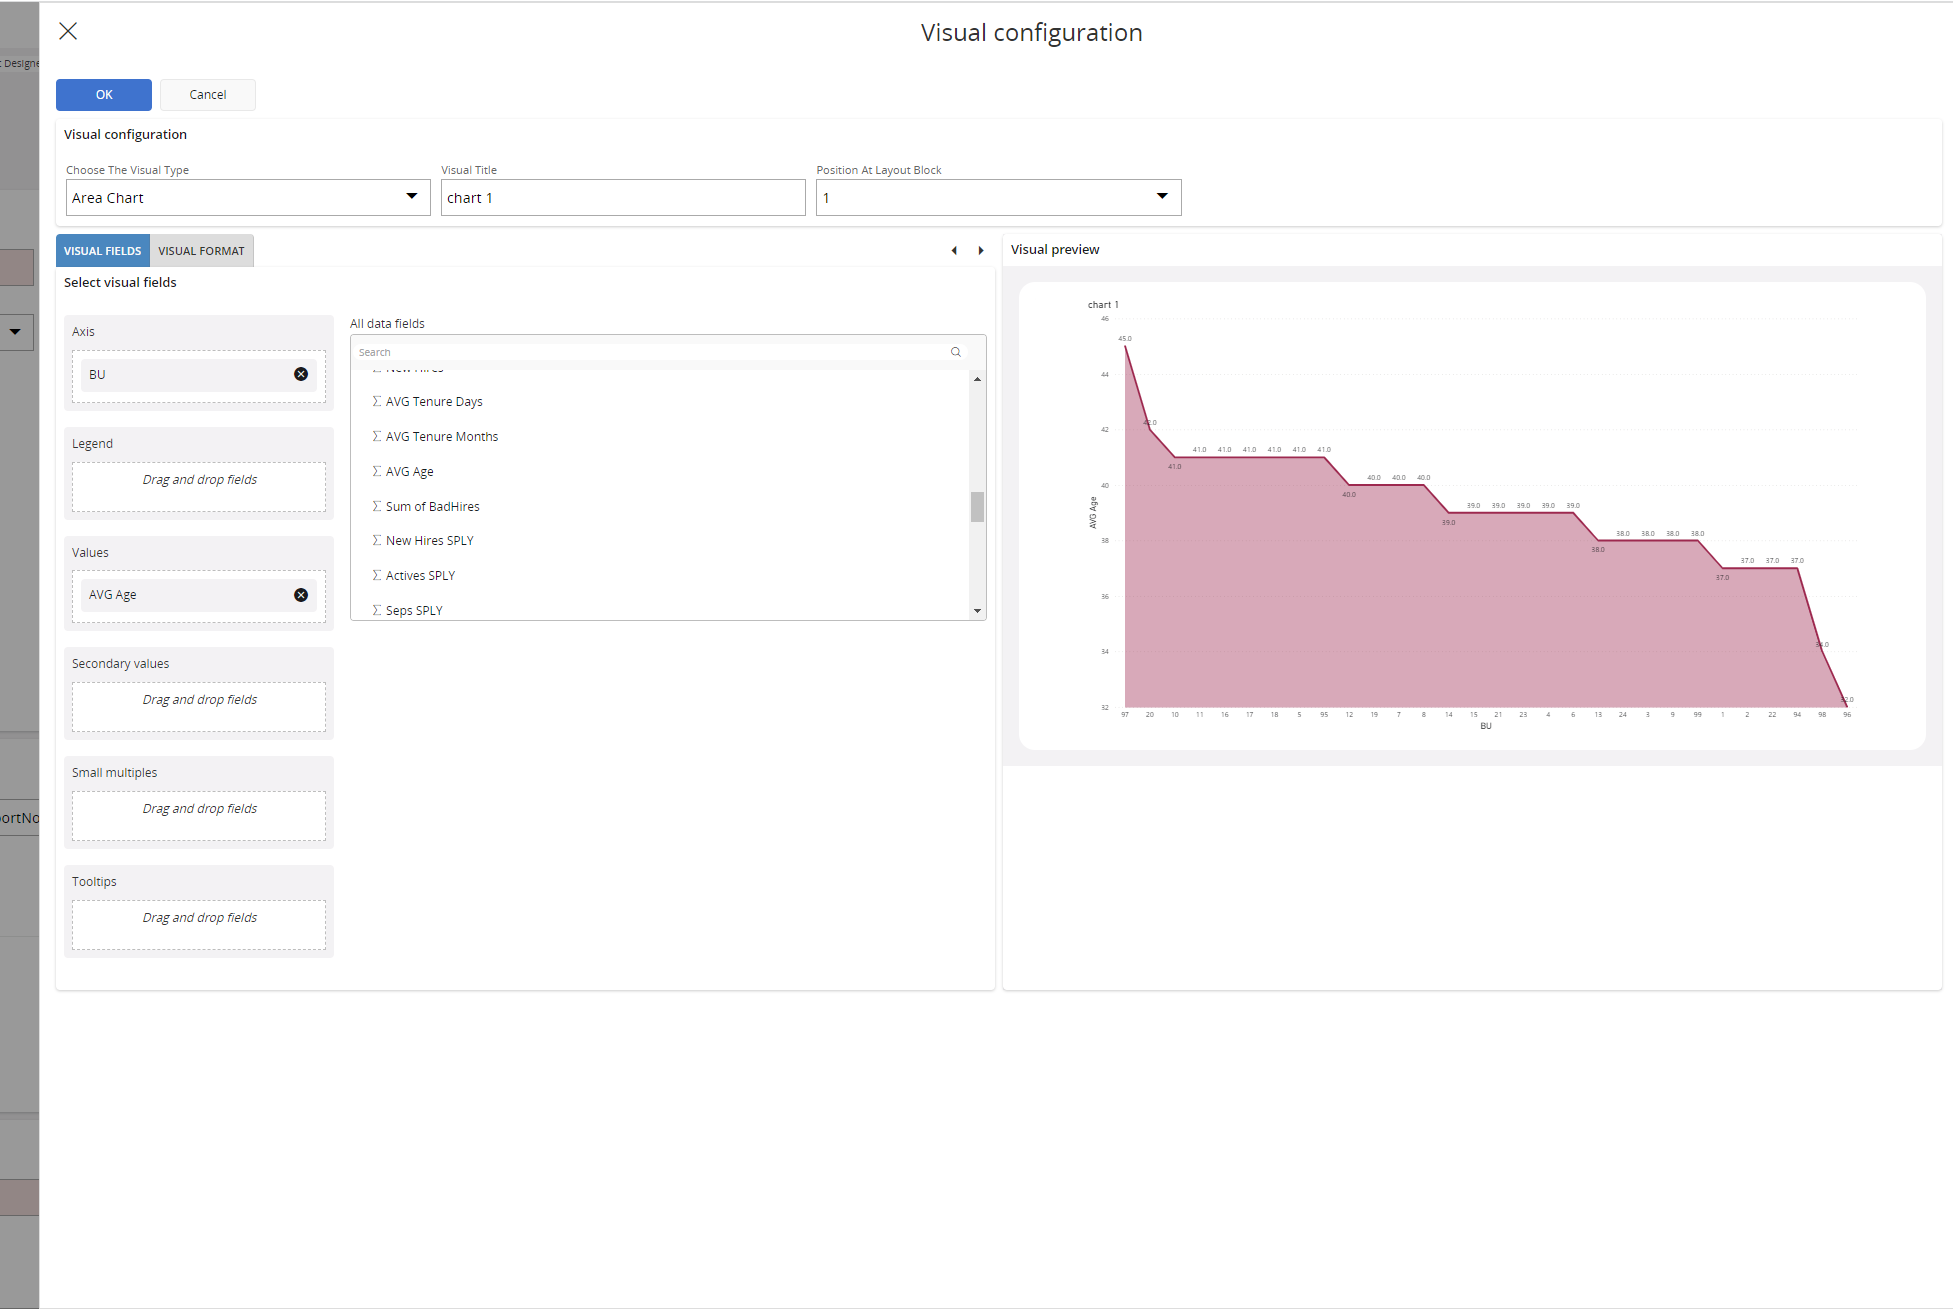
*** Visual configuration properties***
| Name | Description |
|---|---|
| Choose The Visual Type | The type of chart |
| Visual Title | The title that will be shown when visual format -> Title is turned on |
| Position At Layout Block | The position this visual will be showed on, the locations are visualized in the preview section. |
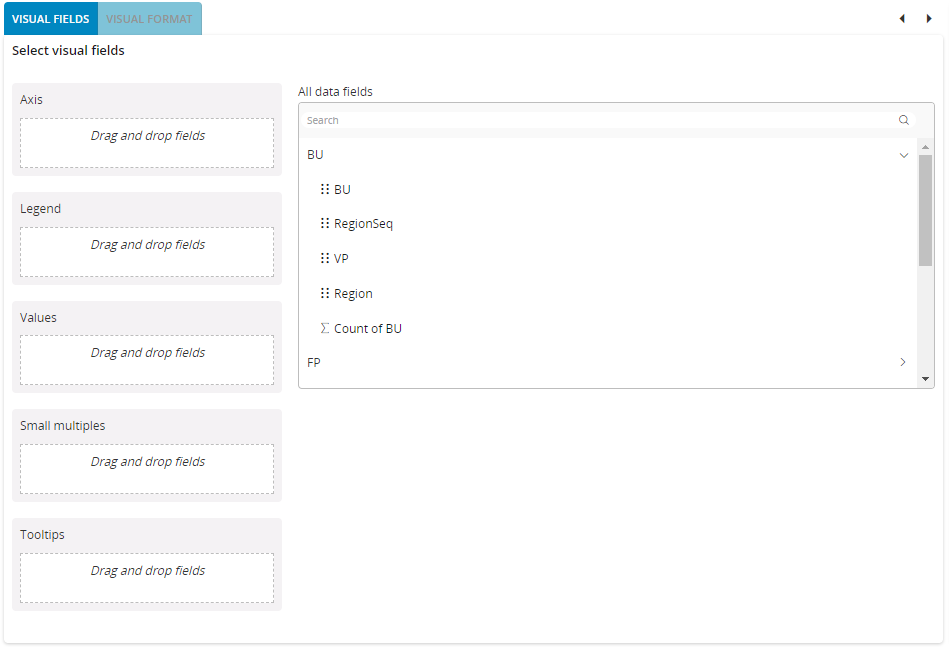
Visual Fields properties
| Name | Description |
|---|---|
| Drop zone's | For each Power BI Data Role of a visual a drop zone is created, where Power BI Data Fields can be dropped on, dropping a field from the All data fields section on the drop zone will bind the data field to the data role, meaning that the column will be used for example to show on a axis or tooltip. This list is created dynamically based on the information that is retreived from the Power BI Authoring API. |
| All data fields | Here a list of all columns and measures are shown per table available in the dataset, these fields can be bound to the data roles by dropping them on the drop zones as described above. |
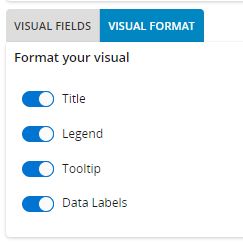
Visual Format properties
| Name | Description |
|---|---|
| Title | Bound to the Power BI property title, indicates if the title needs to be visualized in the chart. |
| Legend | Bound to the Power BI property Legend, indicates if the legend needs to be visualized in the chart. |
| Tooltip | Bound to the Power BI property Tooltip, indicates if a tooltip needs to be shown when a user hovers over a chart (data point). |
| Data Labels | Bound to the Power BI property Data Labels, indicates if the data labels needs to be shown in the chart. |
Empty template reports
The Analytics Report Generator uses the Microsoft Power BI Embedded Authoring API to create visuals on the fly. There are some limitations in the authoring API that make it impossible to use the authoring API on a newly created report, and hence it is not possible to create an empty report on the fly and use it to add the visual to. As a workaround a report with the following name needs to be created: {dataset name}_empty, where dataset name is the name of the dataset for which you want to enable the Analytics Report Generator.
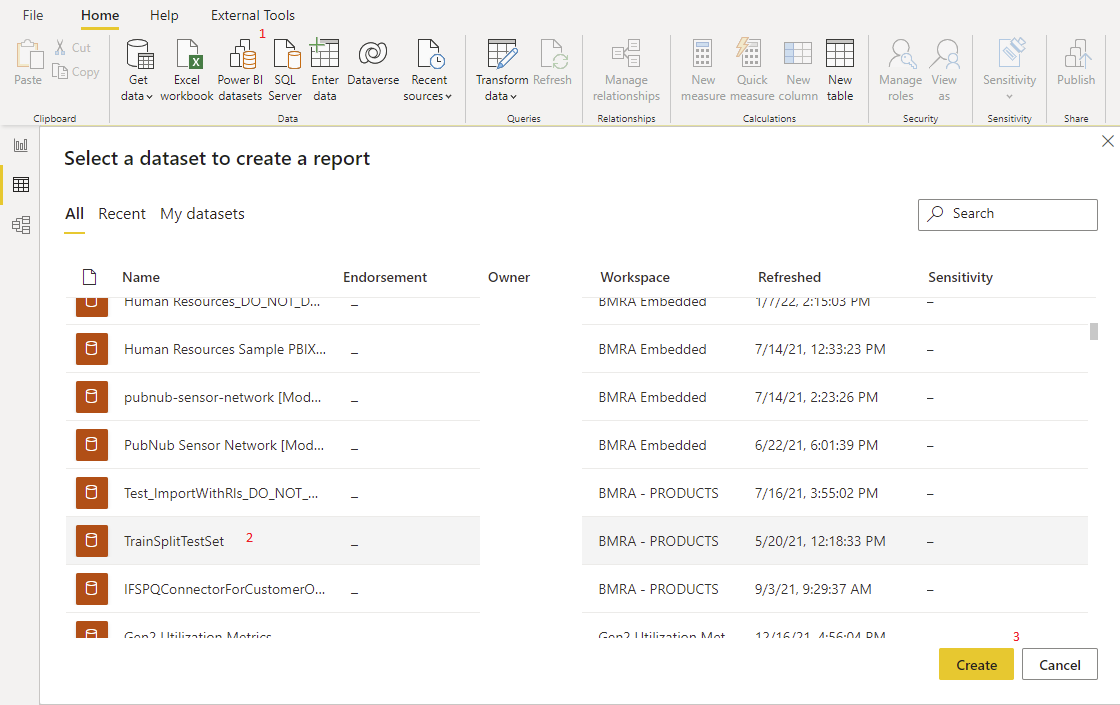
When there is an empty report available for the dataset the dataset will show up in the Data -> Dataset dropdown (nr 3 in the image above).
There are two ways to create an empty report for a dataset, one easy way that requires Power BI Desktop and one more complex way that can be done in https://app.powerbi.com.
Creating an empty report using Power BI Client
A quicker way to create the empty report is using the below template.
-
Download the template: Download Template
-
Open the template in Power BI Client
-
Click Power BI Dataset in the ribbon
-
Select the dataset to create the report for
-
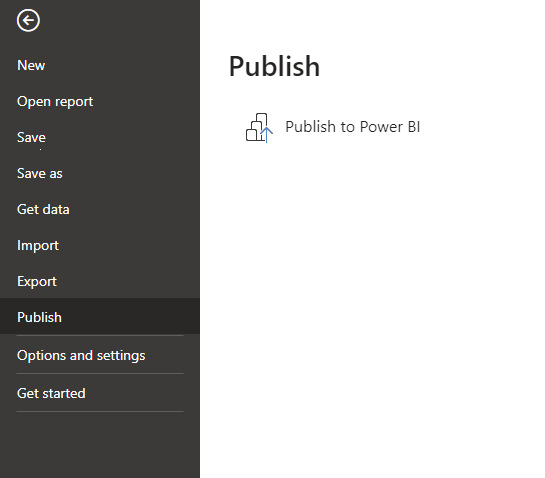
Click File -> Publish
-
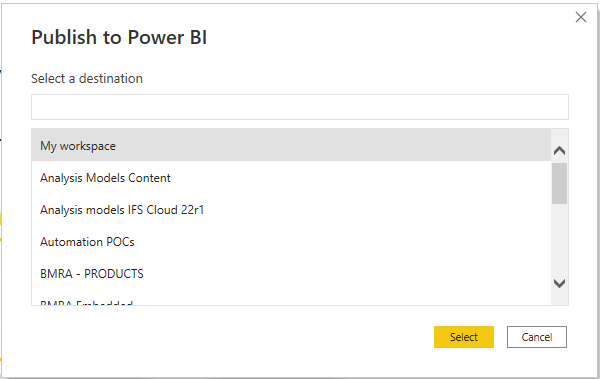
Specify the name in the form {dataset name}_empty
-
Select a destination workspace
-
Done, now you should be able to select the dataset in the dataset dropdown.
Create an empty report using Power BI Online
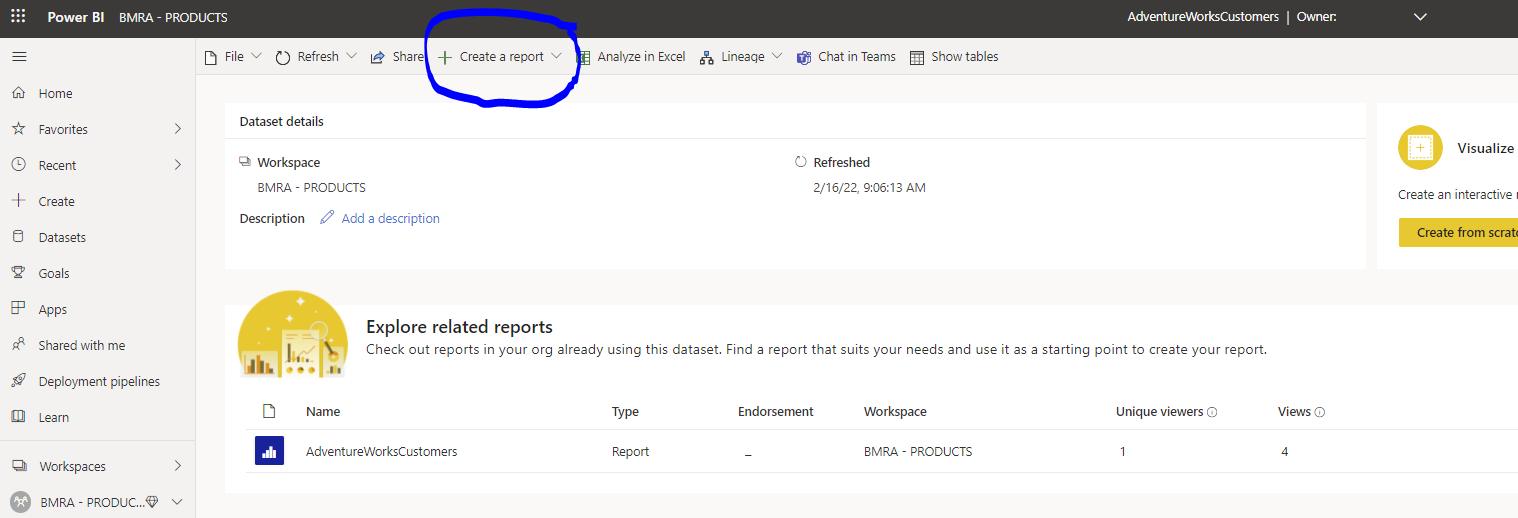
The report needs to be created in http://app.powerbi.com, there go to the dataset you want to create a empty report for and click create report:
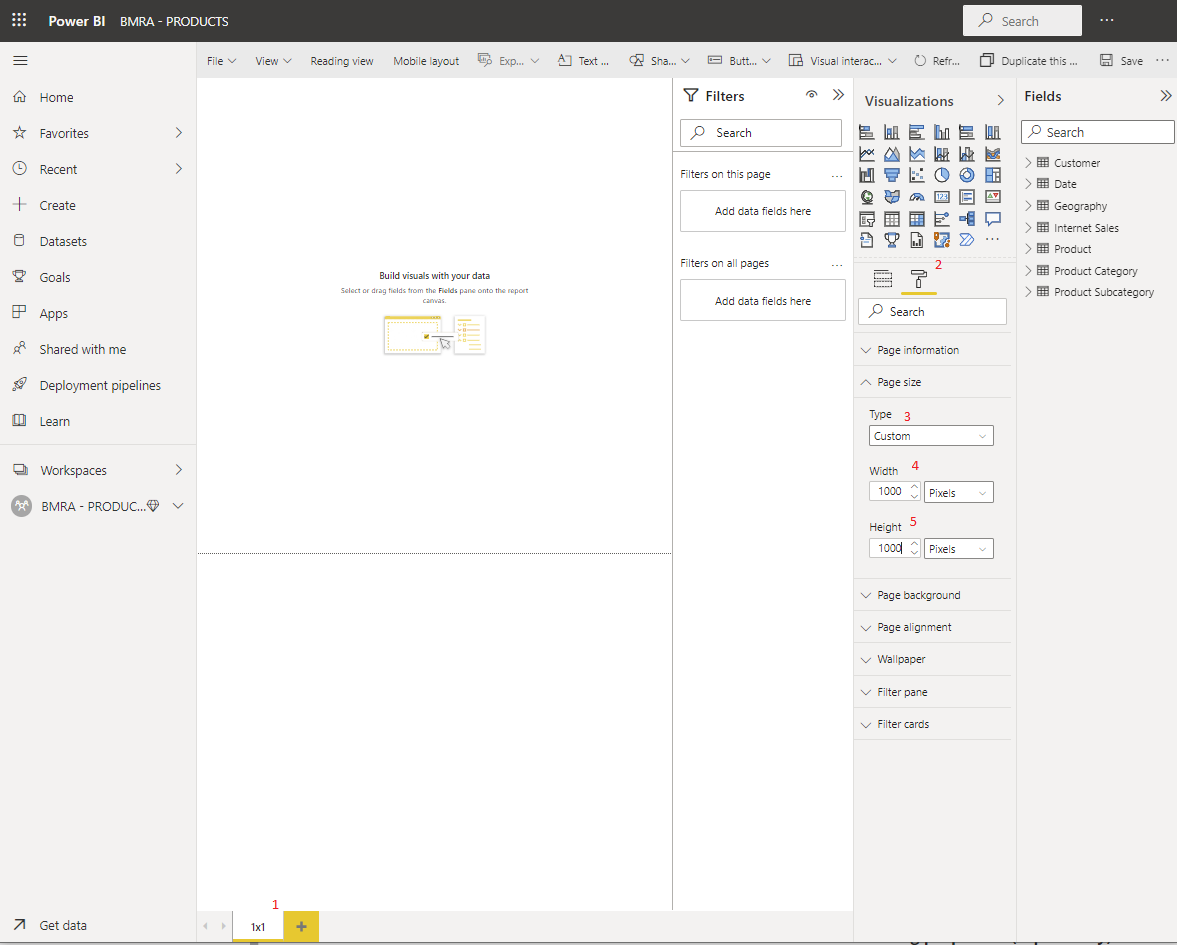
After clicking the create a report button a new report will show up, by double clicking the page name in (1 of the screenshot below) the name of the page can be renamed, then the format button (2) needs to be clicked, expand the page size drop down, select type custom (3) and fill in the width and height (4 and 5). After the first page the other pages can be added in a similar way by clicking the + button next to the initial page (1). See the table below for the settings of the pages that need to be created.
After creating all the pages click File -> Save As, fill in the name {dataset name}_empty and click save.
Empty template report pages:
To let the generated report scale properly for the selected element size, the empty report should include the following pages with the width and height as specified in the below table:
| Page Name | Page Width | Page Height |
|---|---|---|
| 1x1 | 1000 px | 1000 px |
| 2x1 | 1000 px | 500 px |
| 4x1 | 1000 px | 250 px |
| 1x2 | 500 px | 1000 px |
| 1x4 | 250 px | 1000 px |
| designer | 1000 px | 550 px |