Log monitoring - EFK Stack
EFK - Elasticsearch, Fluentd, and Kibana
-
Elasticsearch is a distributed and scalable search engine, used commonly to sift through large volumes of log data. Its' primary purpose is to store and retrieve logs from fluentd.
-
Fluentd is a log shipper. It is an open-source log collection agent which supports multiple data sources and output formats. It can also forward logs to elasticsearch. Fluentd is a unifying layer between systems that generate and store log data.
-
Kibana is a UI tool for querying, data visualization and dashboards. It is a query engine which allows exploring log data through a web interface, building visualizations for events logs, and is query-specific to filter information for detecting issues. Virtually any type of dashboard can be built using Kibana. Kibana Query Language (KQL) is used for querying elasticsearch data. Here Kibana is used to query index data in elasticsearch.
NOTE: The data retention period of Elasticsearch is 7 days. (This means logs can be accessed only for the past 7 days, including the current day. A curator-cronjob will be run daily to check and delete logs which are older than 7 days).
How to Access Kibana Dashboard
1. Browse the Kibana Dashboard of IFS Remote Solution [Log in to Kibana]
- e.g. Browse to https://Linuxhost/kibana
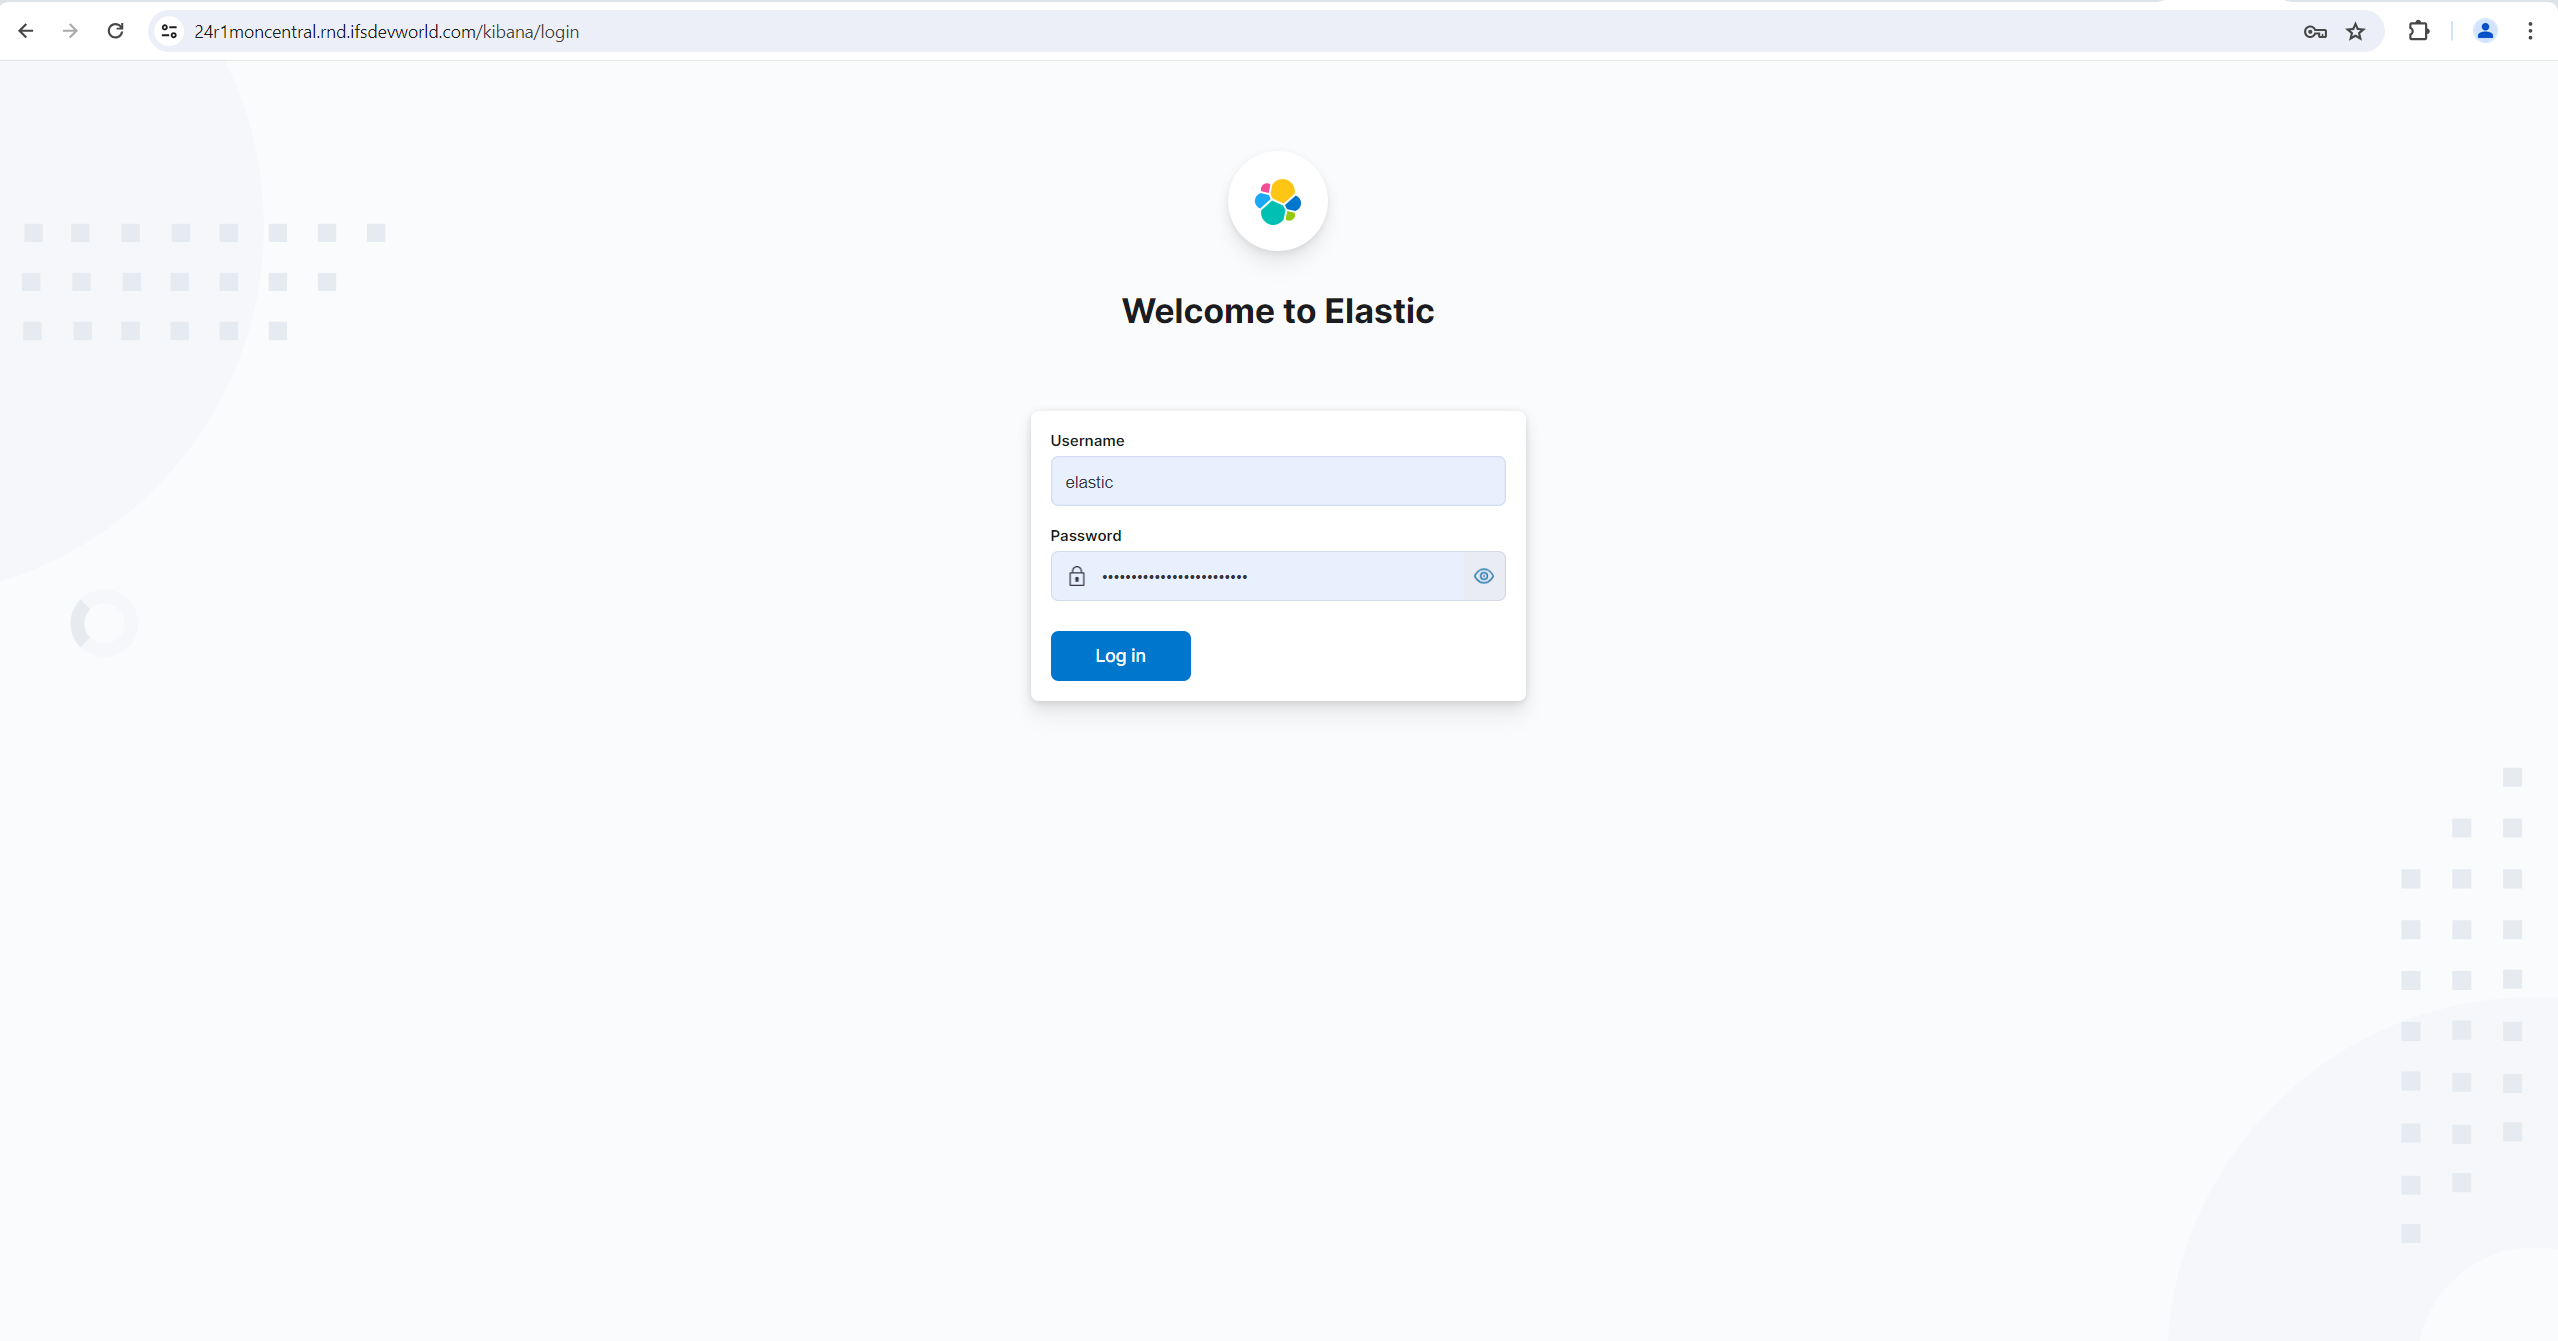
2. Authentication
-
The user must enter the username and password to log in to dashboards.
-
The user can extract the username and password from the IFS-Remote file location in their windows machine:
ifsroot > config > secrets > kibana_credsfile. -
The initial screen displayed upon user login.
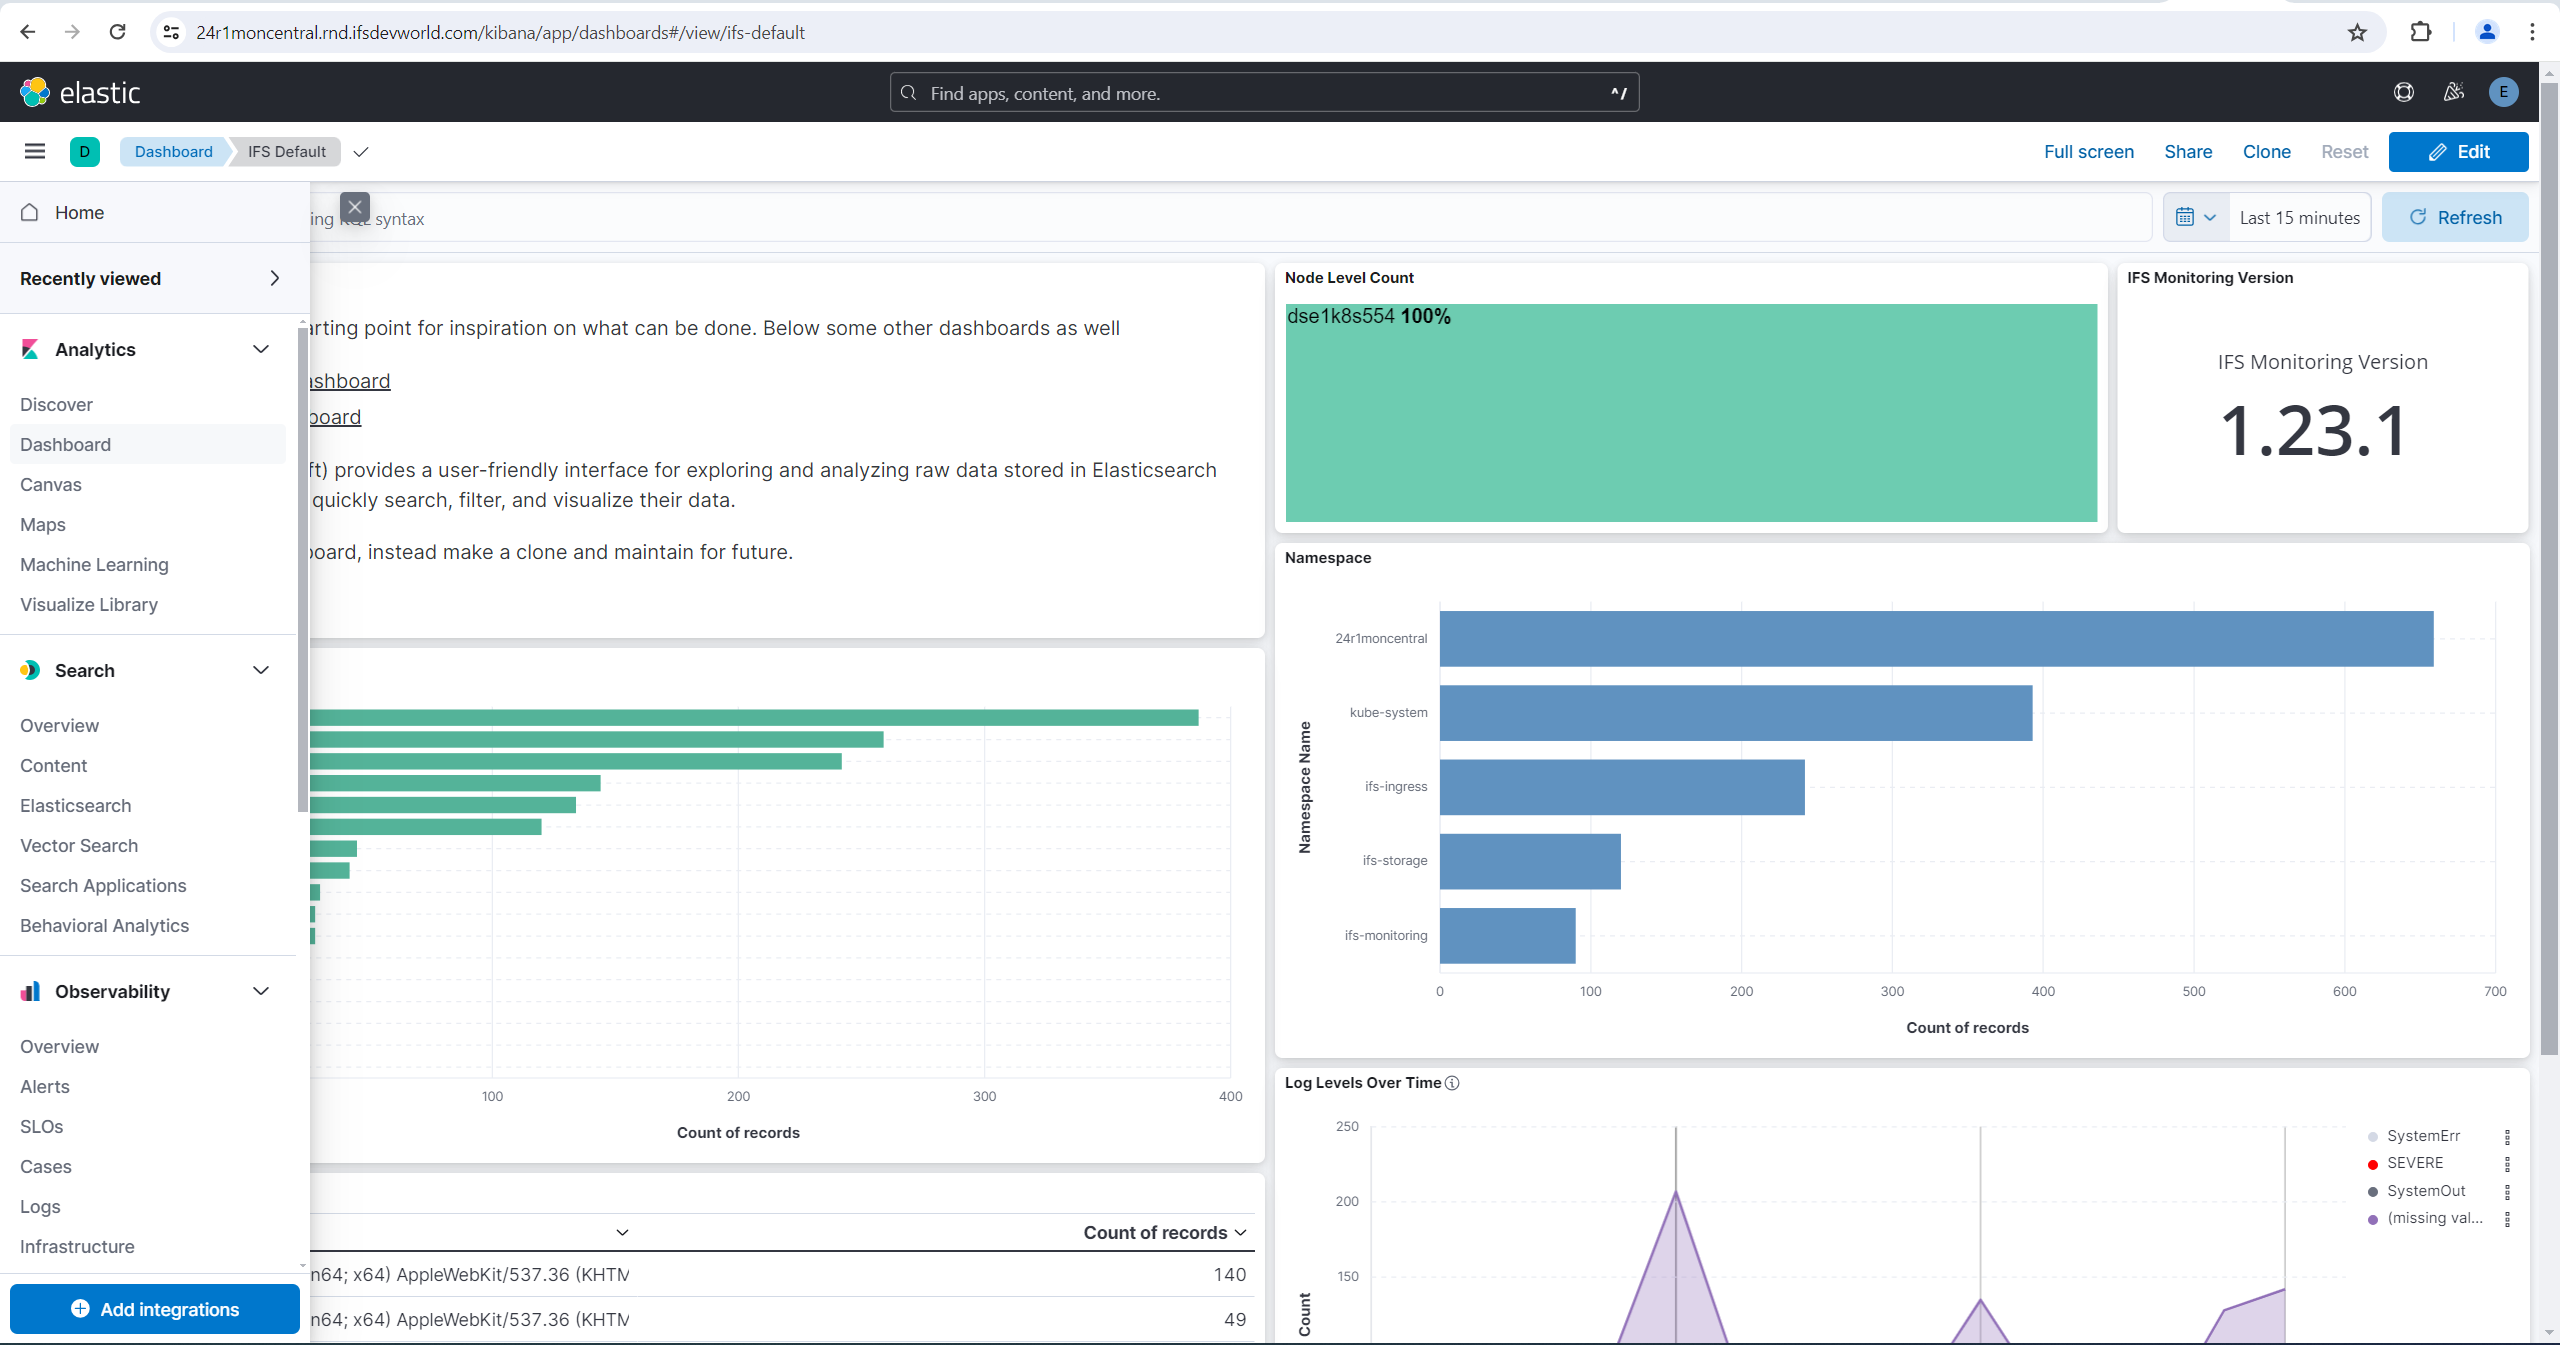
How to Discover Kibana Logs
-
Navigate to Discover from the main menu.
-
View Records.
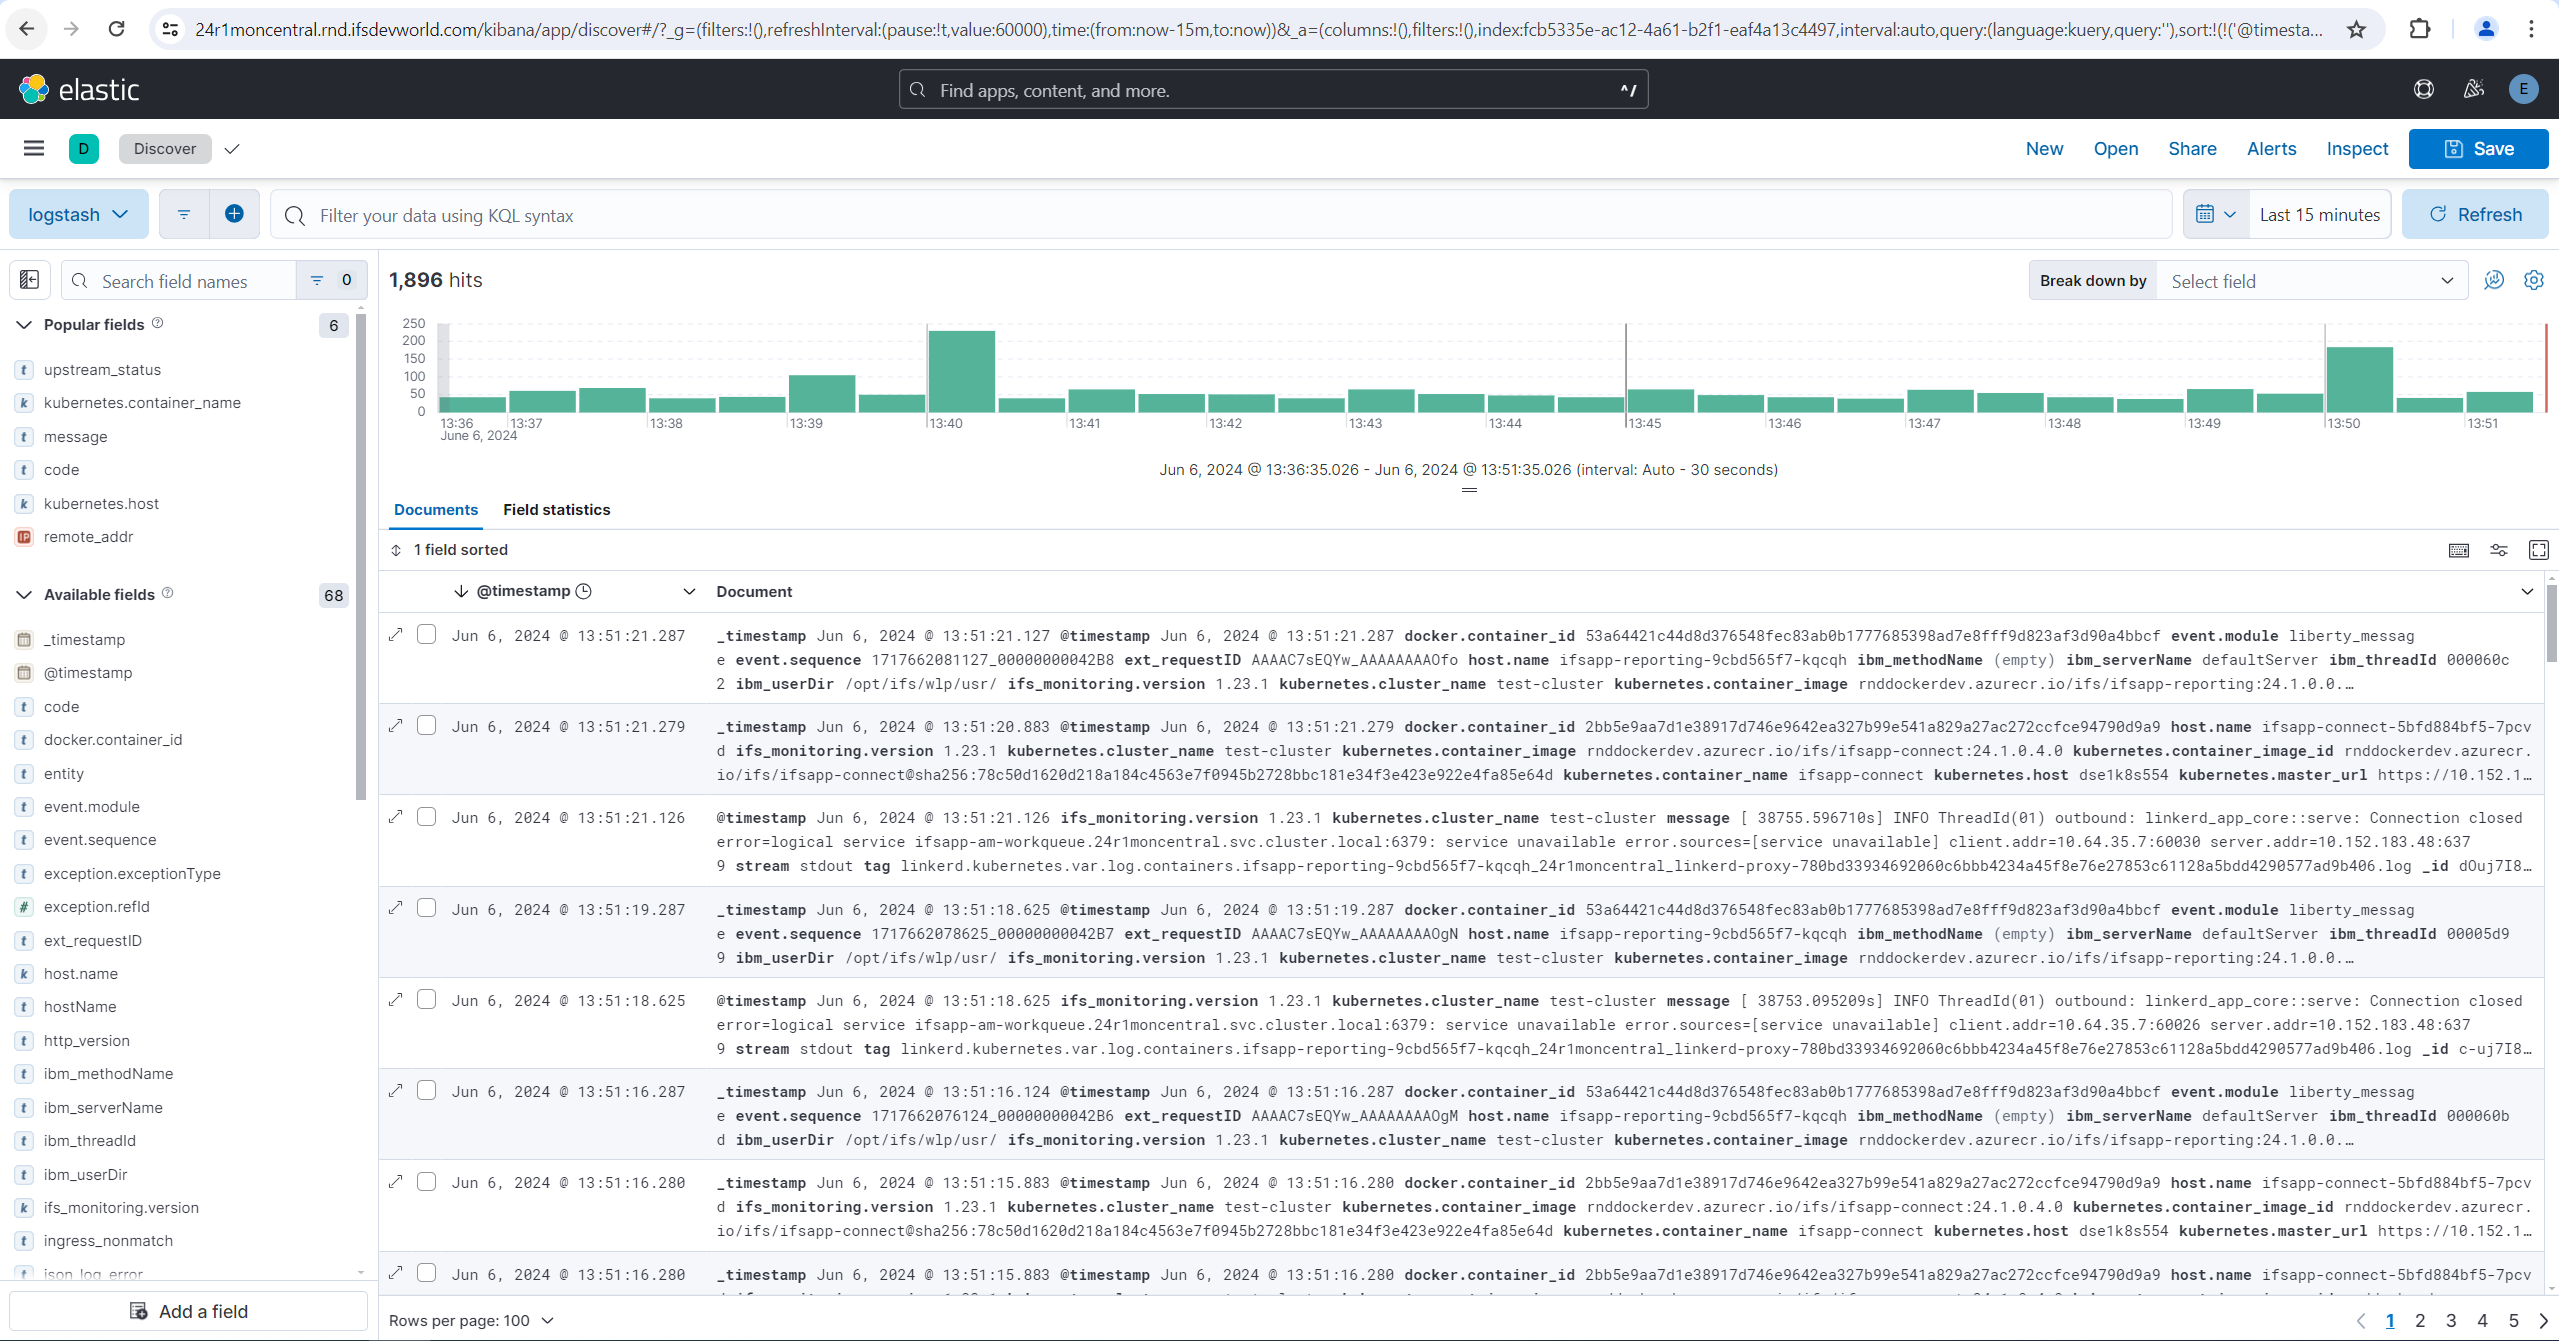
How to Query Container Logs using KQL
After navigating to Kibana Discover, the user will be able to use KQL to efficiently discover logs.
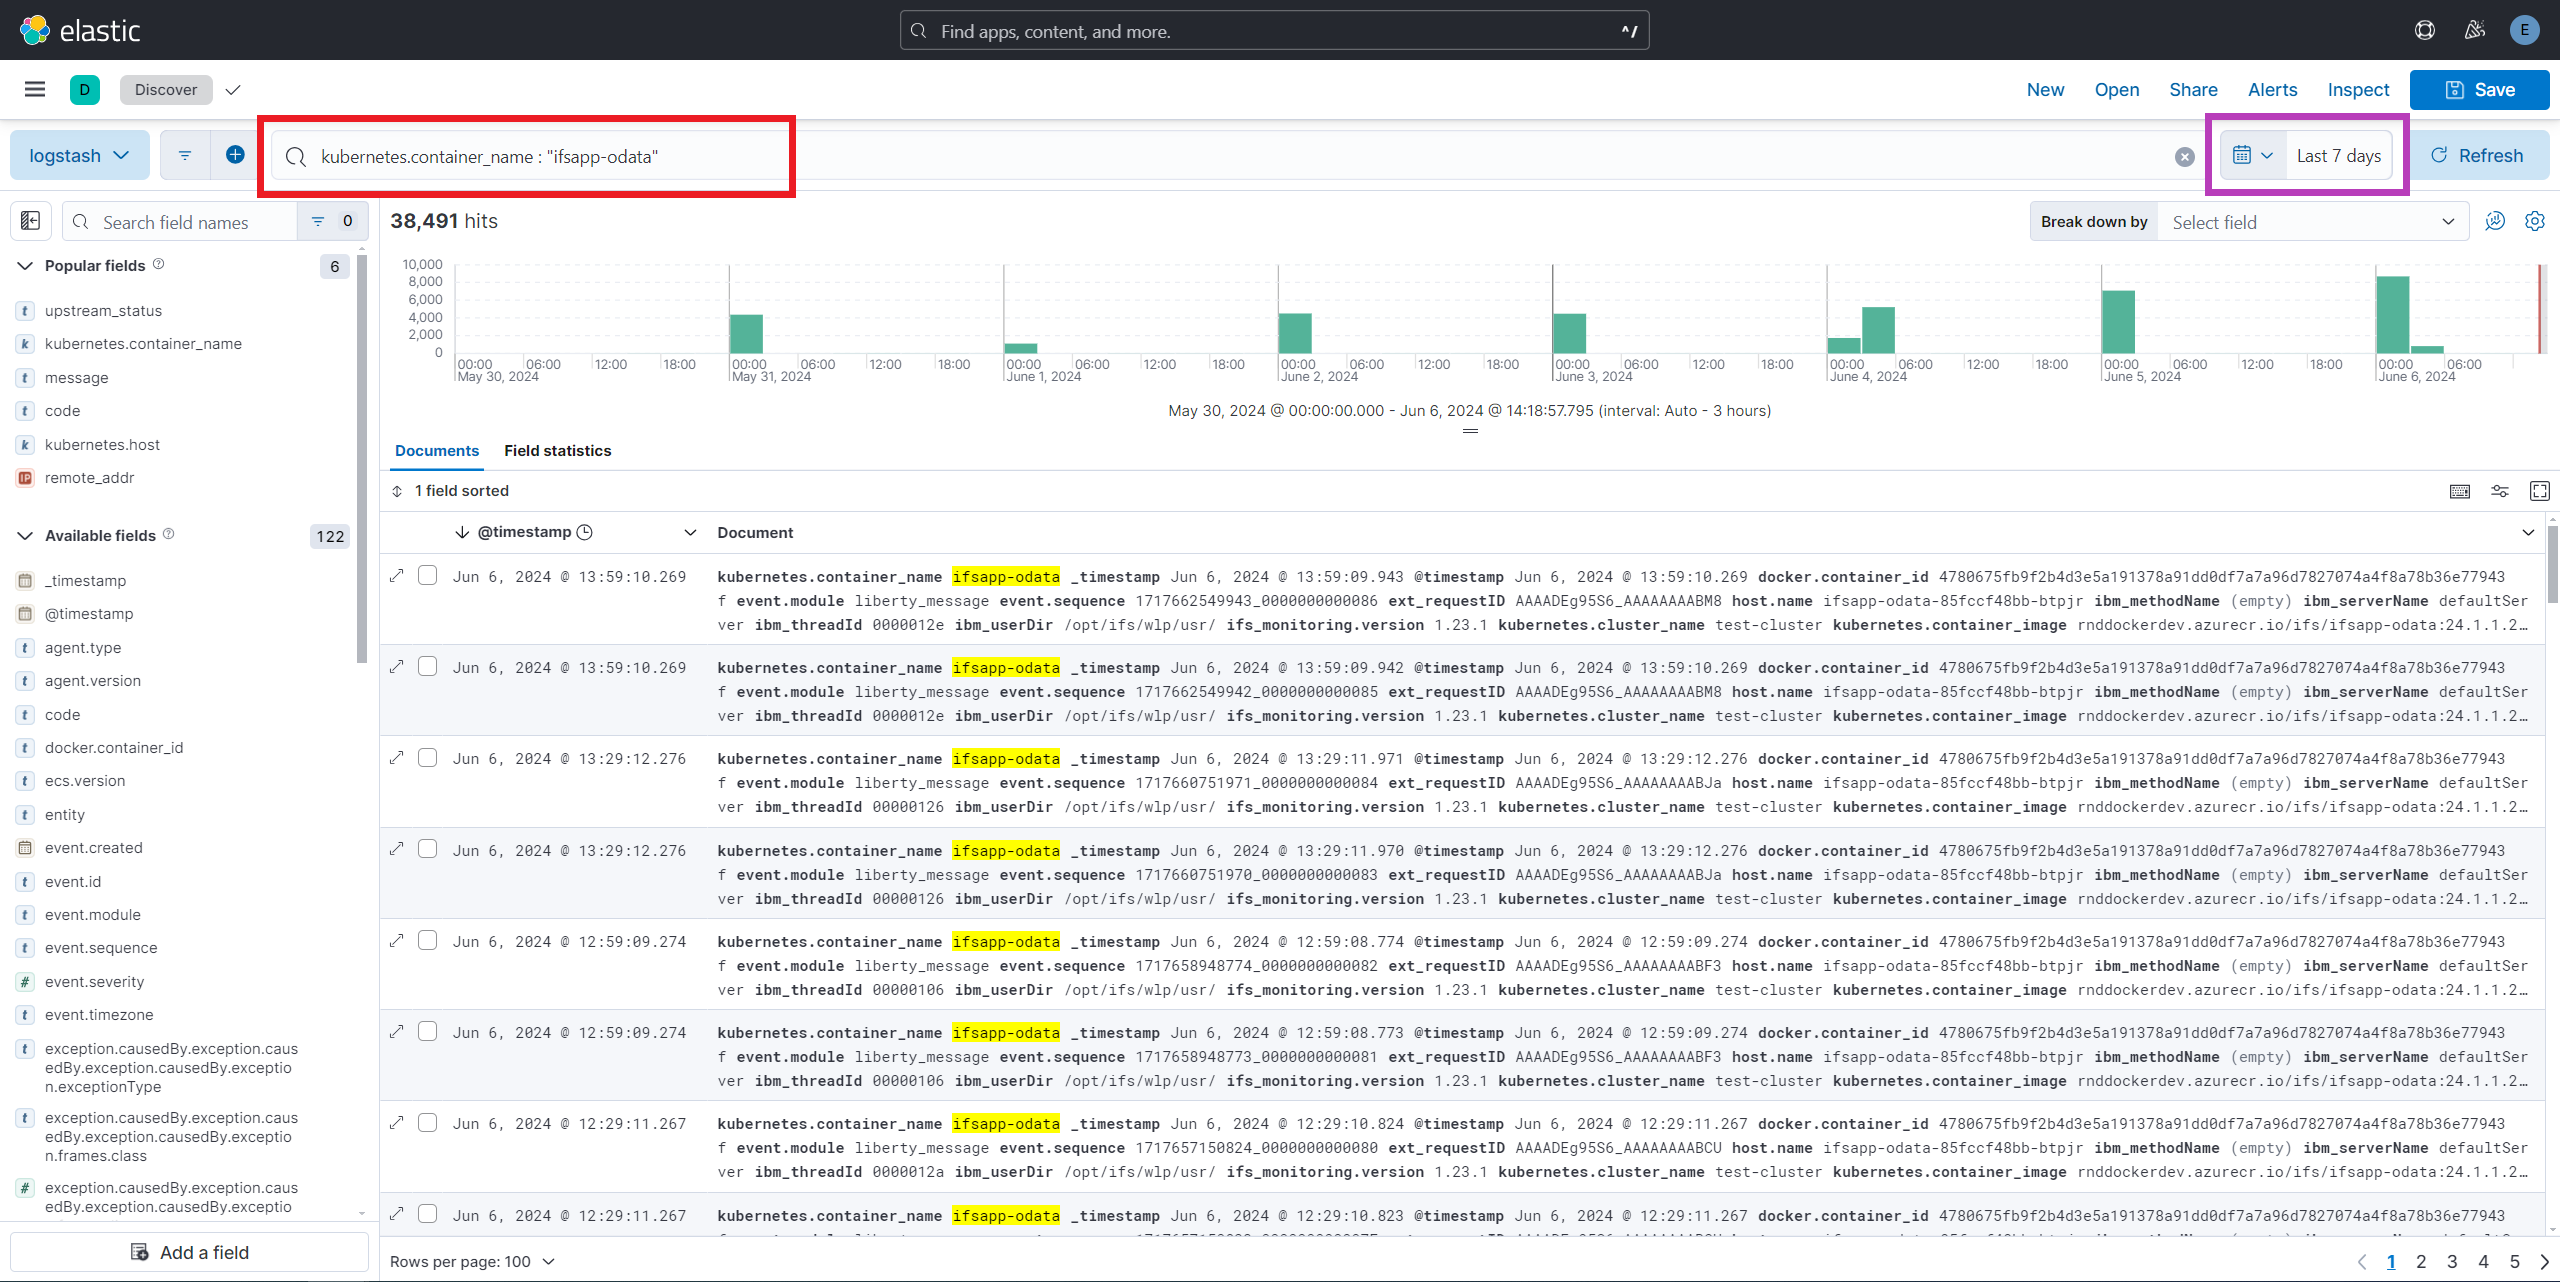
The Kibana Query can be added into the search filter text box. (e.g. kubernetes.container_name: "ifsapp-odata") The desired time period can also be selected.
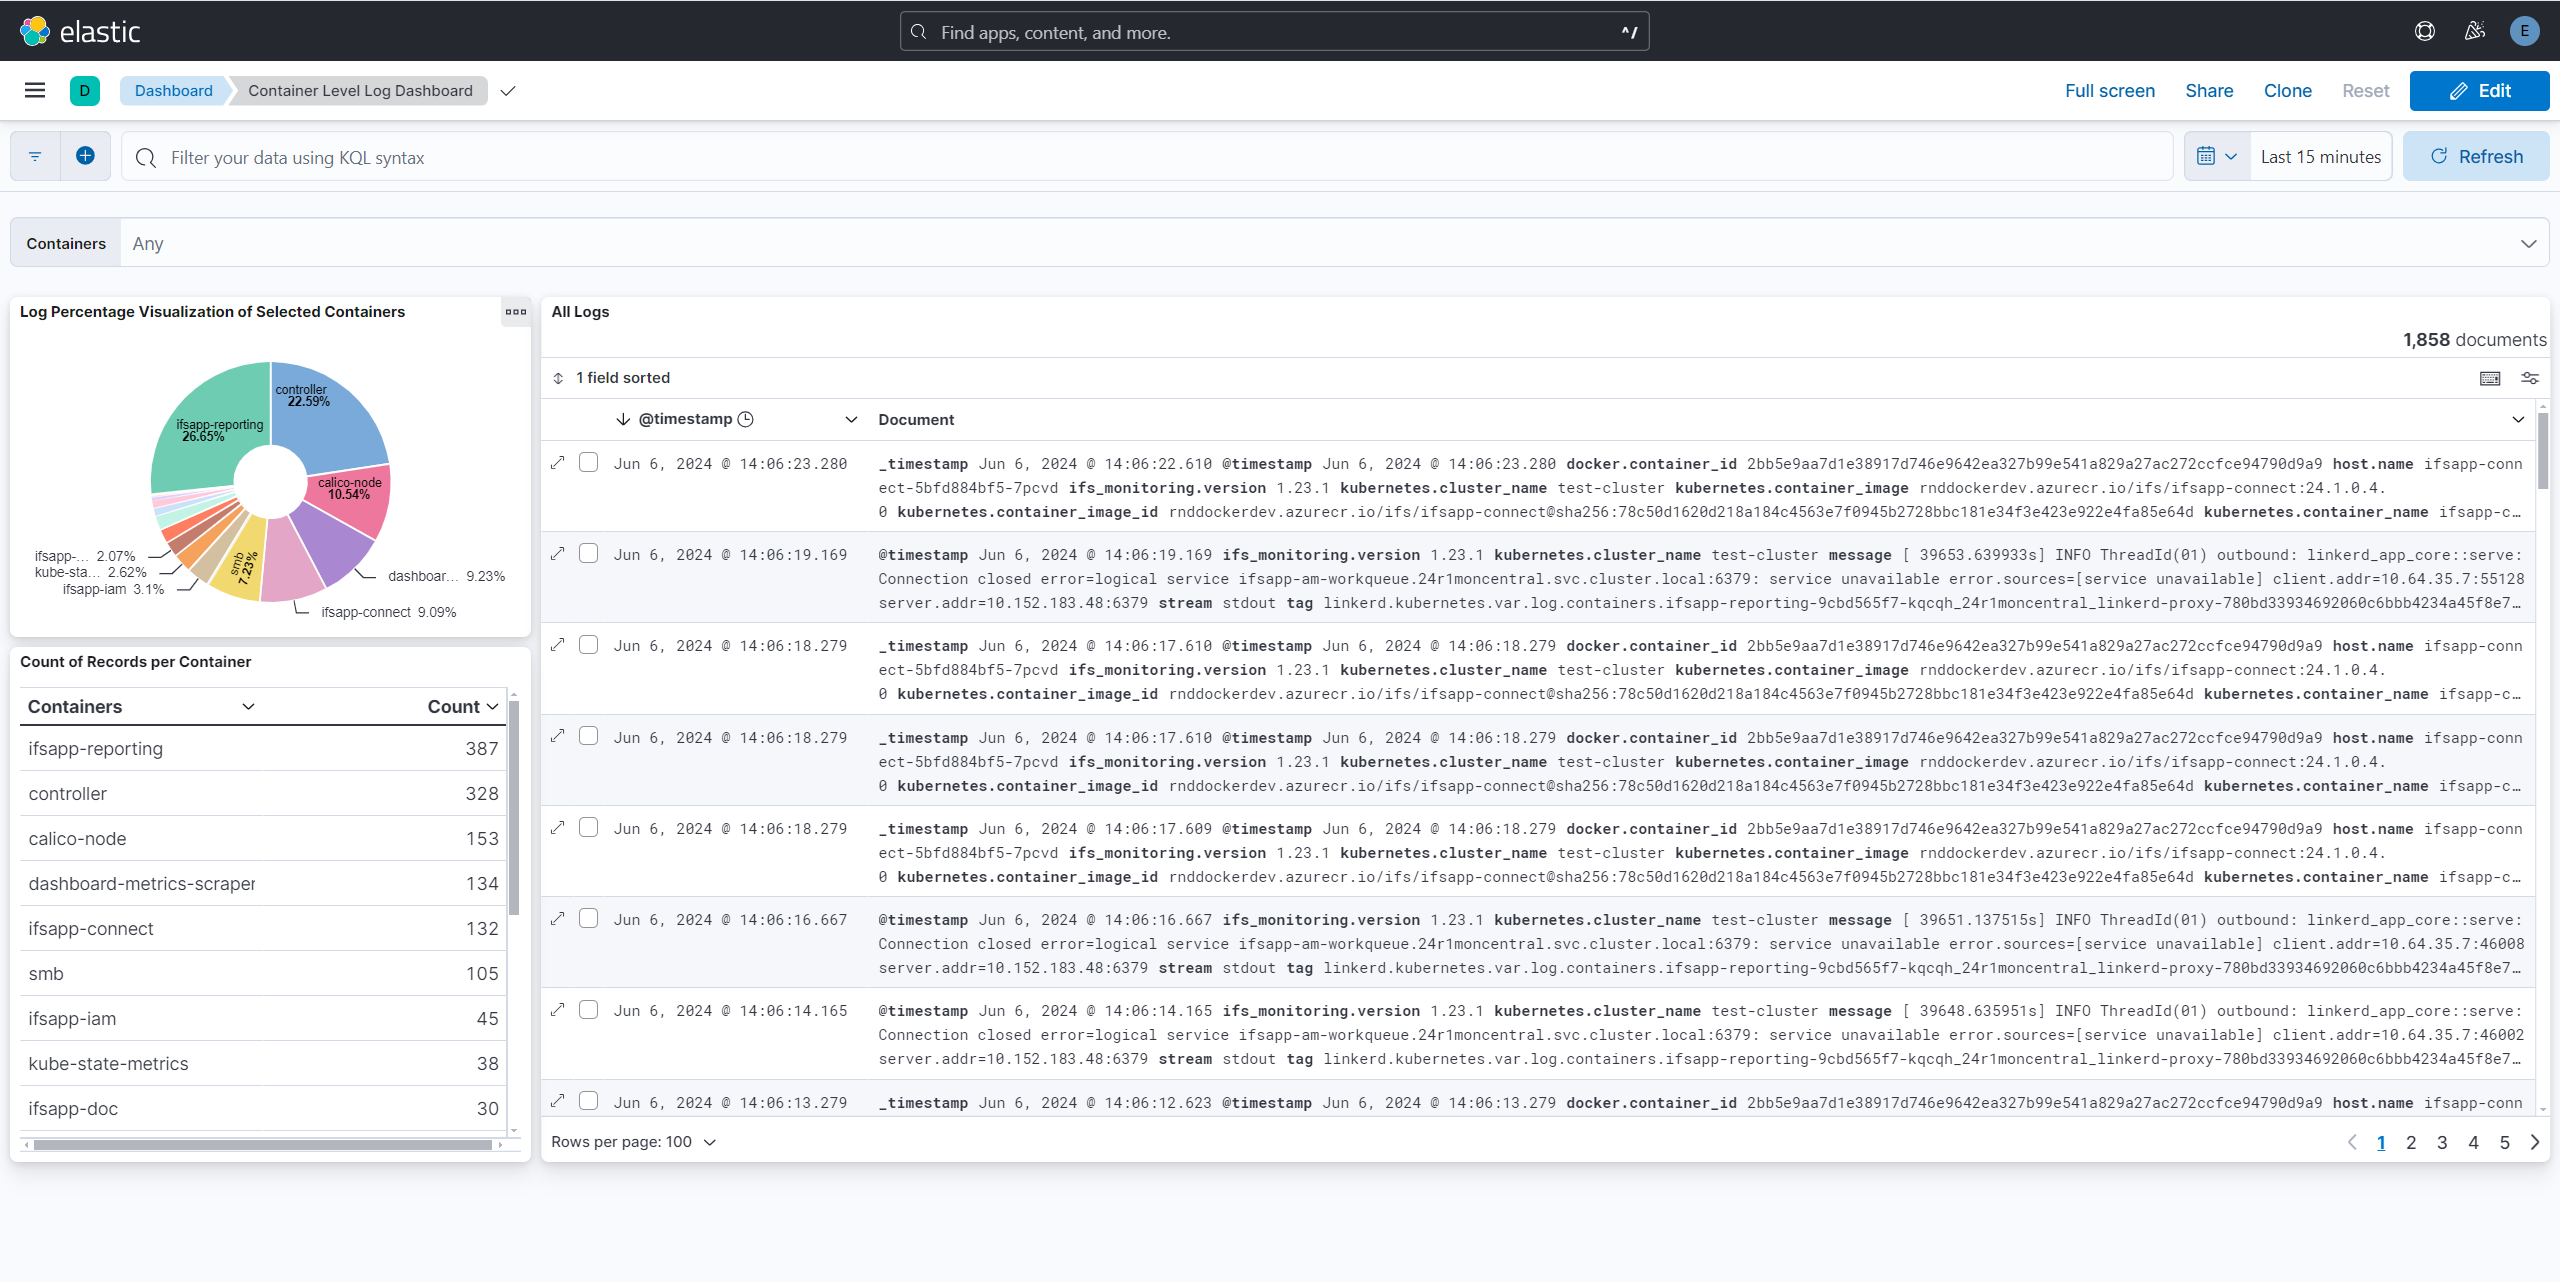
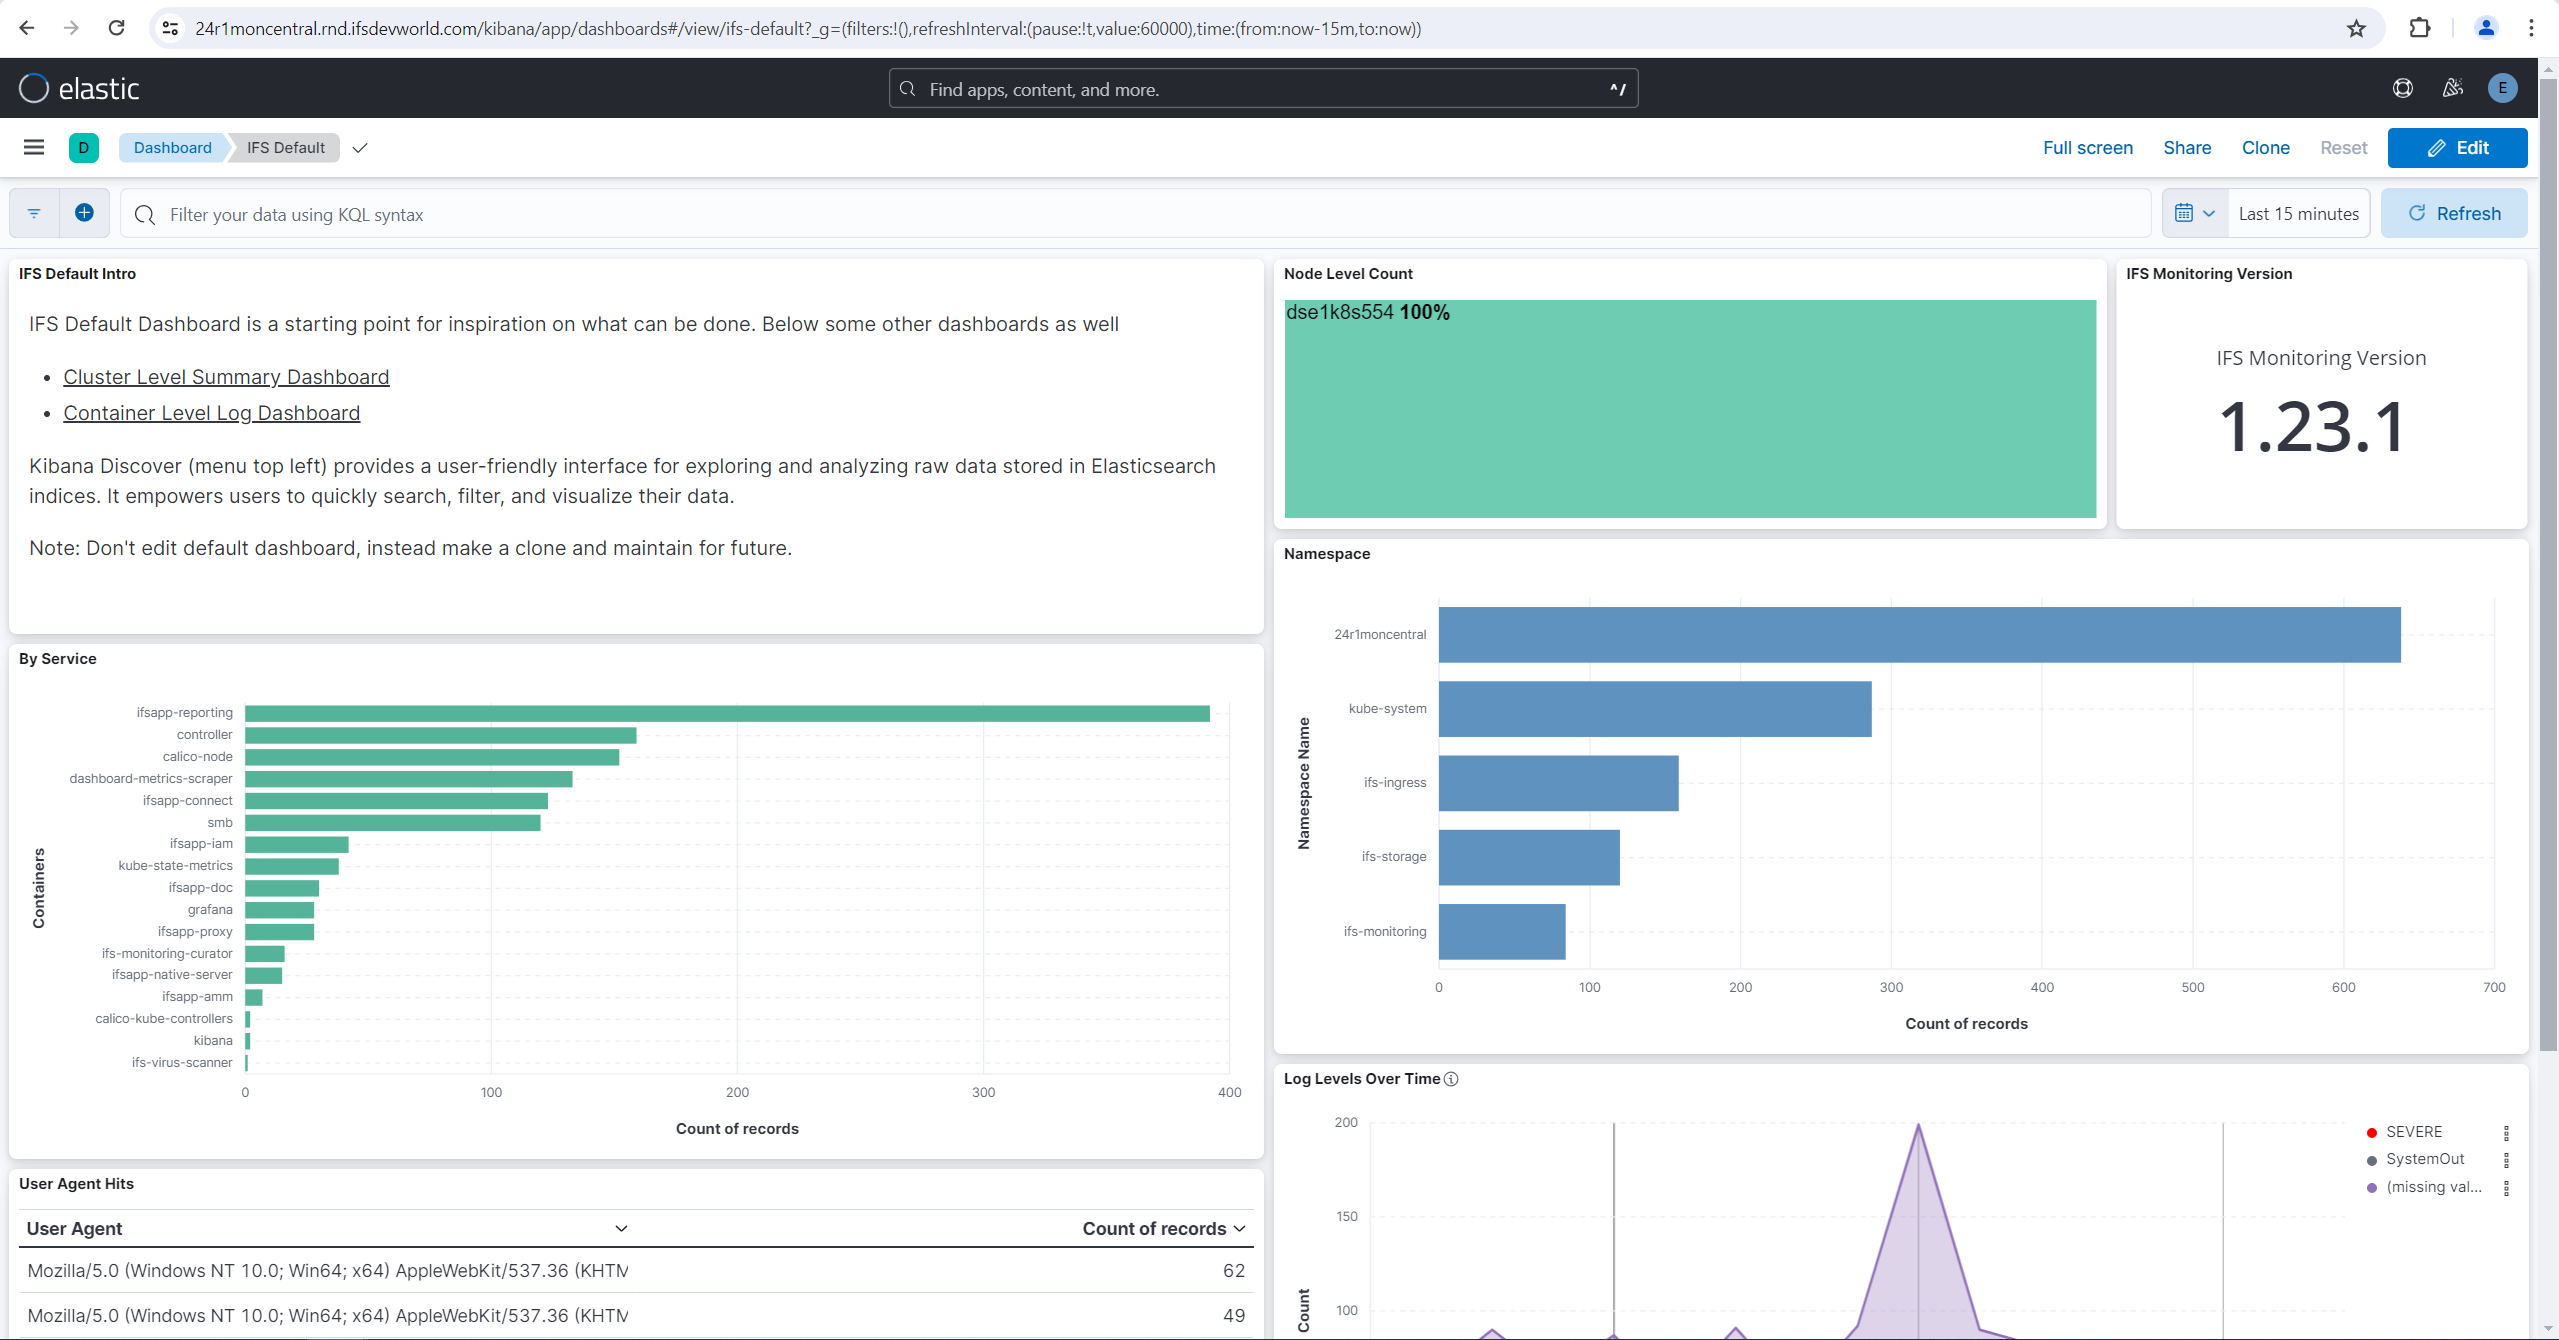
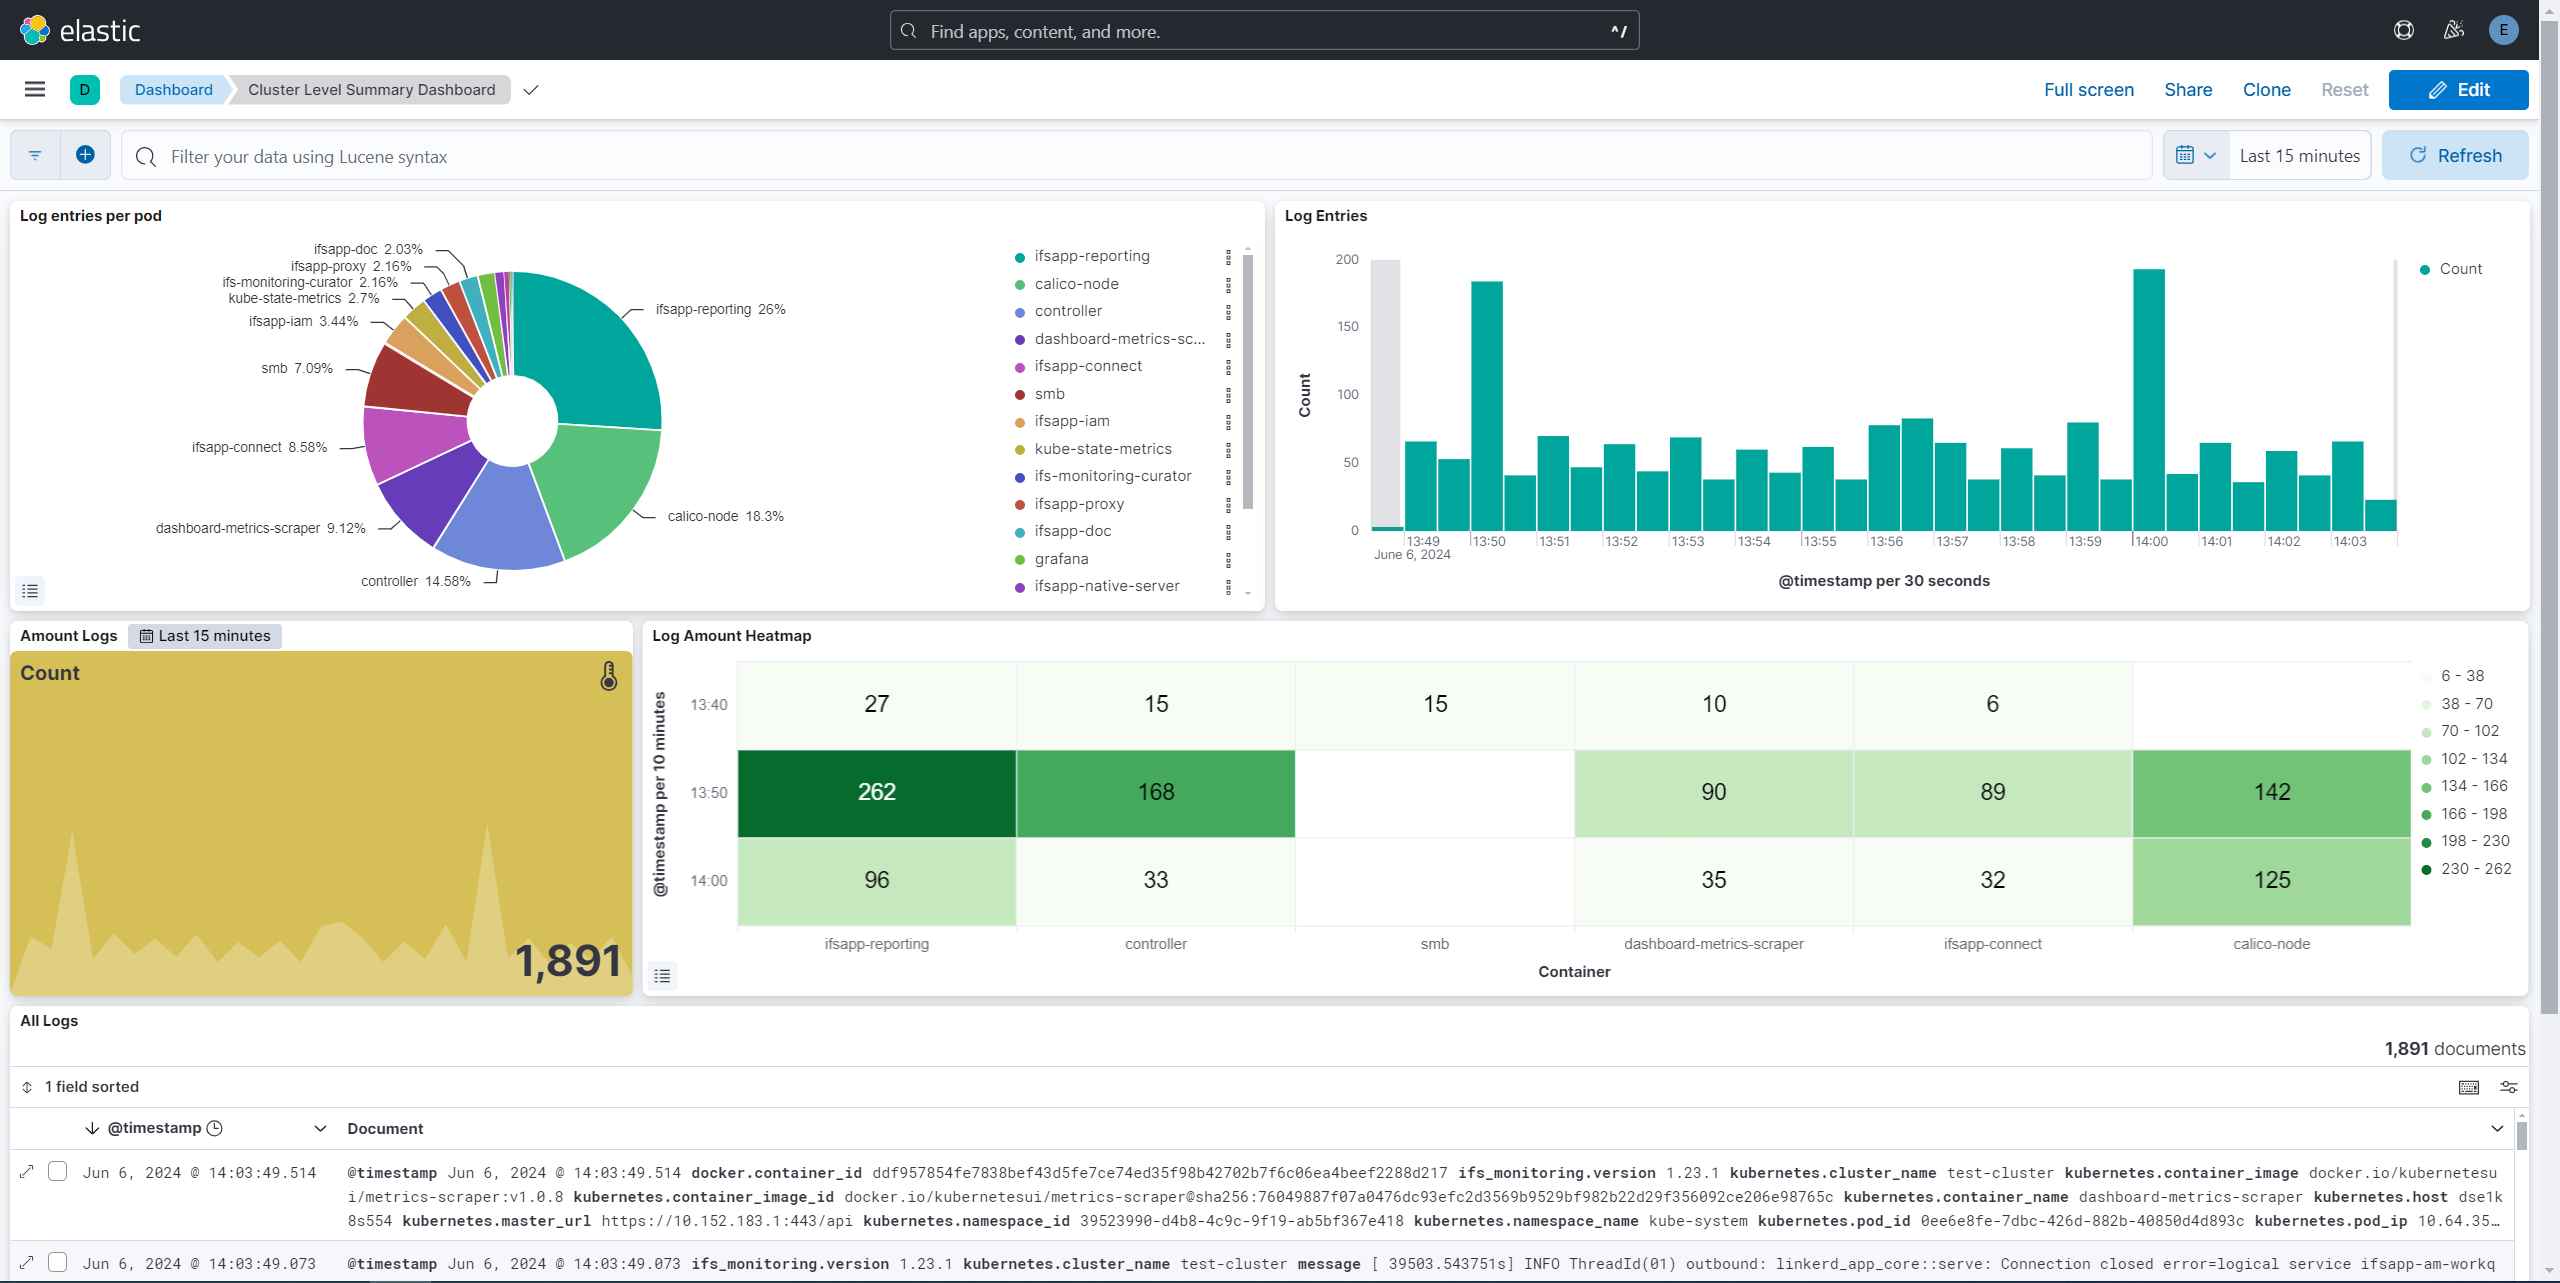
How to View Dashboards
-
The dashboards will get automatically imported, and there will be no requirement to import them manually.
-
Once logged in, the user will be automatically redirected to the dashboards.
-
Use any of the following links to navigate.
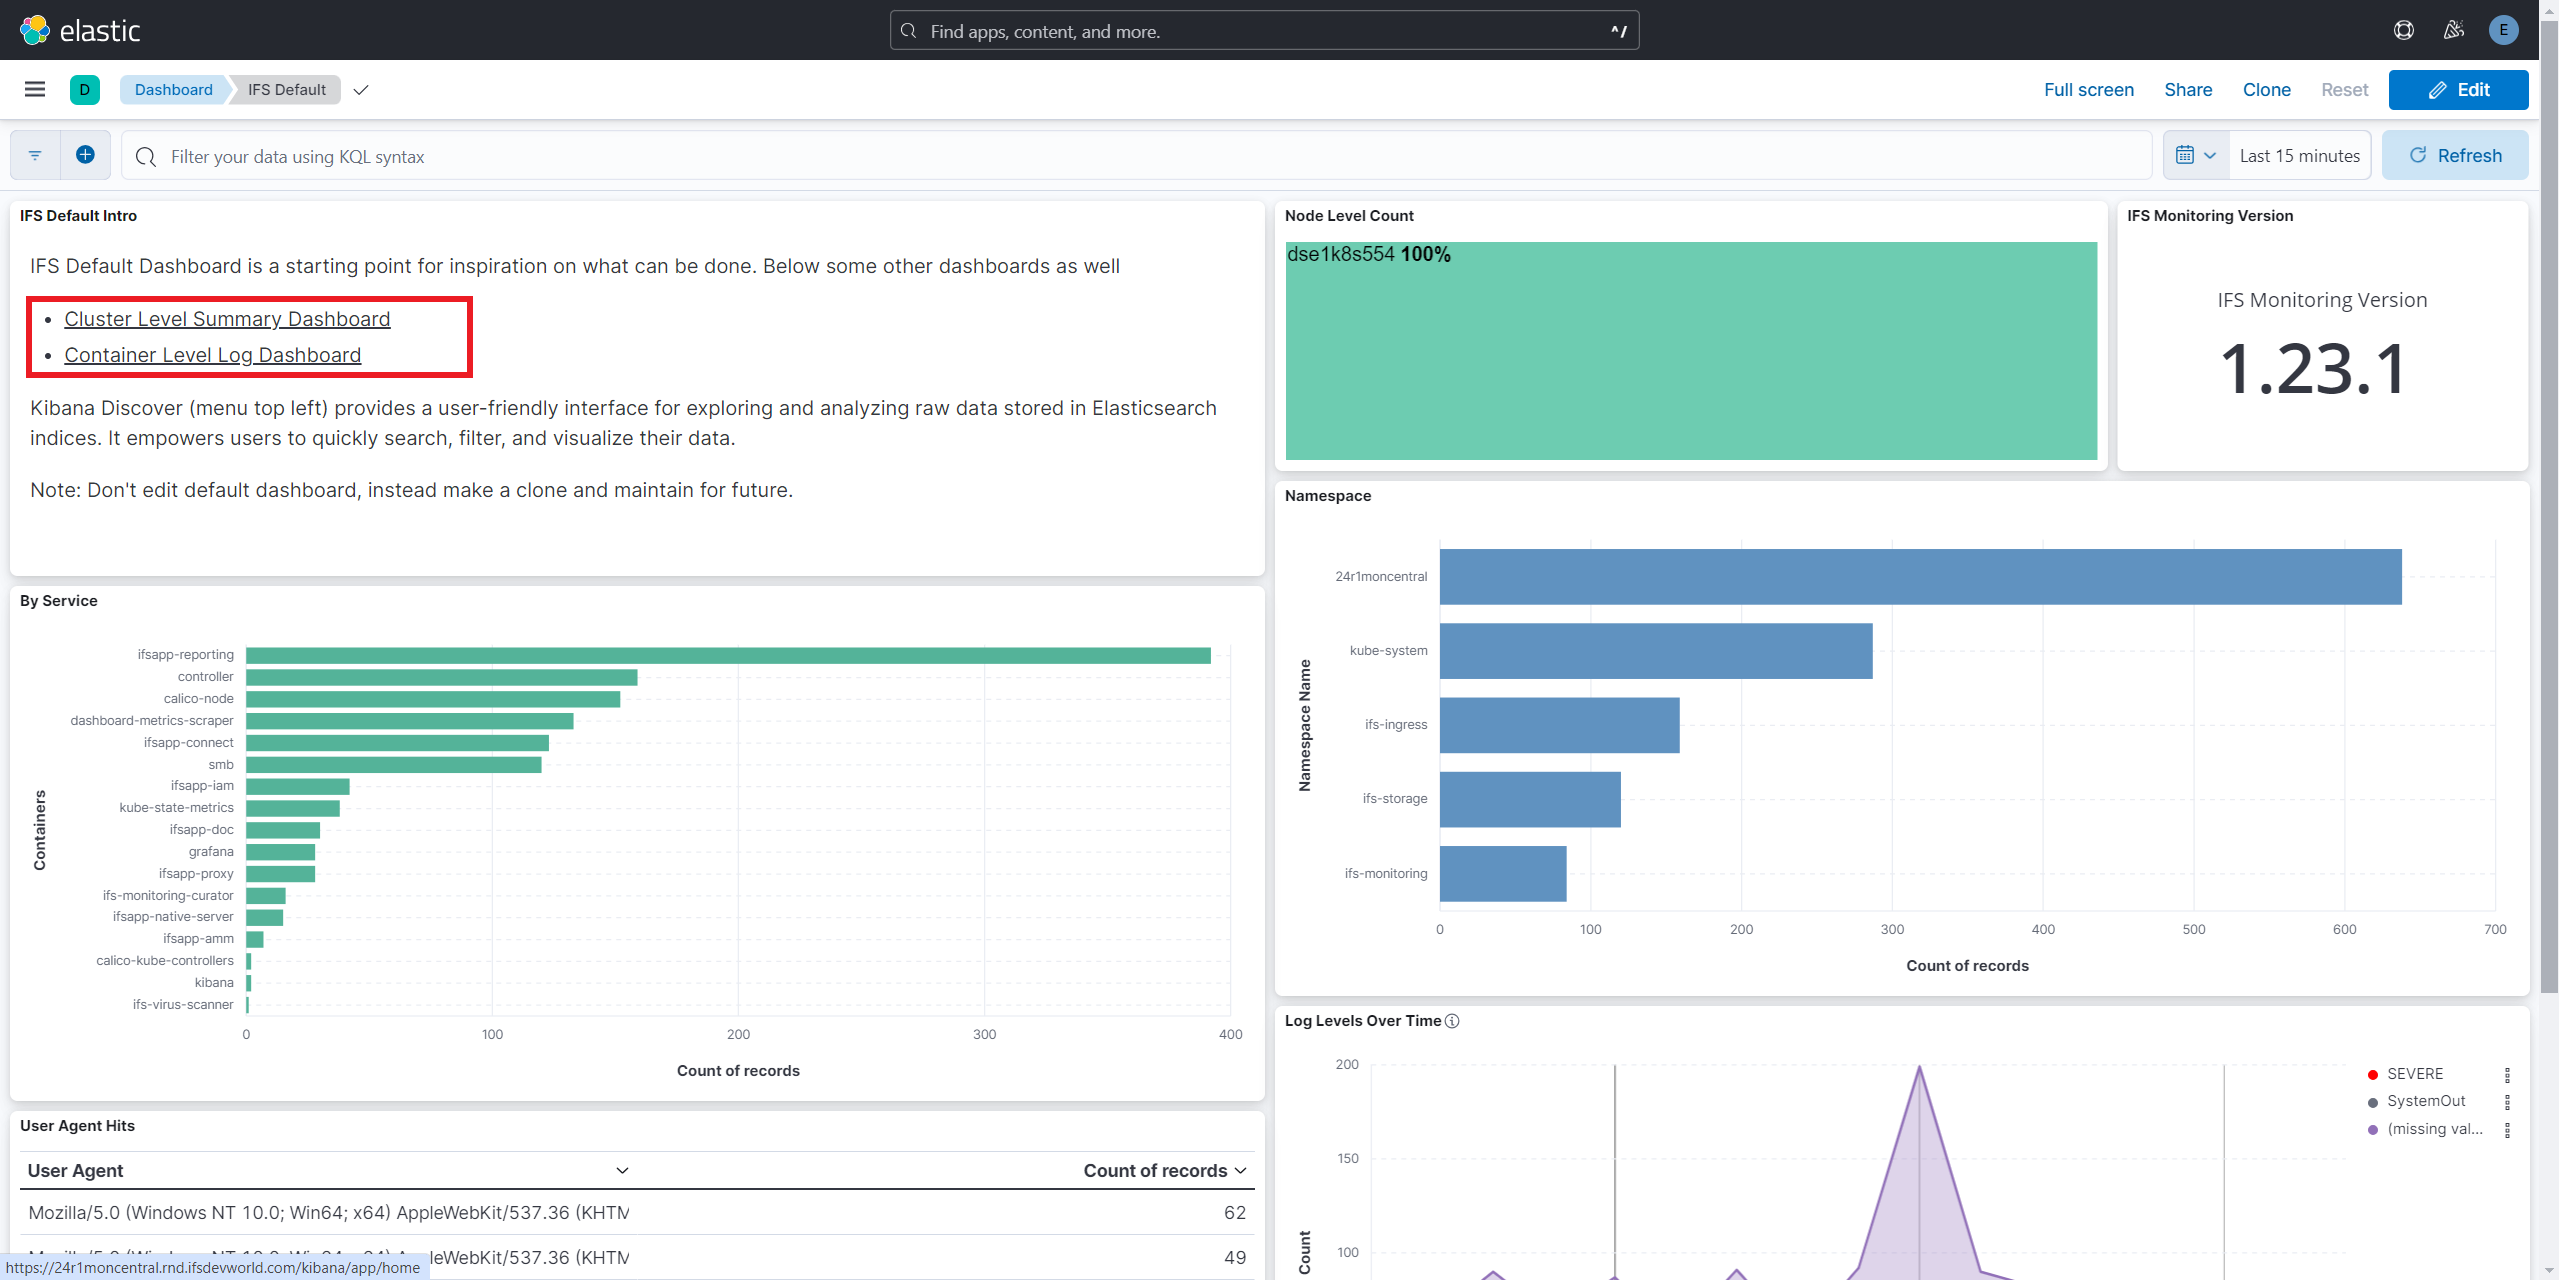
- Cluster-level Summary dashboard view
- Container-level Summary dashboard view