Metrics Monitoring - Kube-Prometheus Stack
-
The Kube-Prometheus stack is a collection of Kubernetes manifests, Grafana dashboards, and Prometheus rules combined with documentation and scripts, that provide easy-to-operate, end-to-end Kubernetes cluster monitoring with Prometheus, using the Prometheus Operator.
-
Grafana allows users to query, visualize, and understand user metrics regardless of where they are stored. Grafana also enables creating, exploring, and sharing appealing dashboards with users, fostering a data-driven culture.
NOTE: The data retention size and period of Prometheus are respectively 7GB and 16 days.
Grafana Versions
Grafana from 22R2 GA to 22R2 SU7
Accessing Grafana Dashboards
1. Browse the Grafana Dashboard of IFS Remote Solution. [Log in to Grafana]
- e.g. Browse to https://Linuxhost/grafana
2. Authentication
-
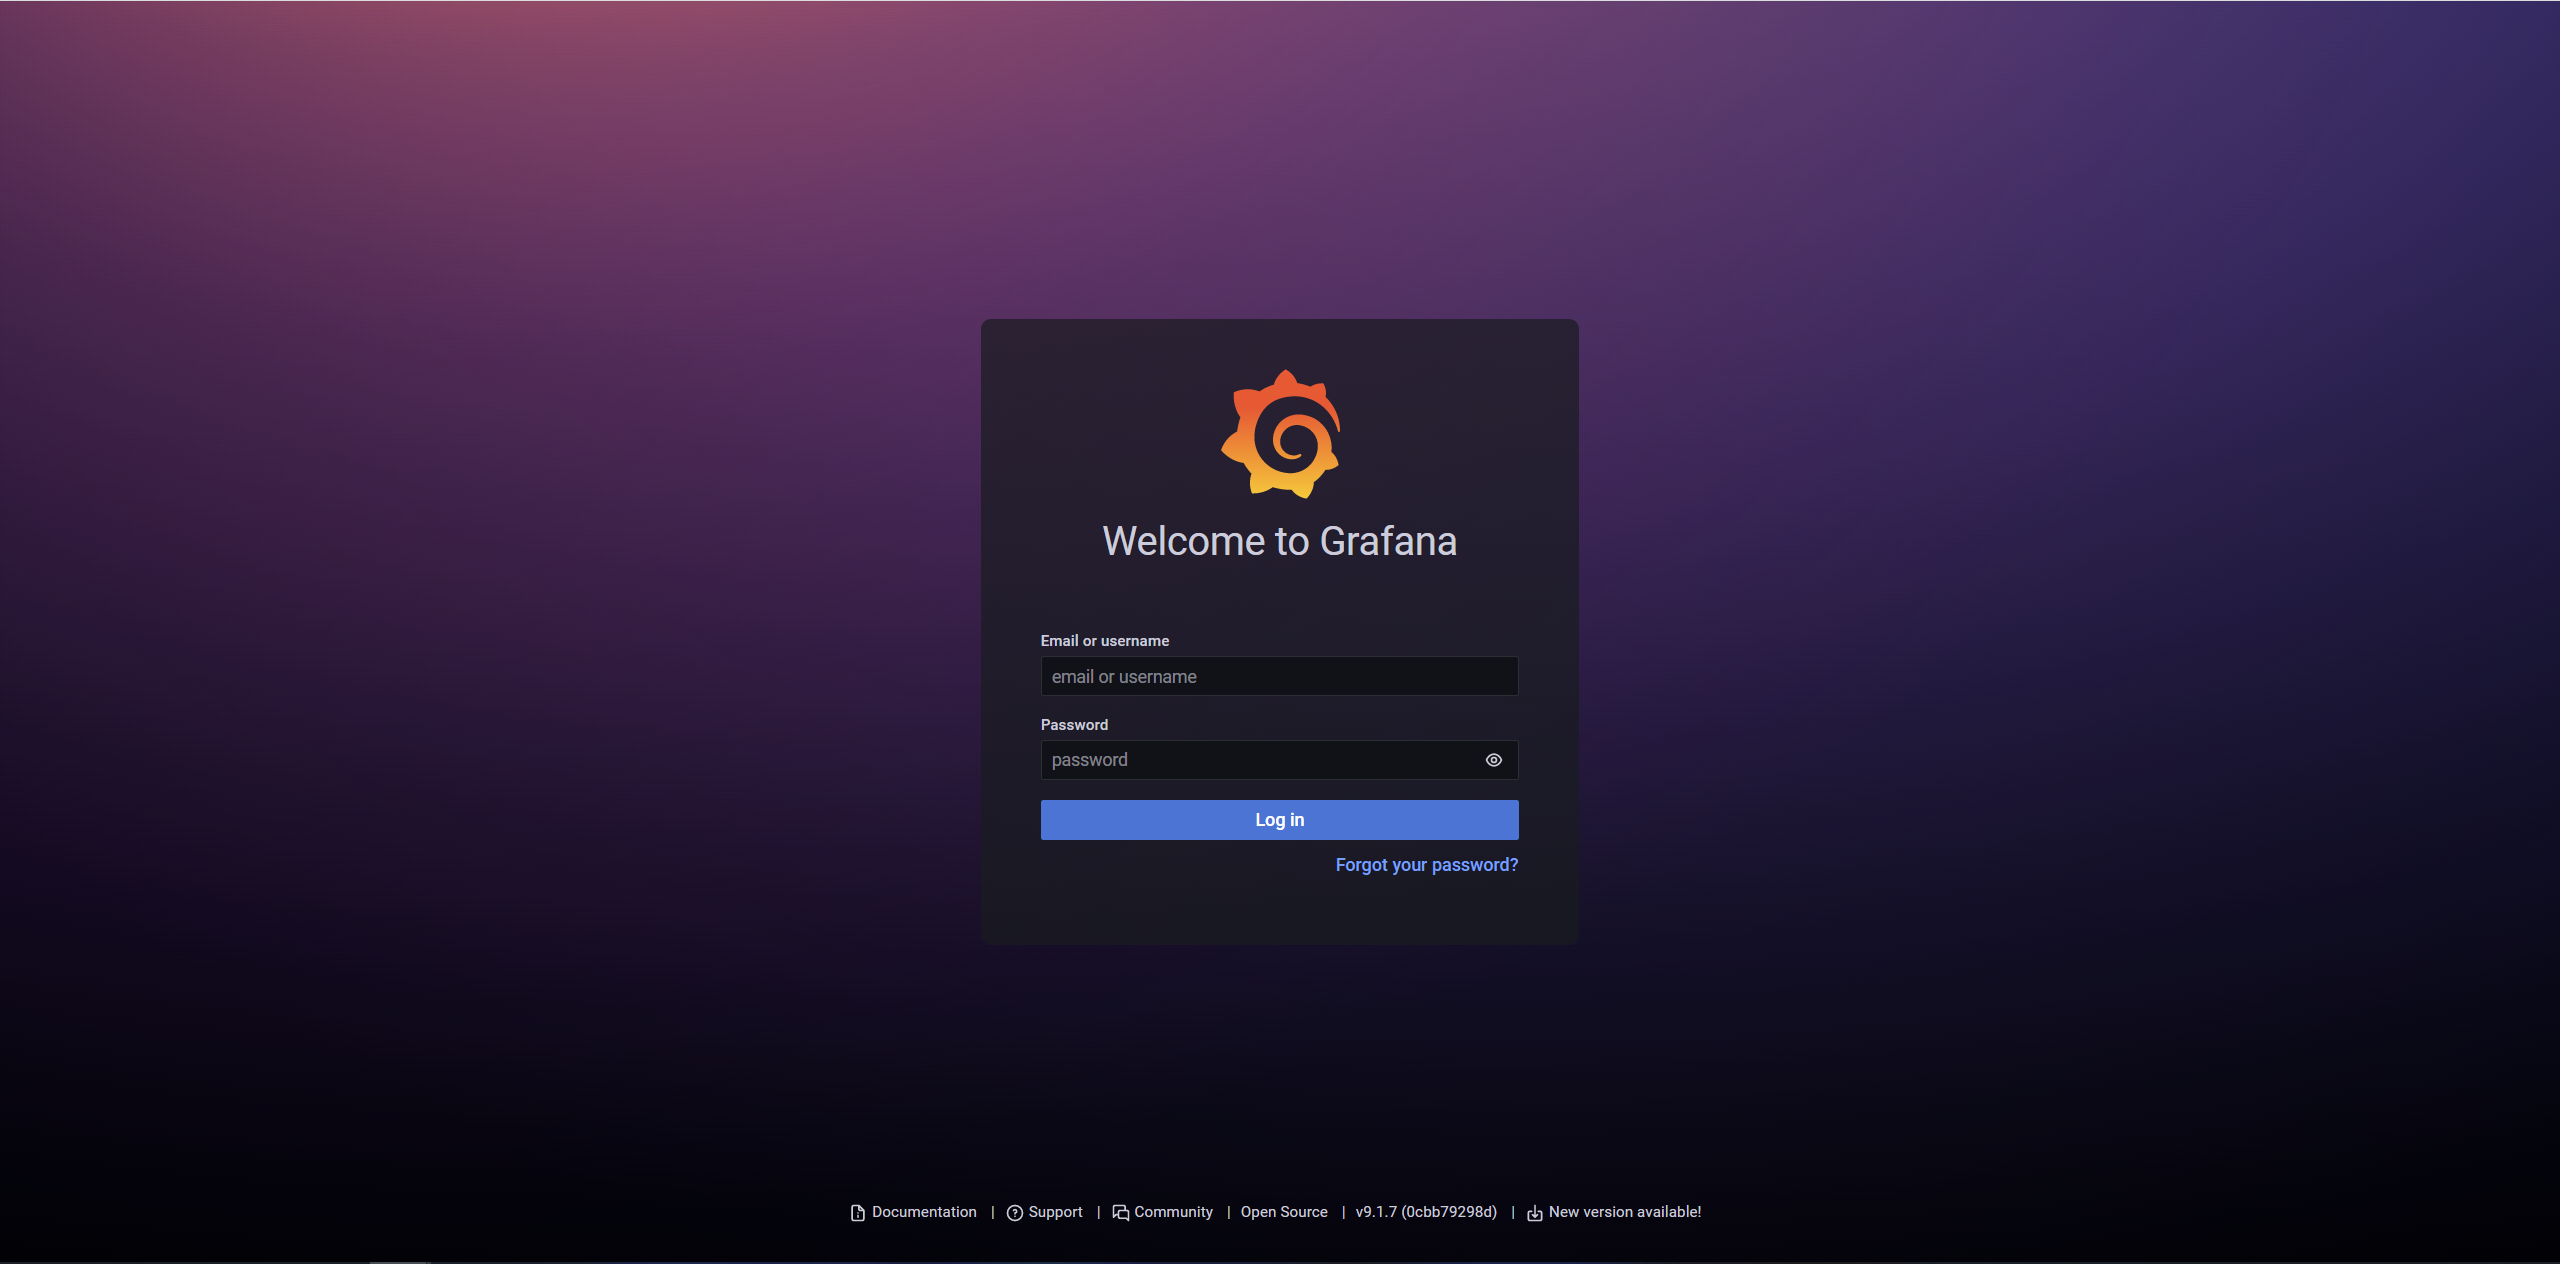
Enter the username and password to log in to dashboards.
-
Extract the username and password from the IFS-Remote Monitoring file location in your windows machine: ifsroot > config > secrets > grafana_creds file
-
Grafana Home Page.
Viewing Grafana default Dashboards
-
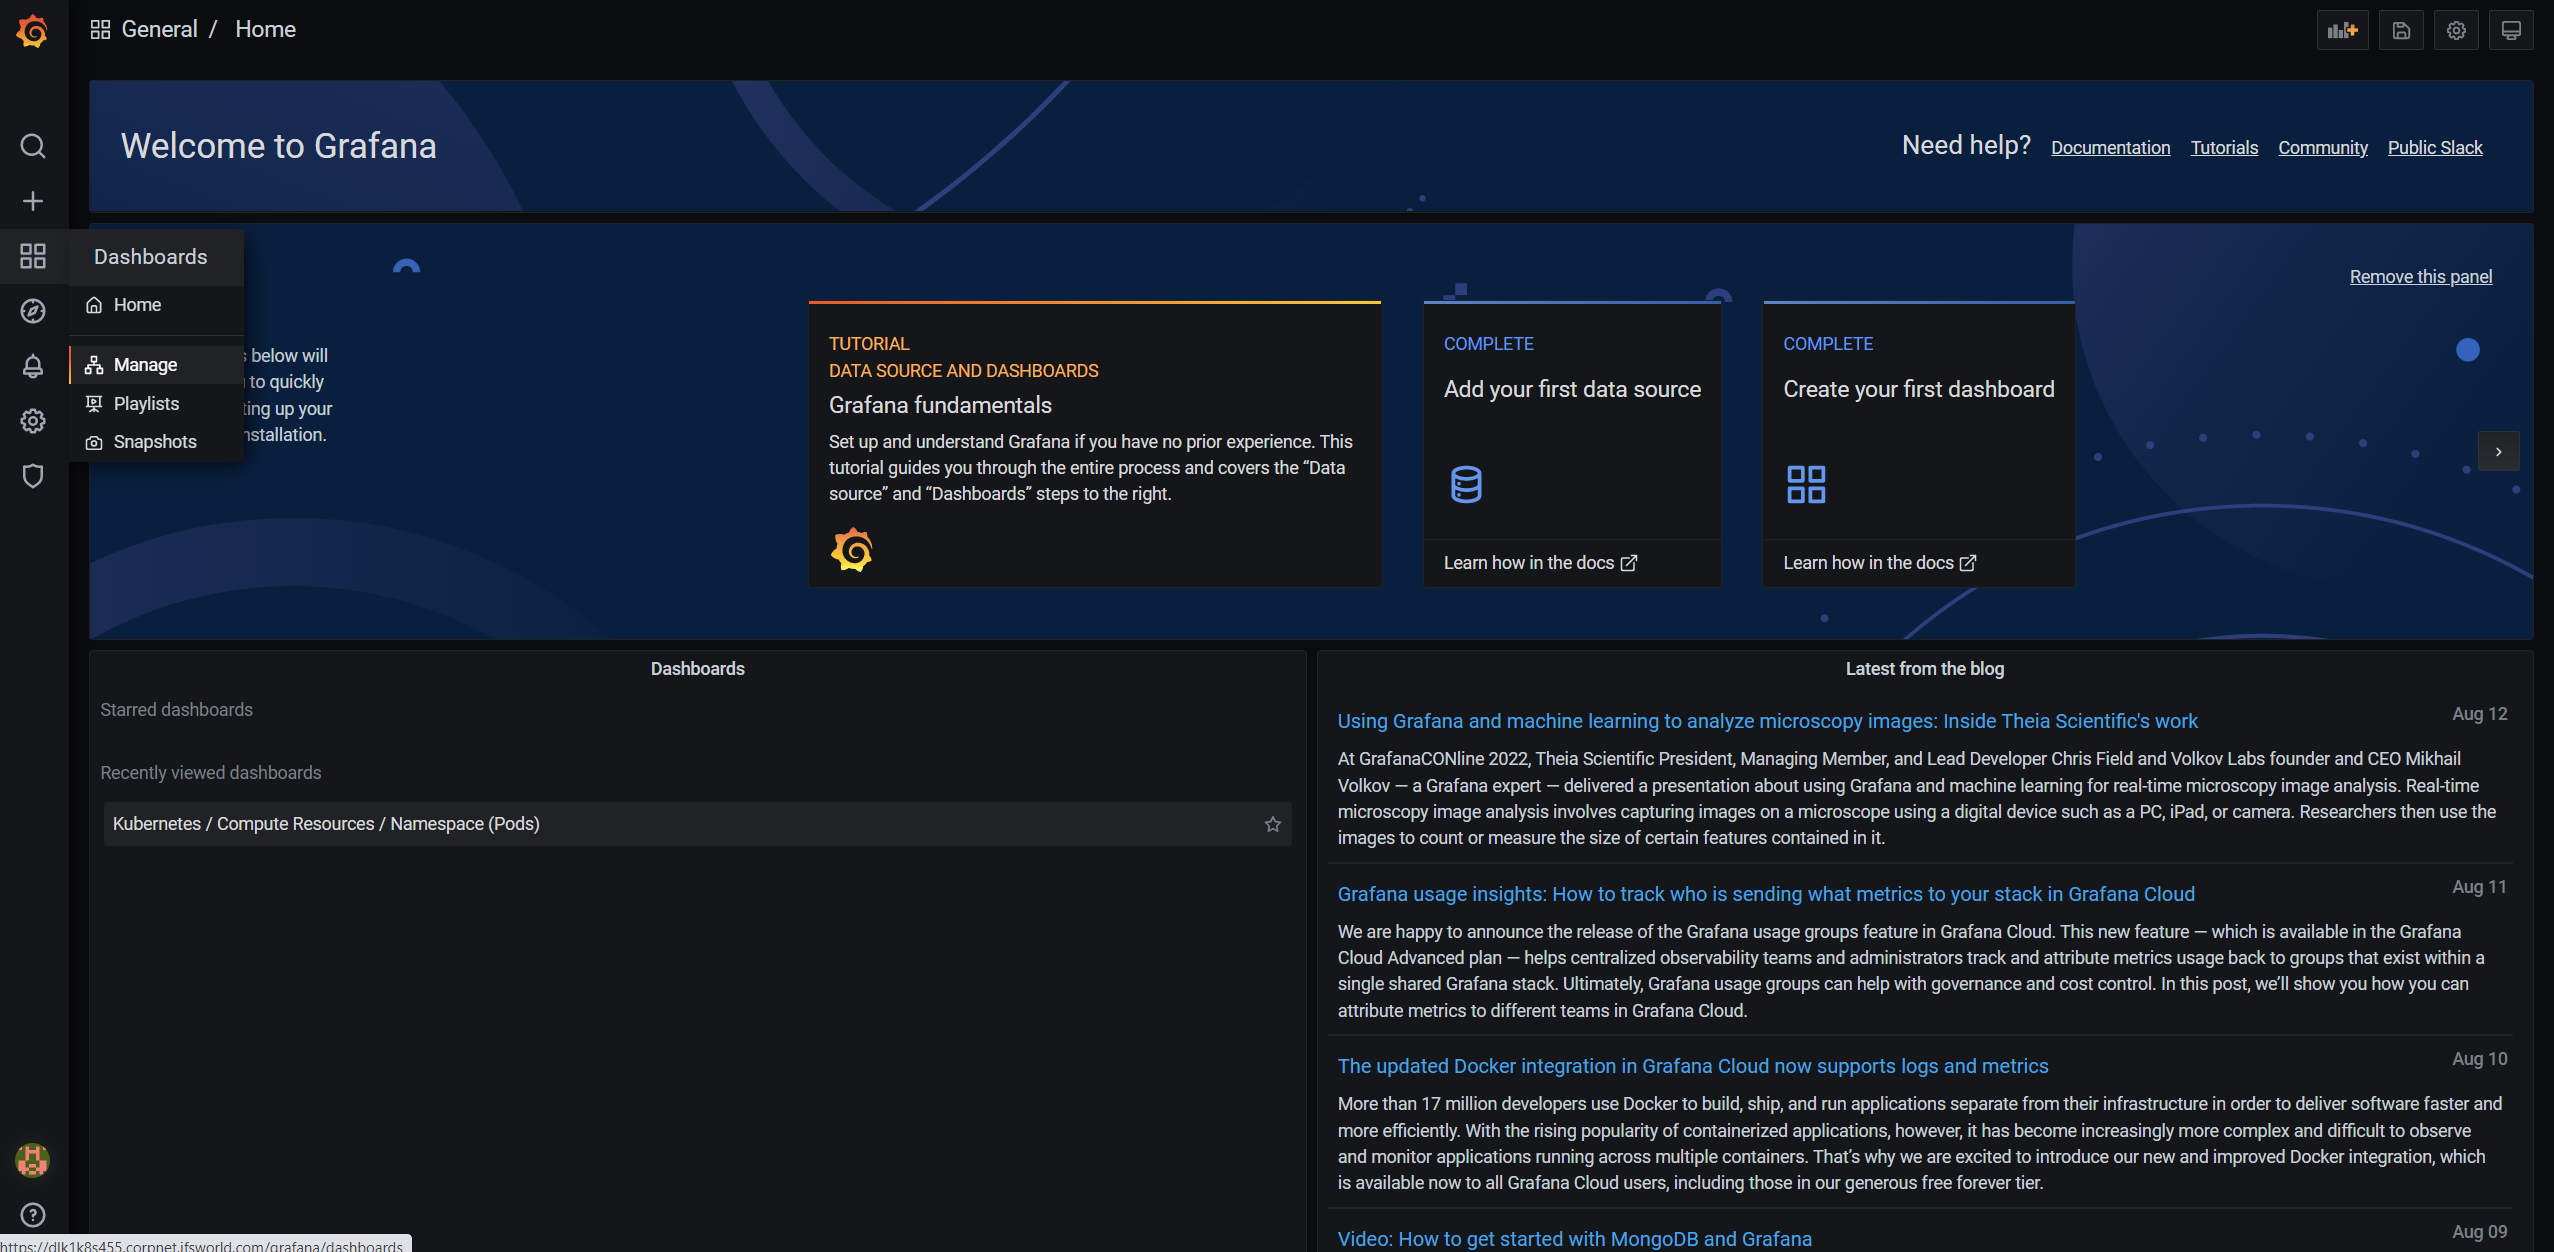
Navigate to Manage from the menu.

-
View the Current Dashboard List.
Use the below dashboards to monitor metrics:
- Kubernetes / Compute Resources / Cluster
- Kubernetes / Compute Resources / Namespace (Pods)
- Kubernetes / Compute Resources / Namespace (Workloads)
- Kubernetes / Compute Resources / Node (Pods)
- Kubernetes / Compute Resources / Pod
- Kubernetes / Compute Resources / Workload
-
The following is the Grafana Dashboard view.
Importing Grafana Dashboards
-
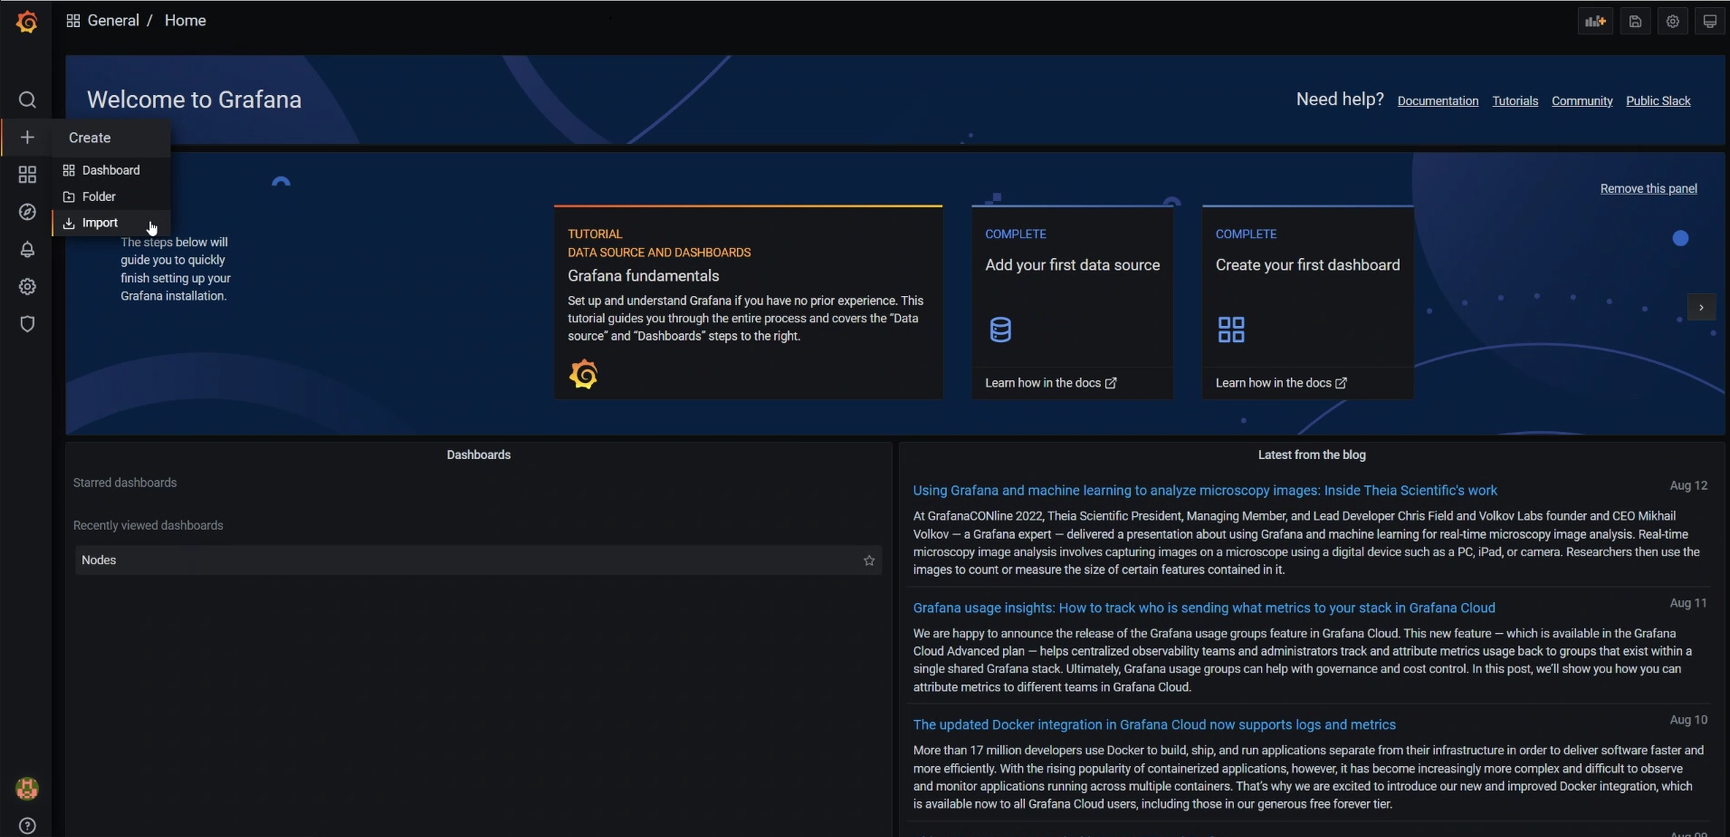
To navigate to the side menu click the plus + icon and Select Import.

-
Import your JSON code or the JSON file of the relevant location.
-
Navigate to the manage section to view the imported dashboard.

-
View the imported dashboard here.
Grafana from 22R2 SU7 onwards
Accessing Grafana Dashboards
1. Browse the Grafana Dashboard of IFS Remote Solution. [Log in to Grafana]
- e.g. Browse to https://Linuxhost/grafana
2. Authentication
-
Enter the username and password to log in to dashboards.

-
Extract the username and password from the IFS-Remote Monitoring file location in your windows machine: ifsroot > config > secrets > grafana_creds file
-
Grafana Home Page.
Viewing Grafana default Dashboards
-
Navigate to Browse from the menu.
-
View the Current Dashboard List. (If the list does not appear, click to open the general folder)
Use the below dashboards to monitor metrics:
- Kubernetes / Compute Resources / Cluster
- Kubernetes / Compute Resources / Namespace (Pods)
- Kubernetes / Compute Resources / Namespace (Workloads)
- Kubernetes / Compute Resources / Node (Pods)
- Kubernetes / Compute Resources / Pod
- Kubernetes / Compute Resources / Workload
-
Grafana Dashboard view.
Downloading IFS Grafana Dashboards
- Navigate to infrastructure/grafana-dashboard folder from the root folder location of windows management server.
- Find more information on basic Grafana dashboards here: Metrics Monitoring Dashboards
Importing Grafana Dashboards
-
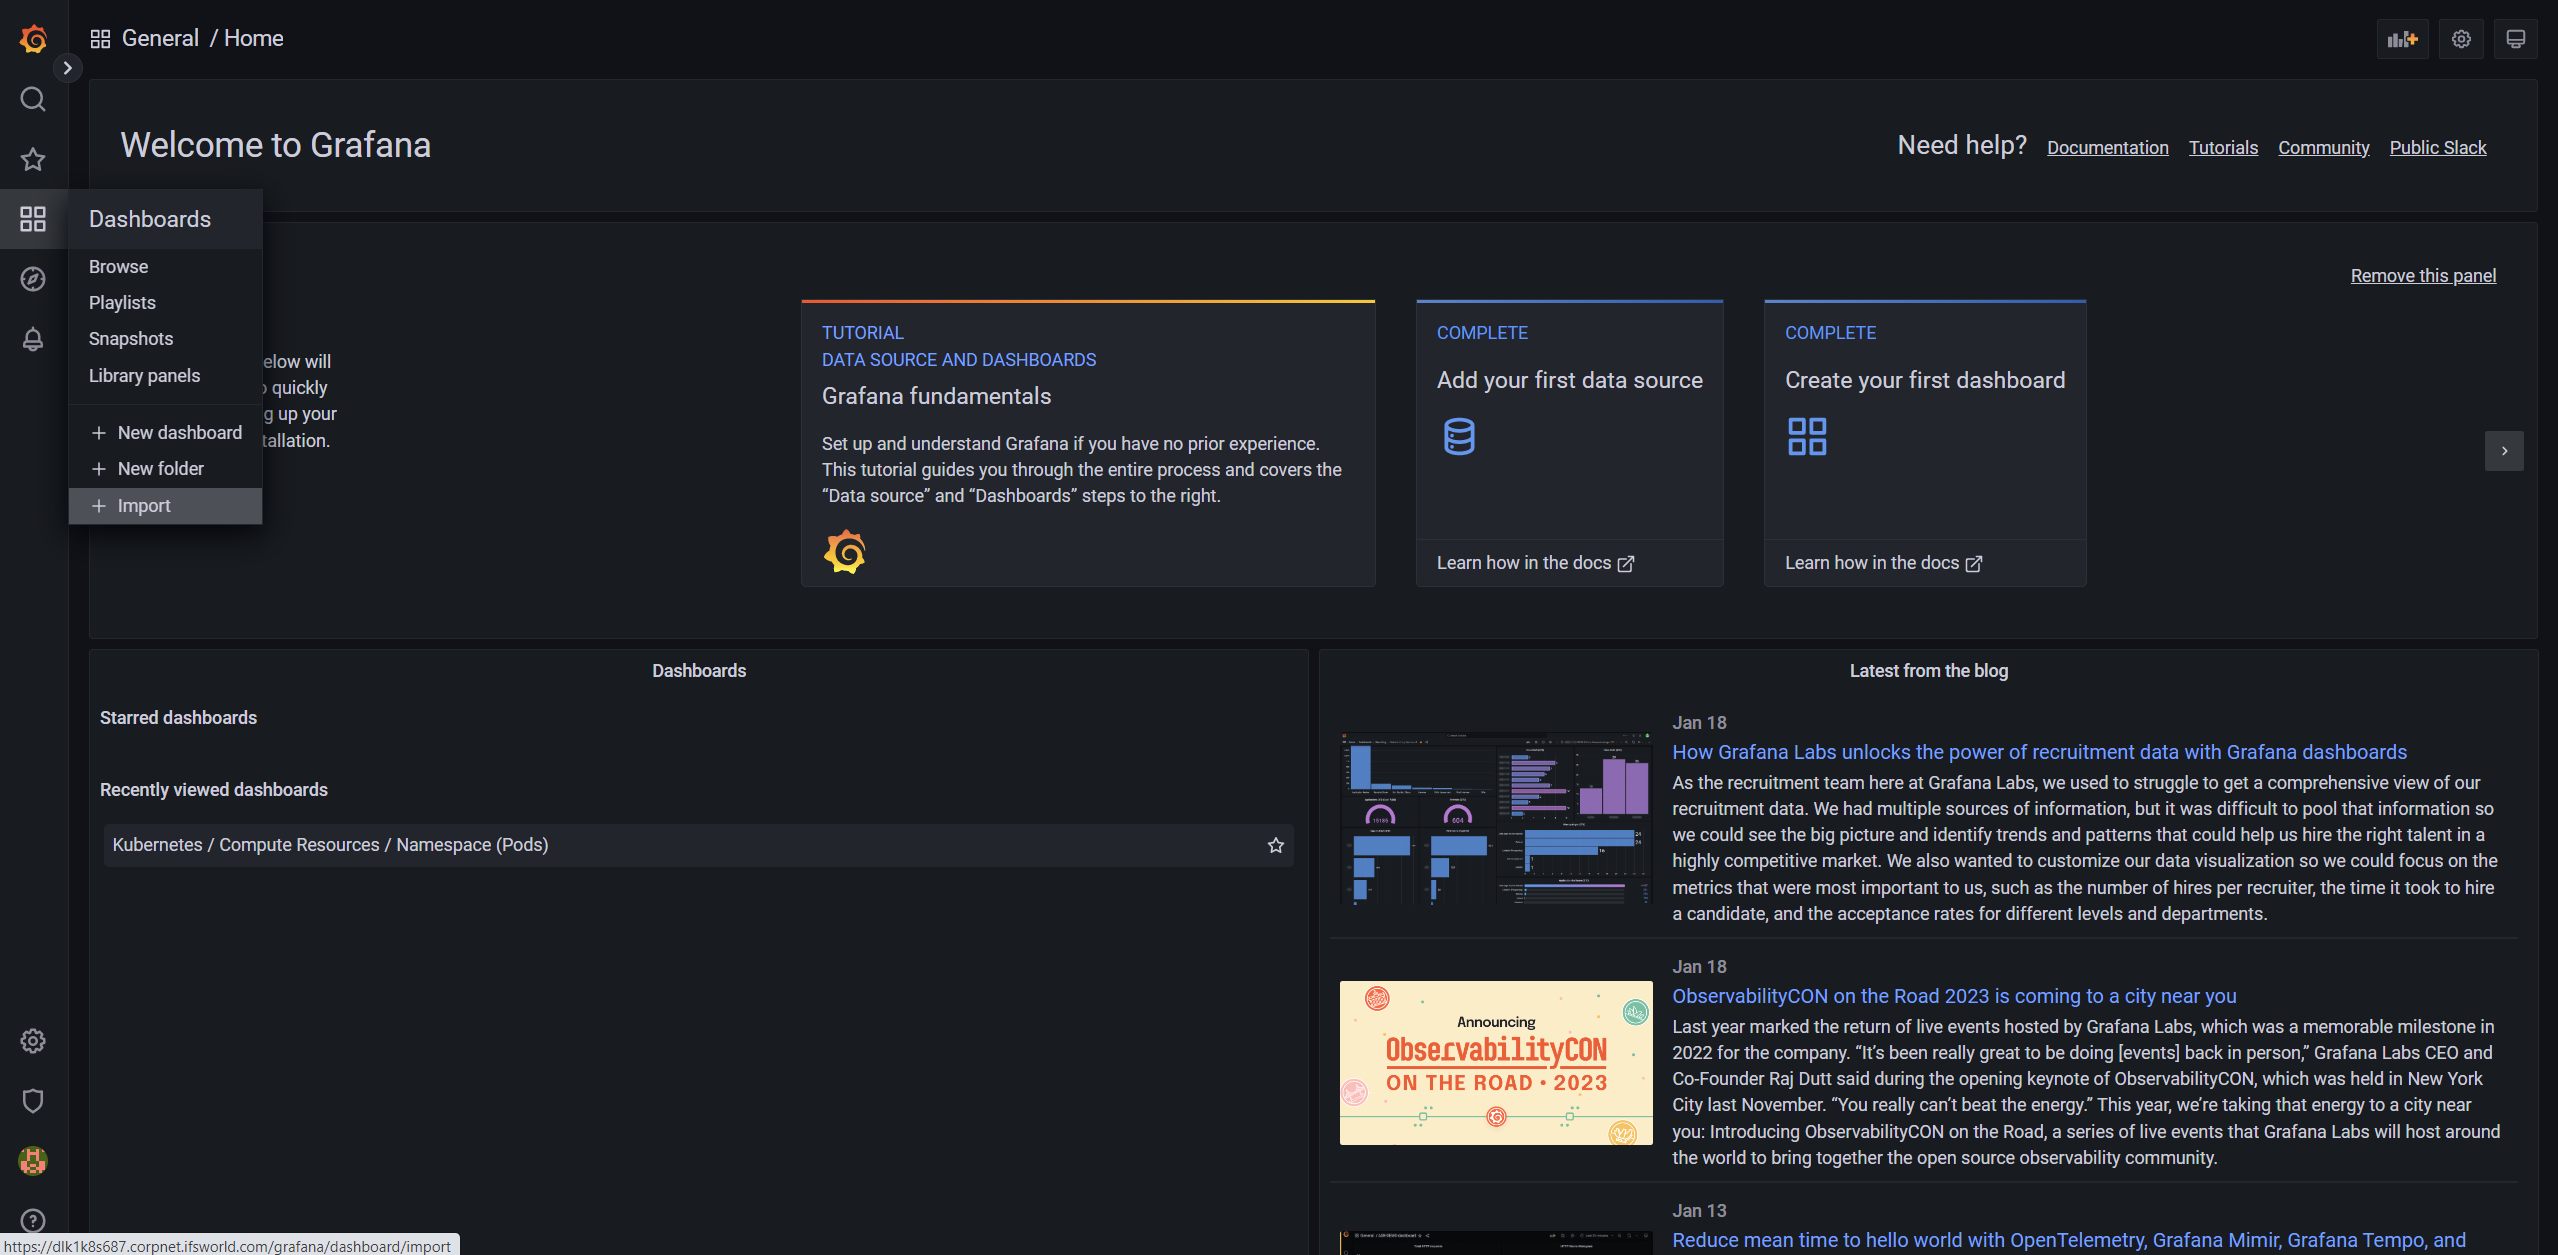
Navigate to + Import from the main menu.

-
Import your JSON code or the JSON file of the relevant location.
-
Navigate to the browse section to view the imported dashboard.
-
View the imported dashboard here.