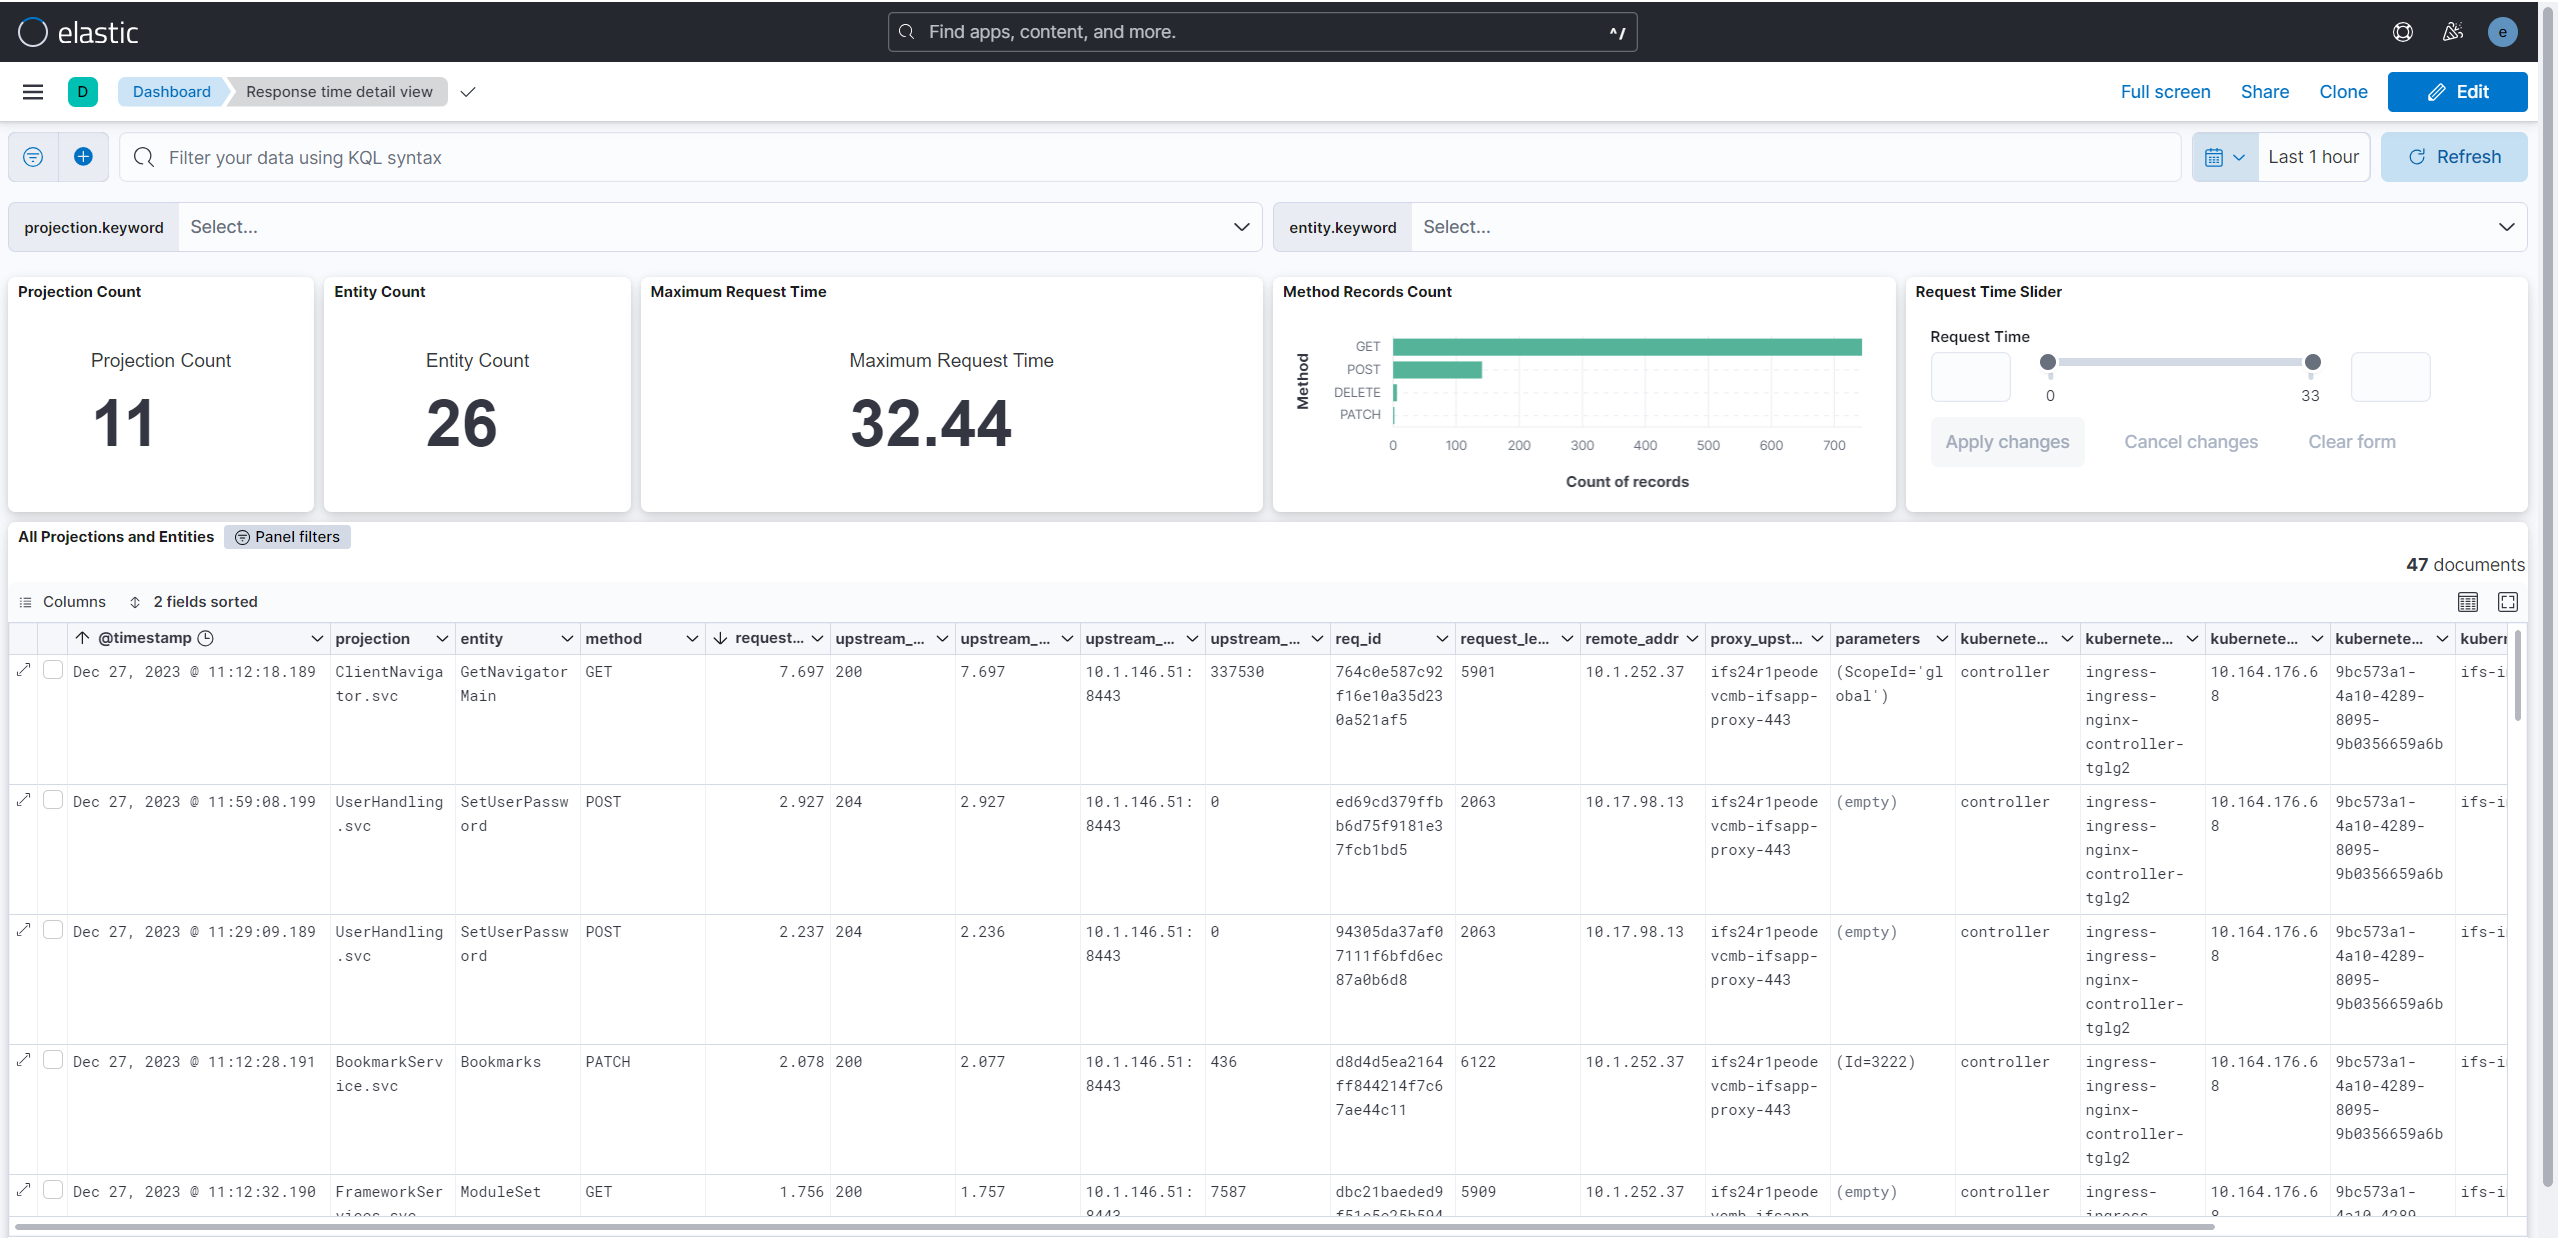
Response Time Detail View Dashboard
This integrated Kibana dashboard allows easy monitoring of projections and entities.
Through improved monitoring capabilities, administrators can optimize IFS Applications for a better end-user experience. As well as diagnose issues or discover usage patterns, together with configurable alerts.
Please refer to the product documentation article "Monitoring Projections and Entities" to learn how to access the new Kibana dashboard and take full advantage of its monitoring capabilities for projections and entities.
Importing the dashboard into Kibana
Refer to the following document to learn all about importing Kibana dashboards: Log Monitoring - how to import kibana dashboards
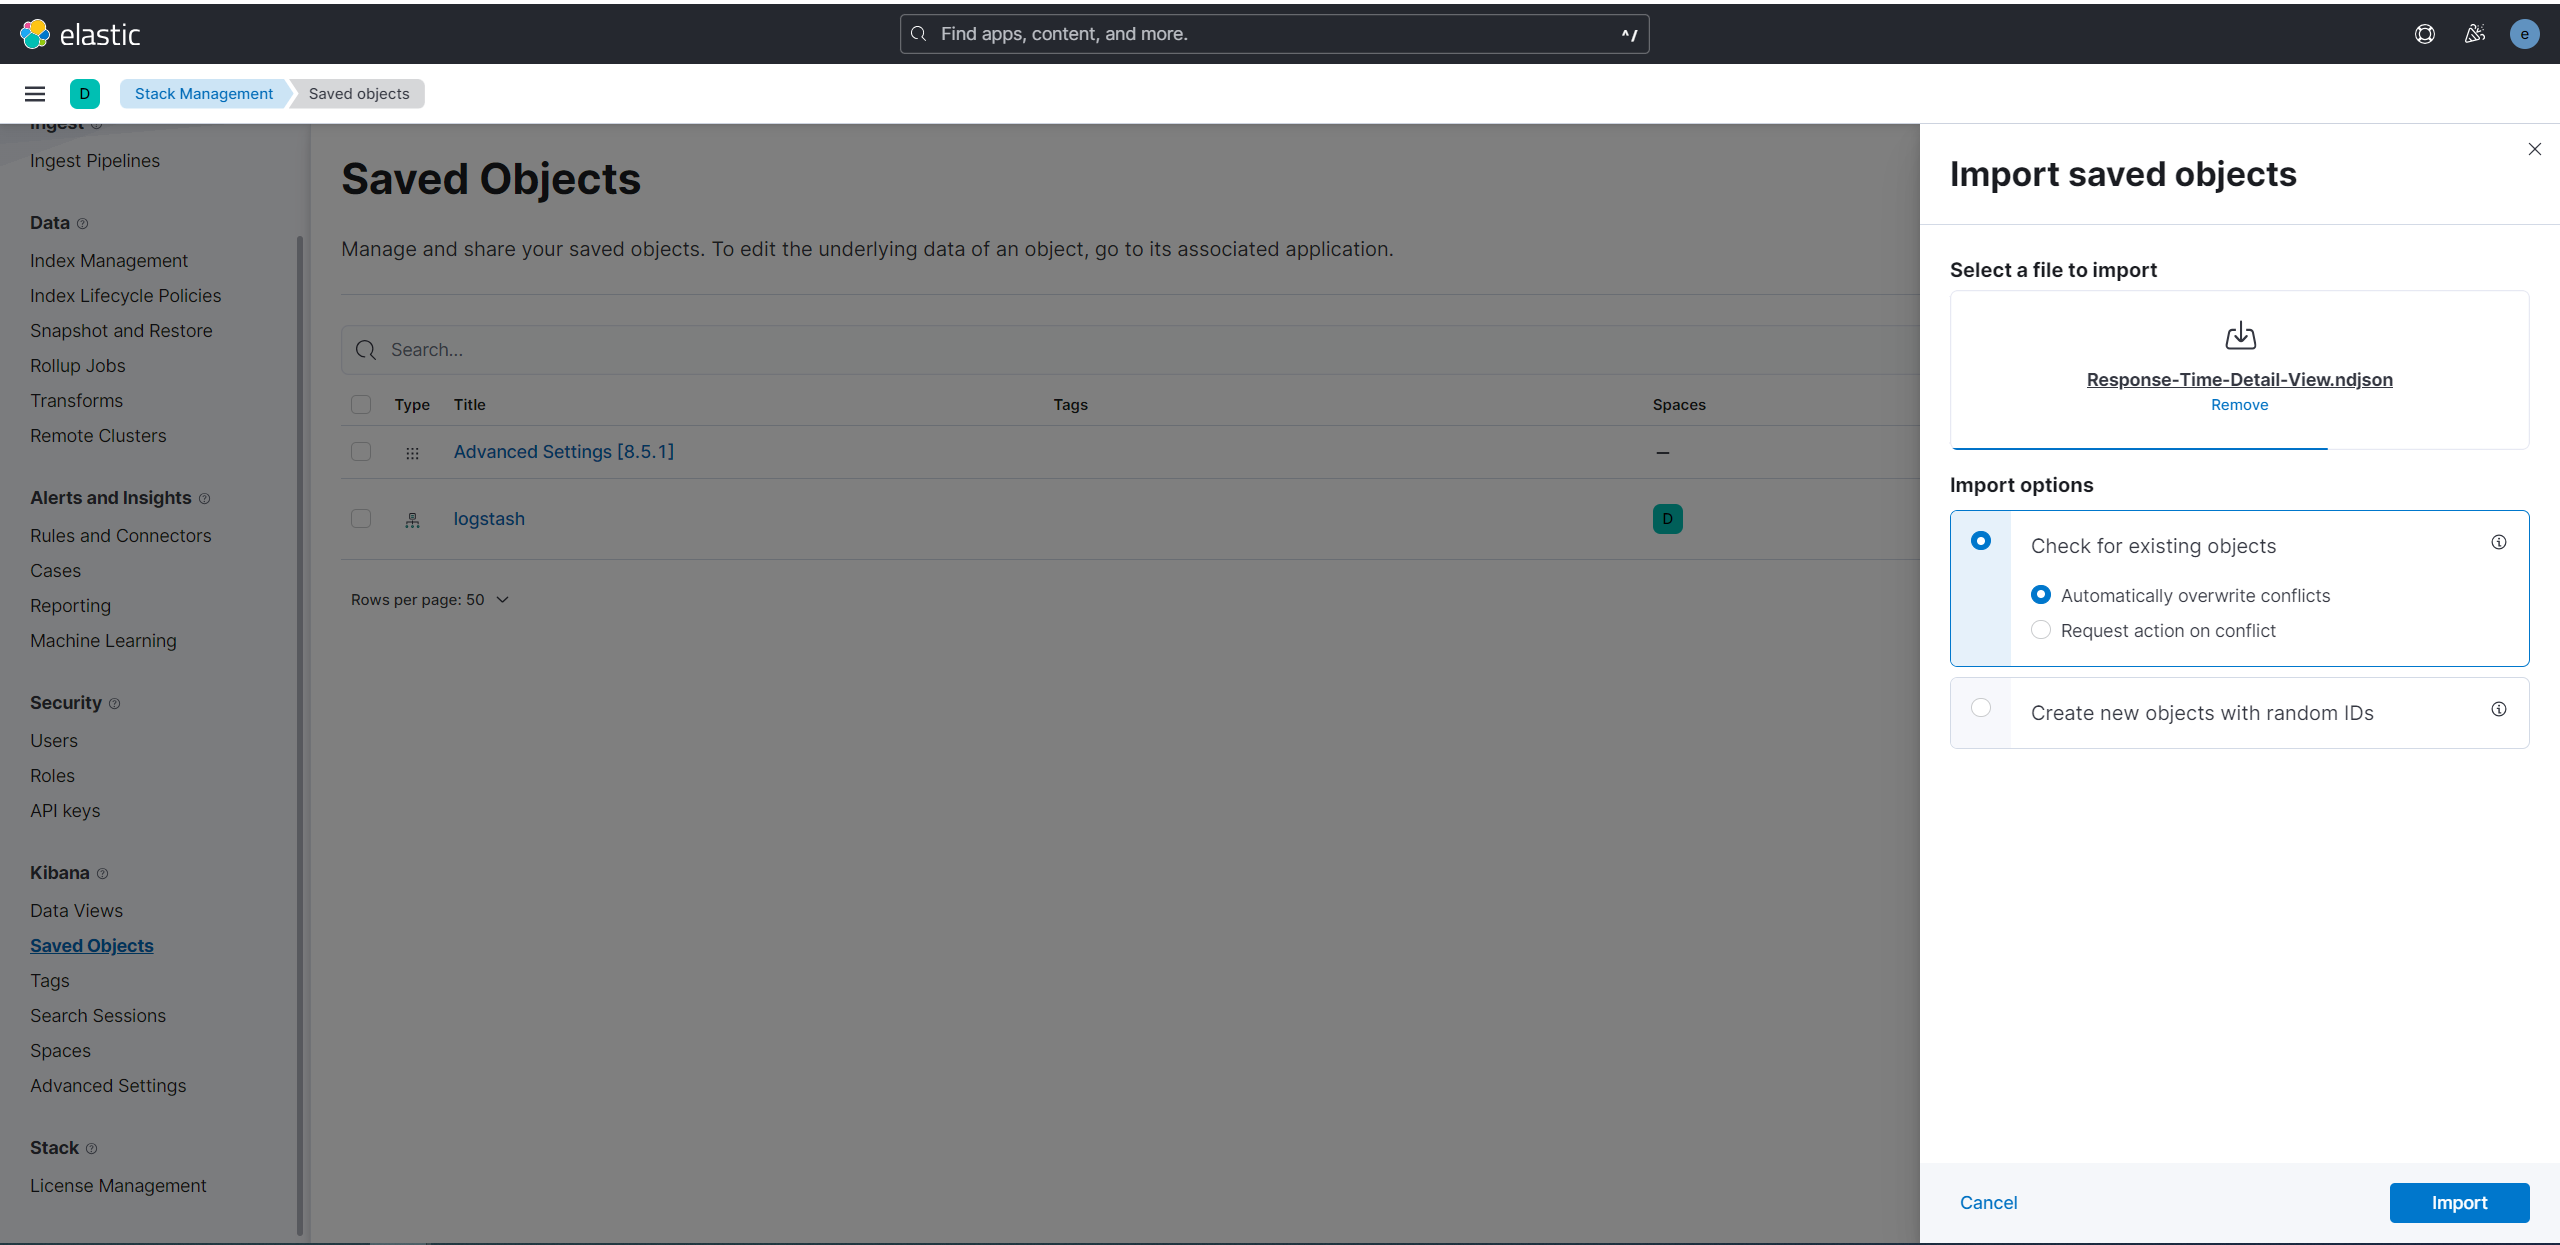
When importing the dashboard, you will need to create a data view if a data view has not already been created. Please refer to the below document for more on how to create index patterns: Log Monitoring - how to create index pattern
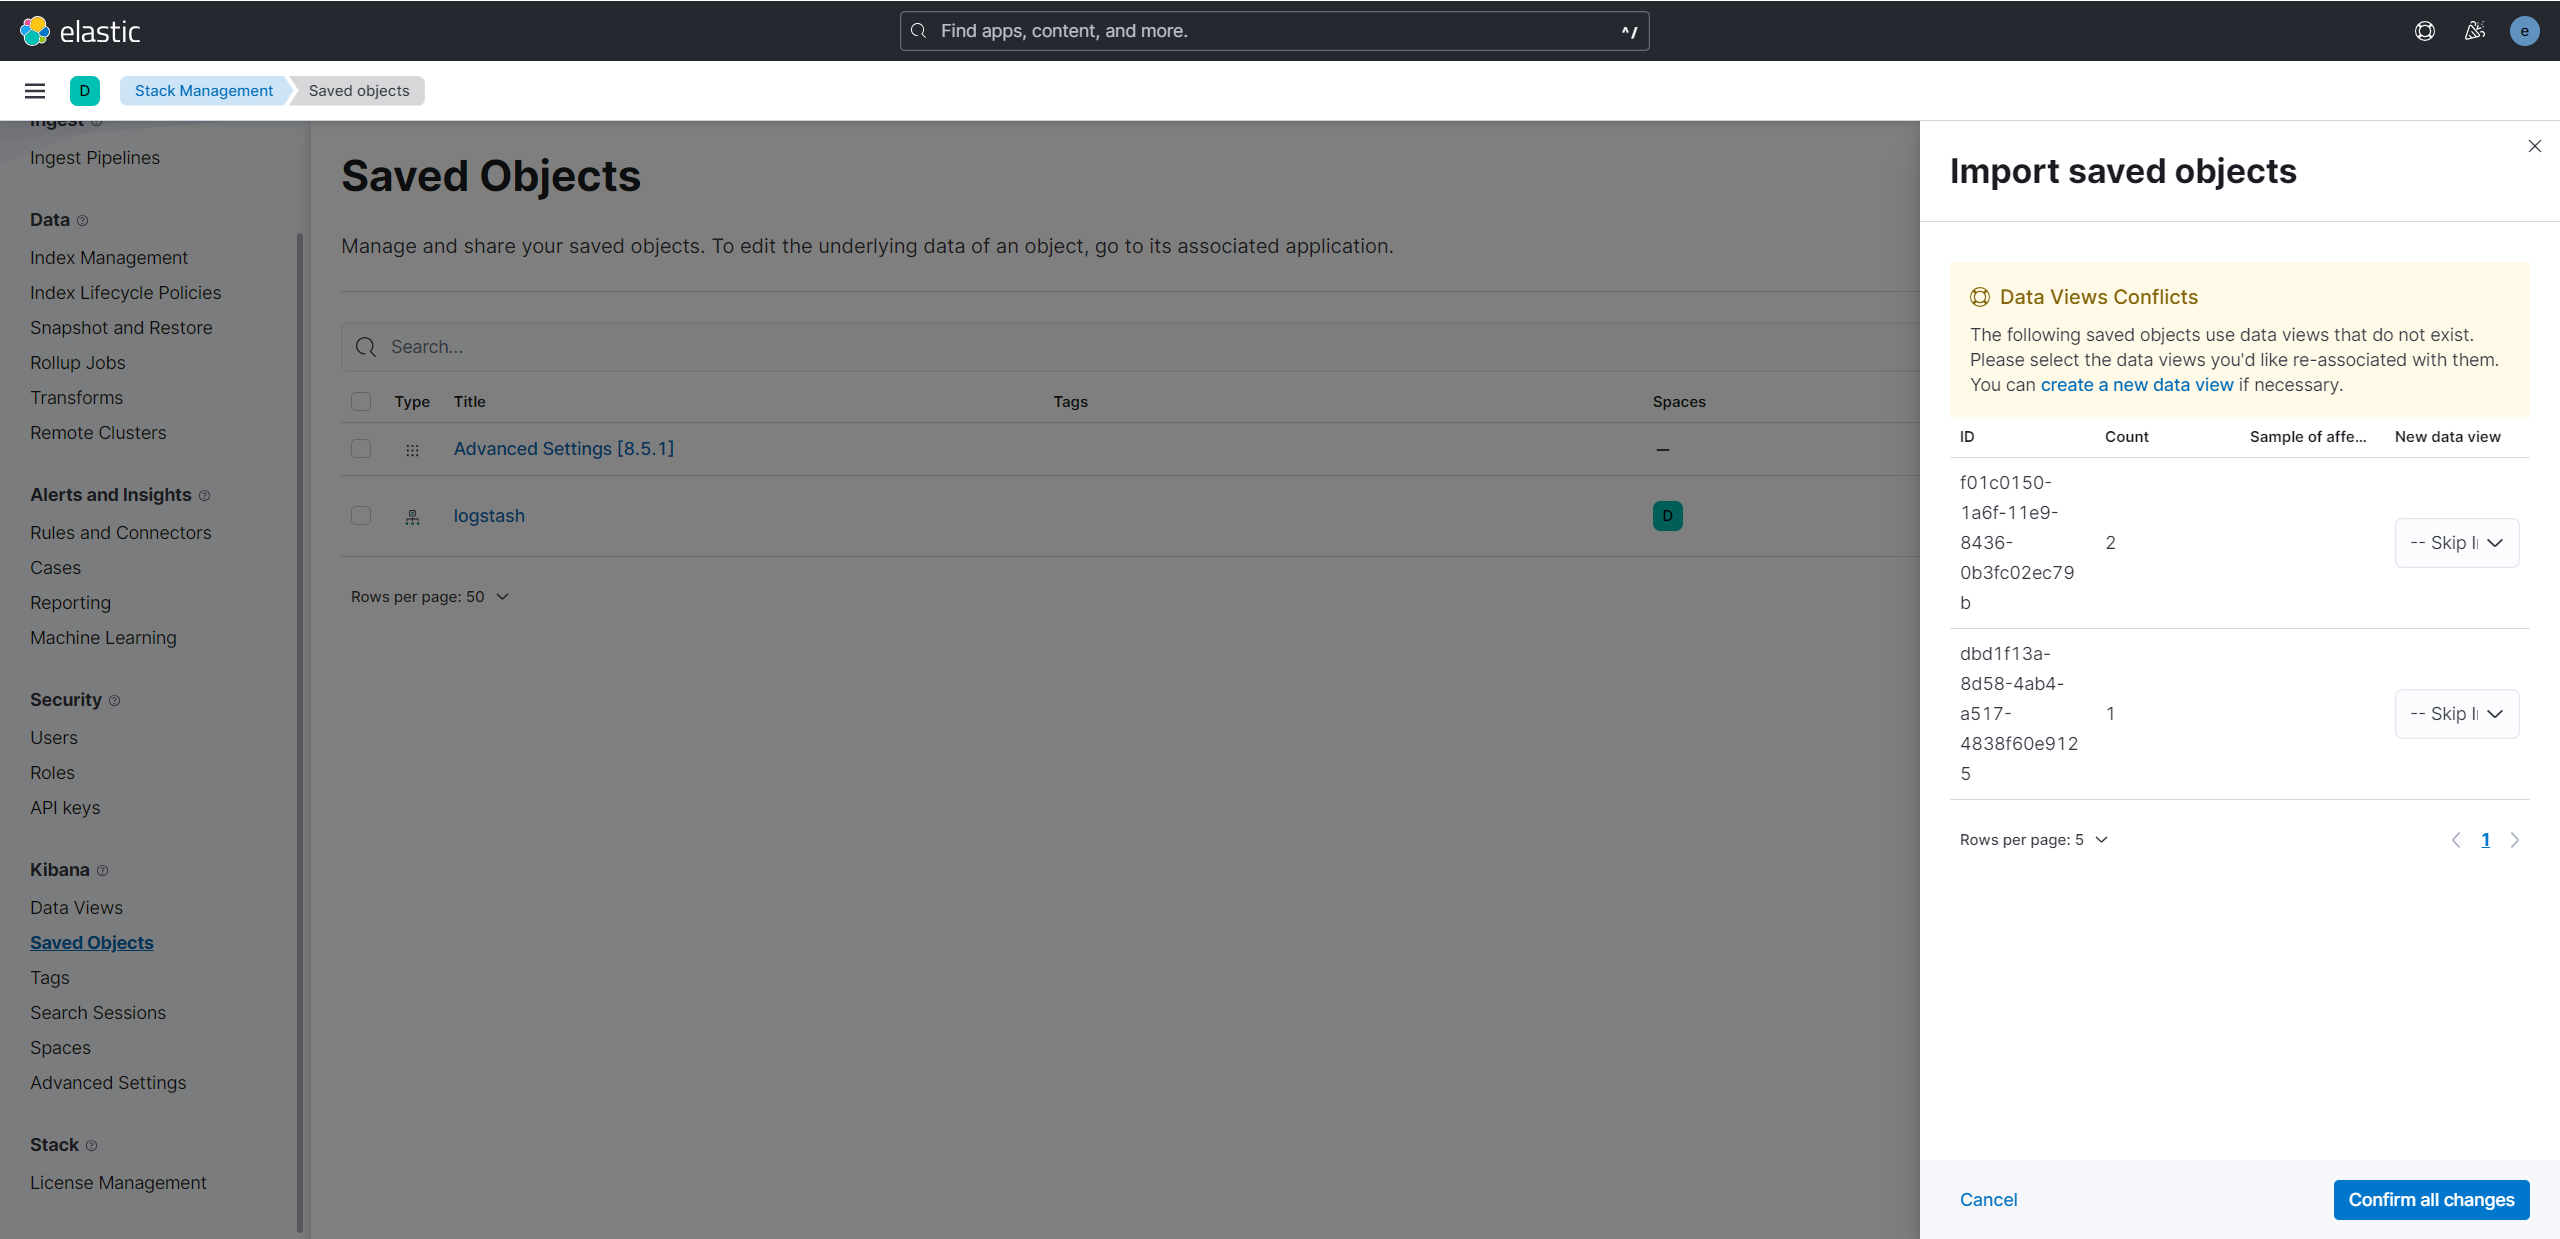
After selecting a data view and confirming all changes, the dashboard will be imported.
Visualizing data in the dashboard
The data will not be visible as soon as the dashboard is imported in a fresh environment or if the application has recently been idle.
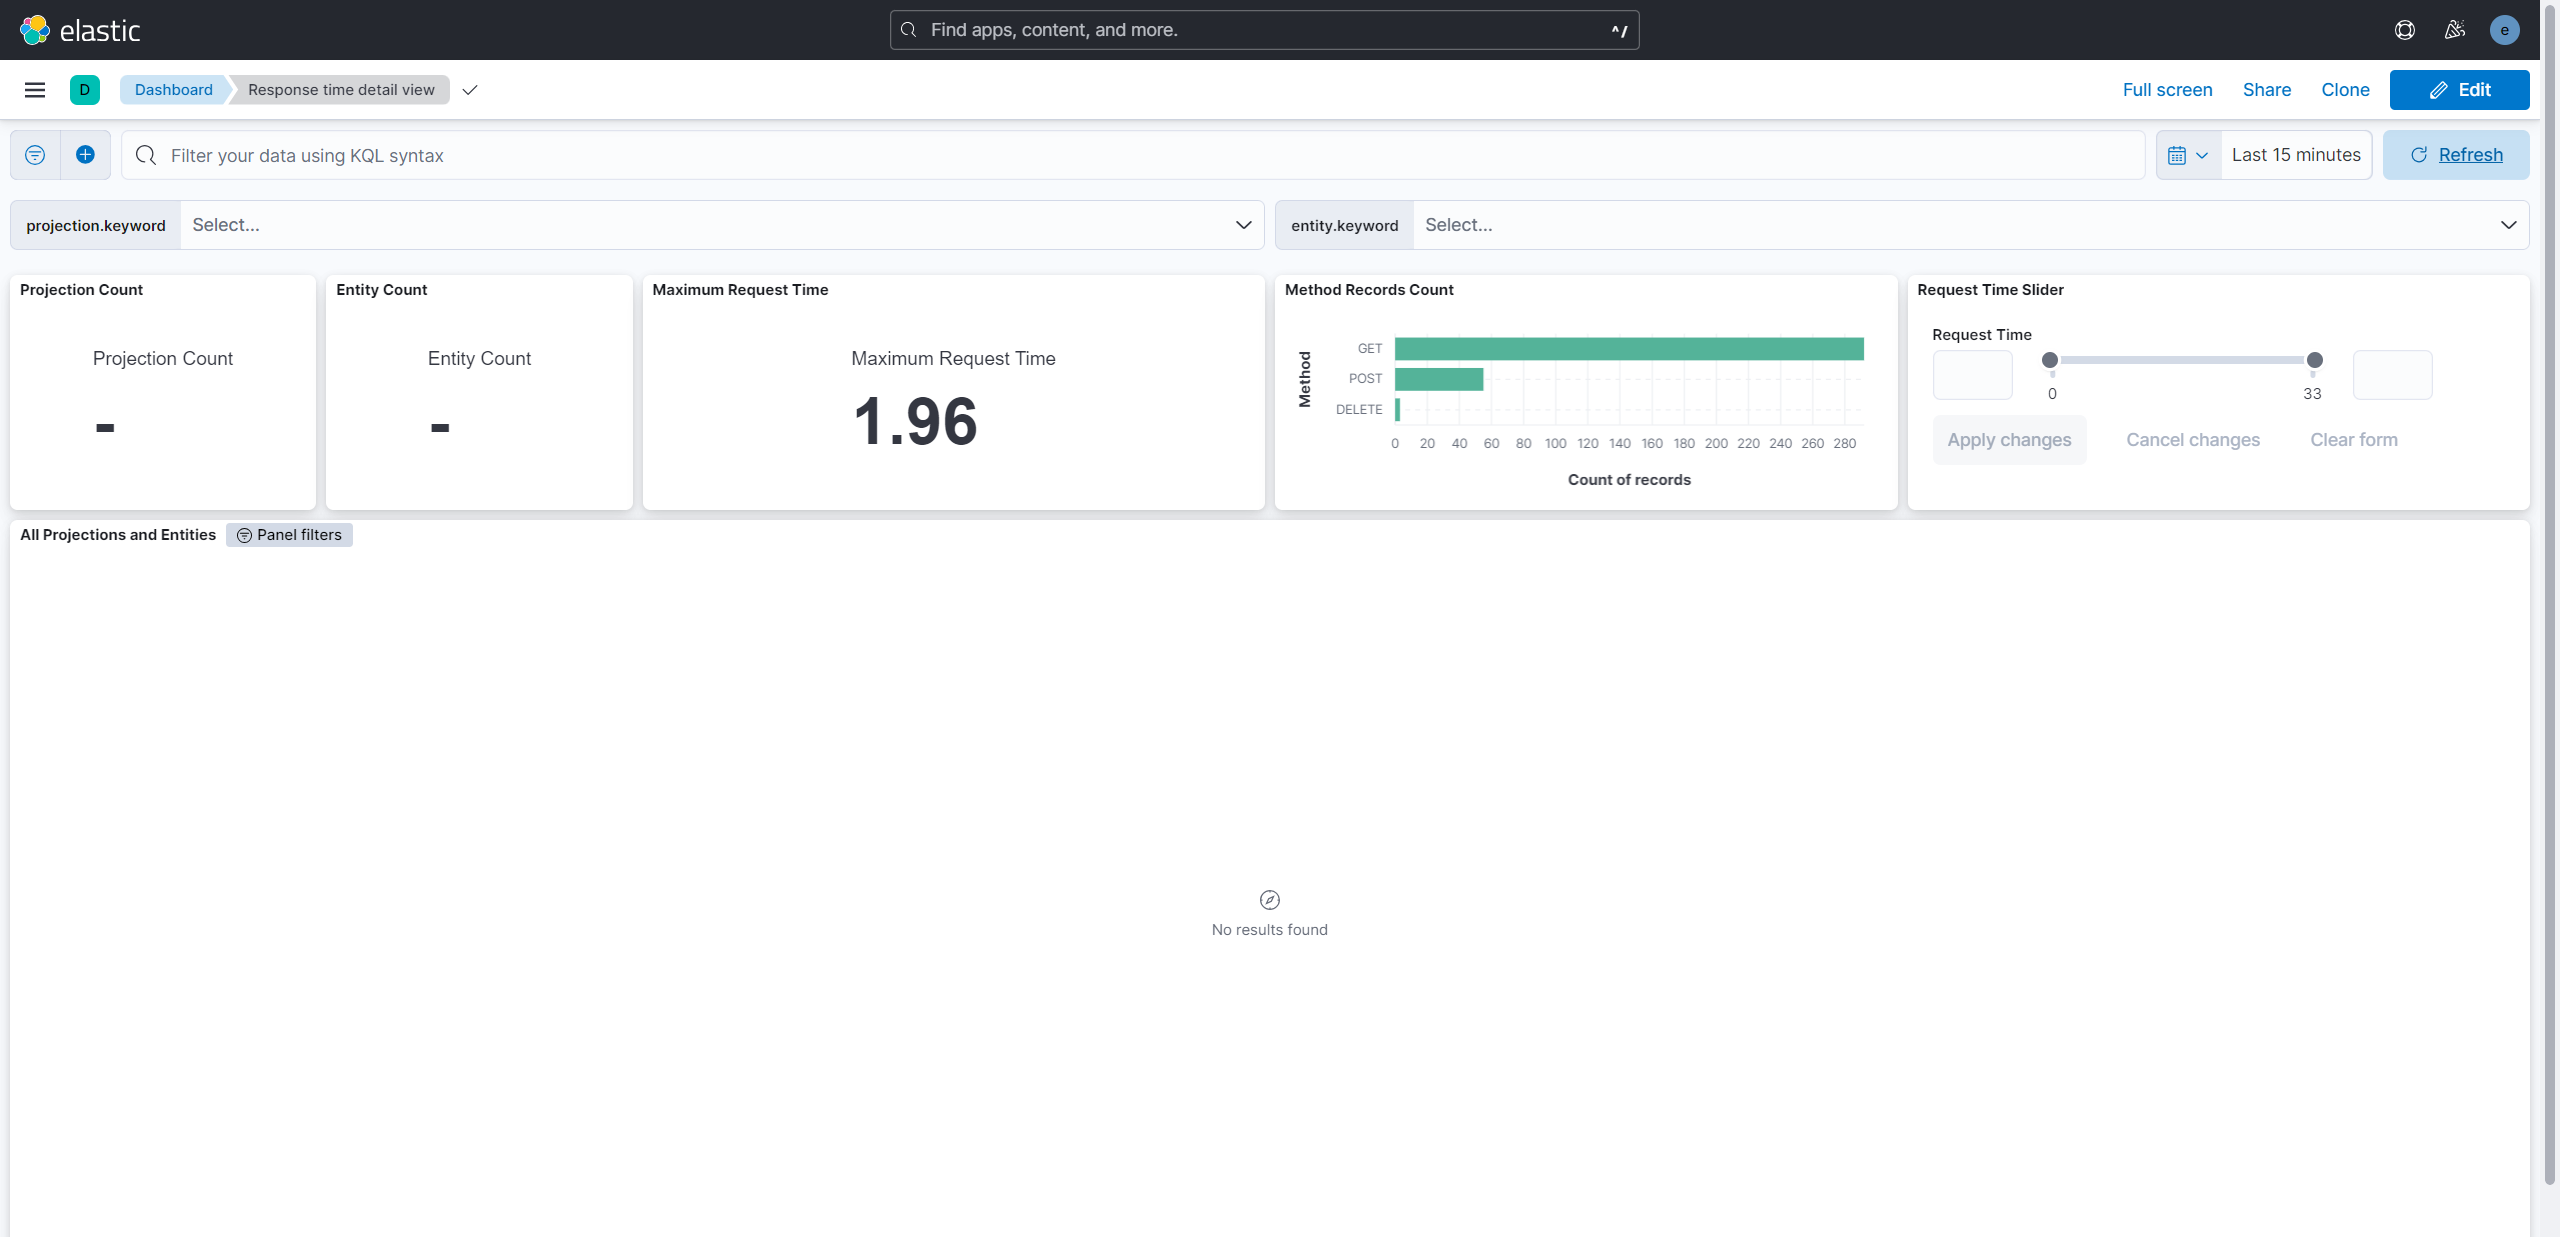
- If you are in an already existing environment, you can change the time range and display the data.
- If you are in a fresh environment, you can do some activities in the application and check back to see the data appearing in the dashboard.
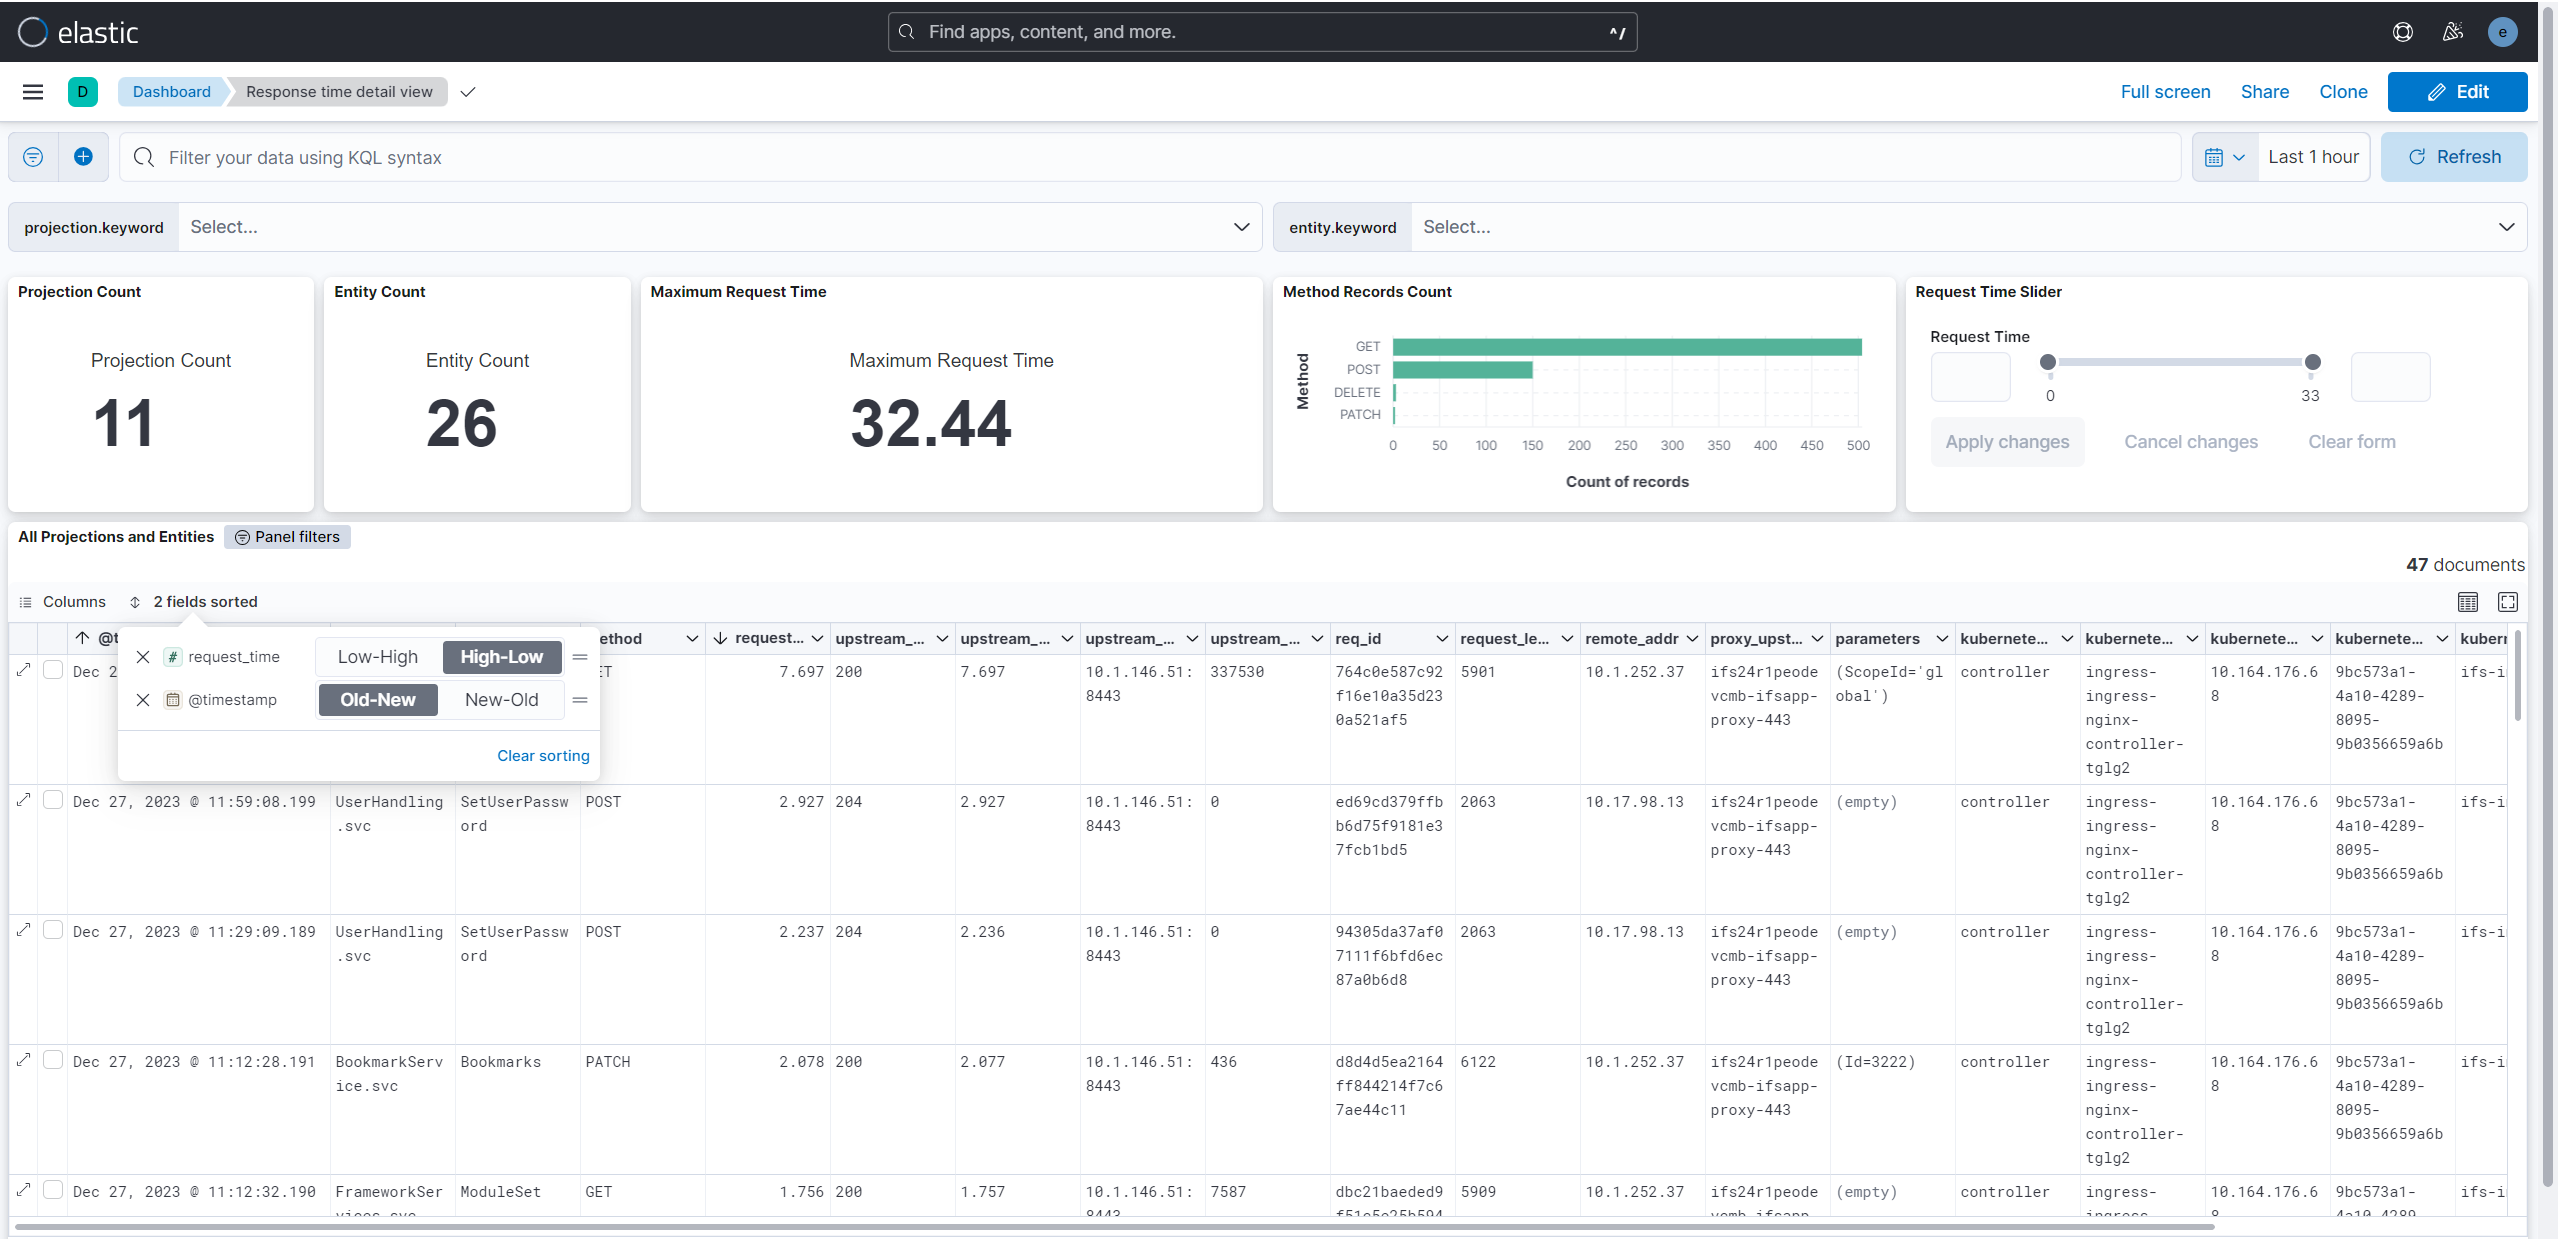
Viewing data in the dashboard
Open this dashboard from the dashboard section in Kibana. Please refer to the below document for more on how to view dashboards: Log Monitoring - how to view dashboards
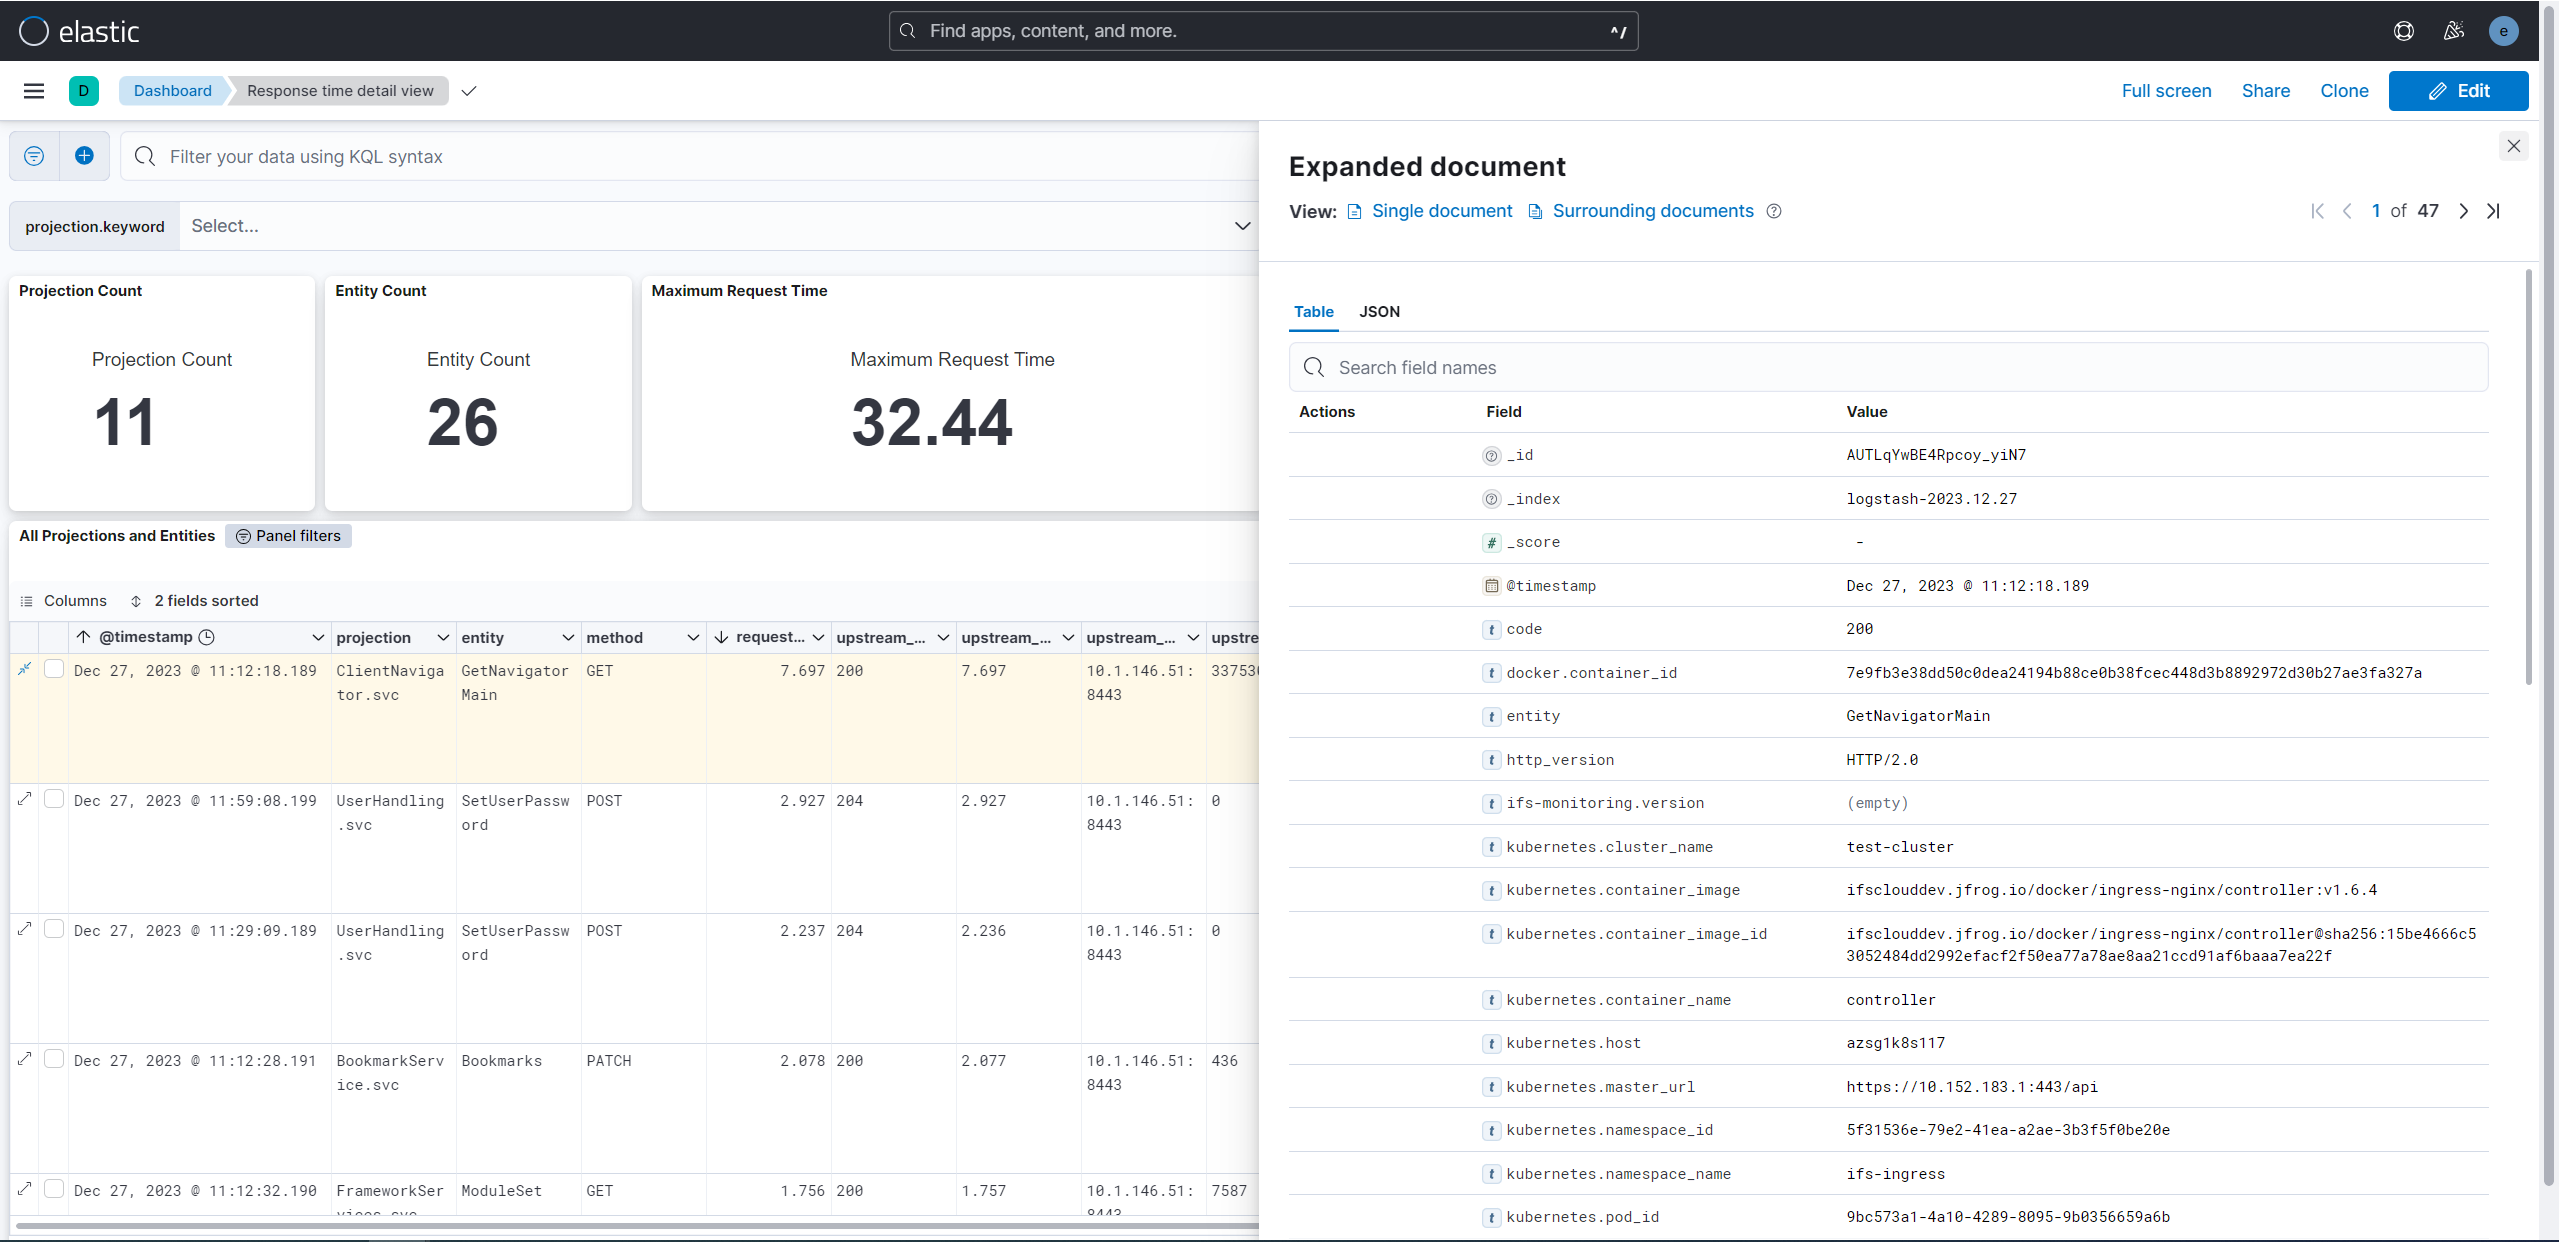
Visualizing a detailed summary of each entity and projection
Click the expand icon in the left corner of the selected data row.
Data Sorting method
The data is sorted according to the highest response time to the lowest response time by default.