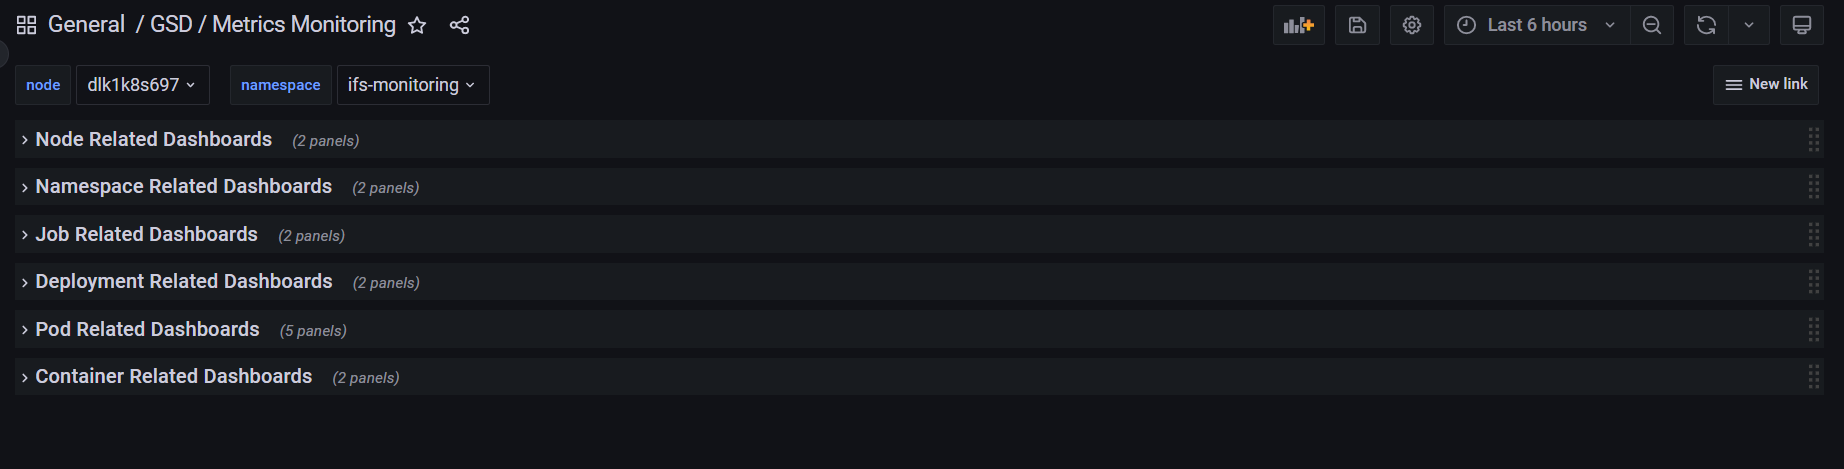
Basic Metrics Monitoring Dashboards
These are a series of basic dashboards in Grafana which provides the main metrics relating to the Application Cluster.
Overview
The metrics provided in this dashboard are separated by panels.
- Node related
- Namespace related
- Job related
- Deployment related
- Pod related
- Container related
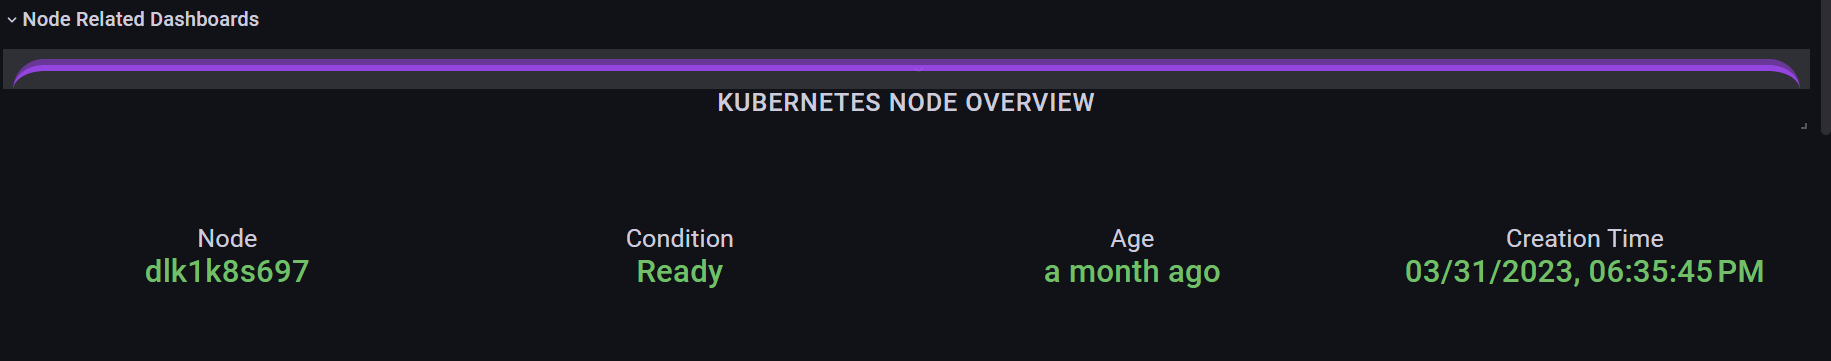
Node Related Dashboard
The node related dashboard displays the node name, node condition, age, and the creation date and time. These are Realtime Node details.
Node conditions
| Condition | Description | Indicator |
|---|---|---|
| Ready | The Ready condition indicates whether the node is ready to accept new Pods. | True - The node is ready and available to schedule and run Pods. |
| DiskPressure | The DiskPressure condition indicates whether the node is under disk pressure. | True - The node is running low on available disk space. |
| MemoryPressure | The MemoryPressure condition indicates whether the node is under memory pressure. | True - The node is running low on available memory. |
| PIDPressure | The PIDPressure condition indicates whether the node is under pressure due to a shortage of process IDs (PIDs). | True - The node has exhausted its available PIDs. |
| NetworkUnavailable | The NetworkUnavailable condition indicates whether the node's network is unavailable. | True - The node is unable to communicate over the network. |
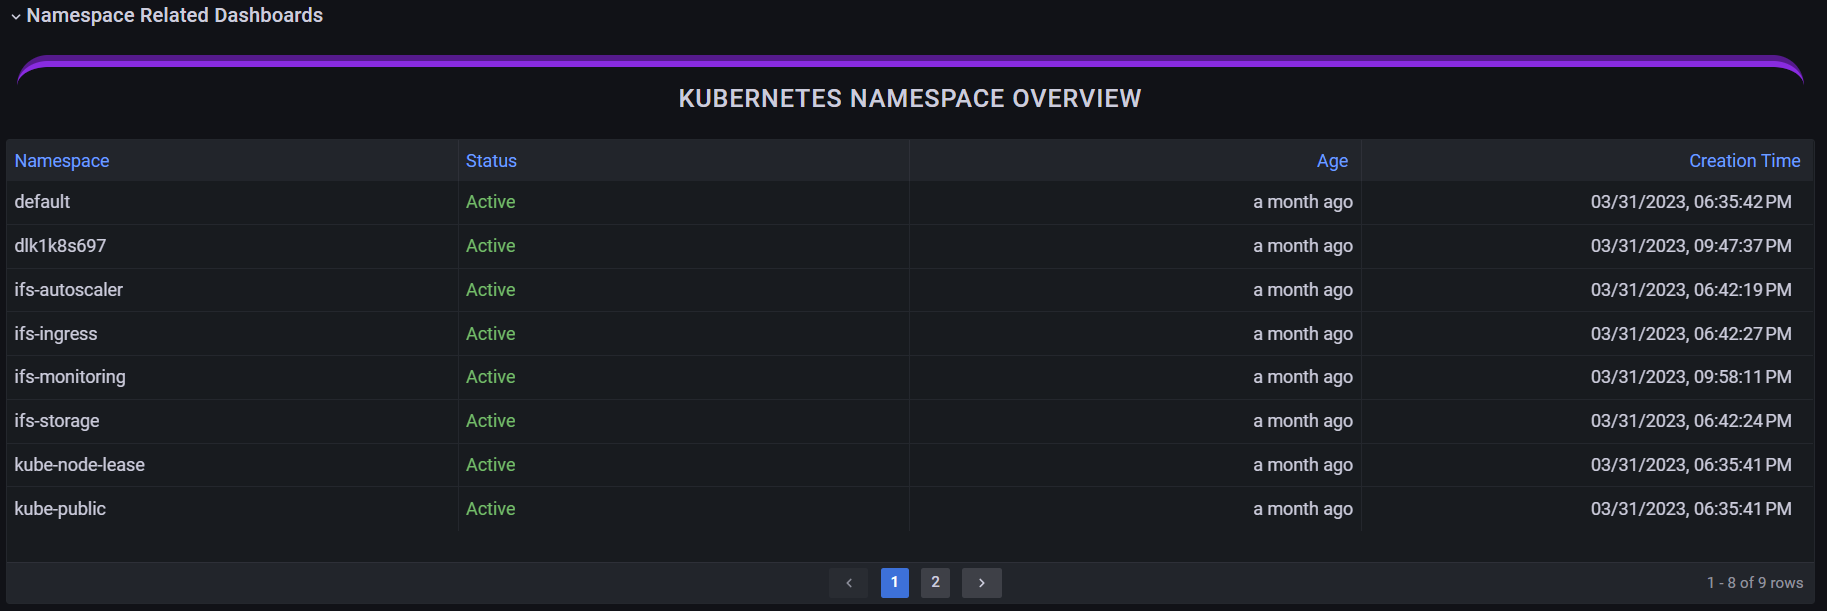
Namespace Related Dashboard
The namespace related dashboard displays Namespaces with their status, age, and creation time.
NOTE: default, kube-node-lease, kube-public, and kube-system are the default namespaces that exist in Kubernetes.
Namespaces status
| Status | Description |
|---|---|
| Active | The namespace is in use. |
| Terminating | The namespace is being deleted and can not be used for new objects. |
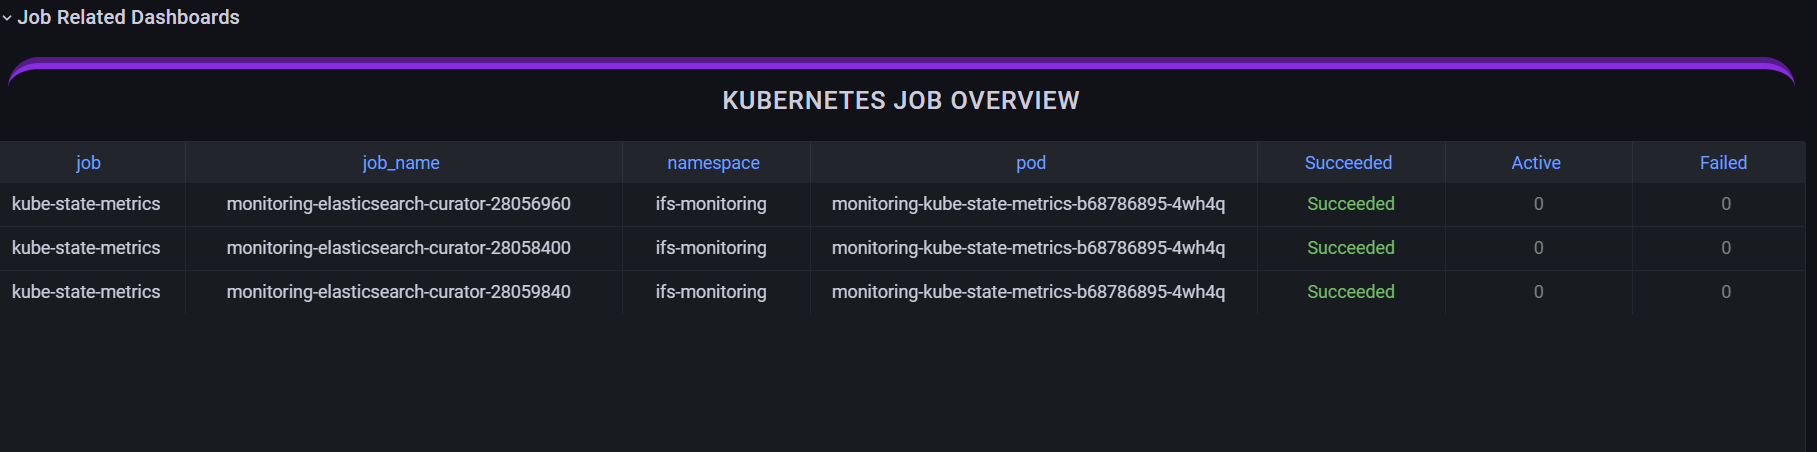
Job Related Dashboard
The job related dashboard displays jobs related to namespaces including their statuses (Succeeded, Active, or Failed) and their respective pod names.
Job Status
| Status | Description |
|---|---|
| Succeeded | The Succeeded status signifies that the Job has been completed successfully. It indicates that all the Pods associated with the Job have finished their execution without any errors. The Job has achieved its desired outcome. |
| Active | The Active status indicates that the Job is currently running and has active Pods associated with it. It represents the number of Pods that are actively executing the task defined by the Job. |
| Failed | The Failed status indicates that the Job has been completed, but one or more Pods associated with it have failed to execute successfully. It typically occurs when a Pod encounters an error or exits with a non-zero exit code. The Job has not achieved its desired outcome. |
Deployments Related Dashboard
The deployment related dashboard shows deployments related to namespaces along with their condition and status.
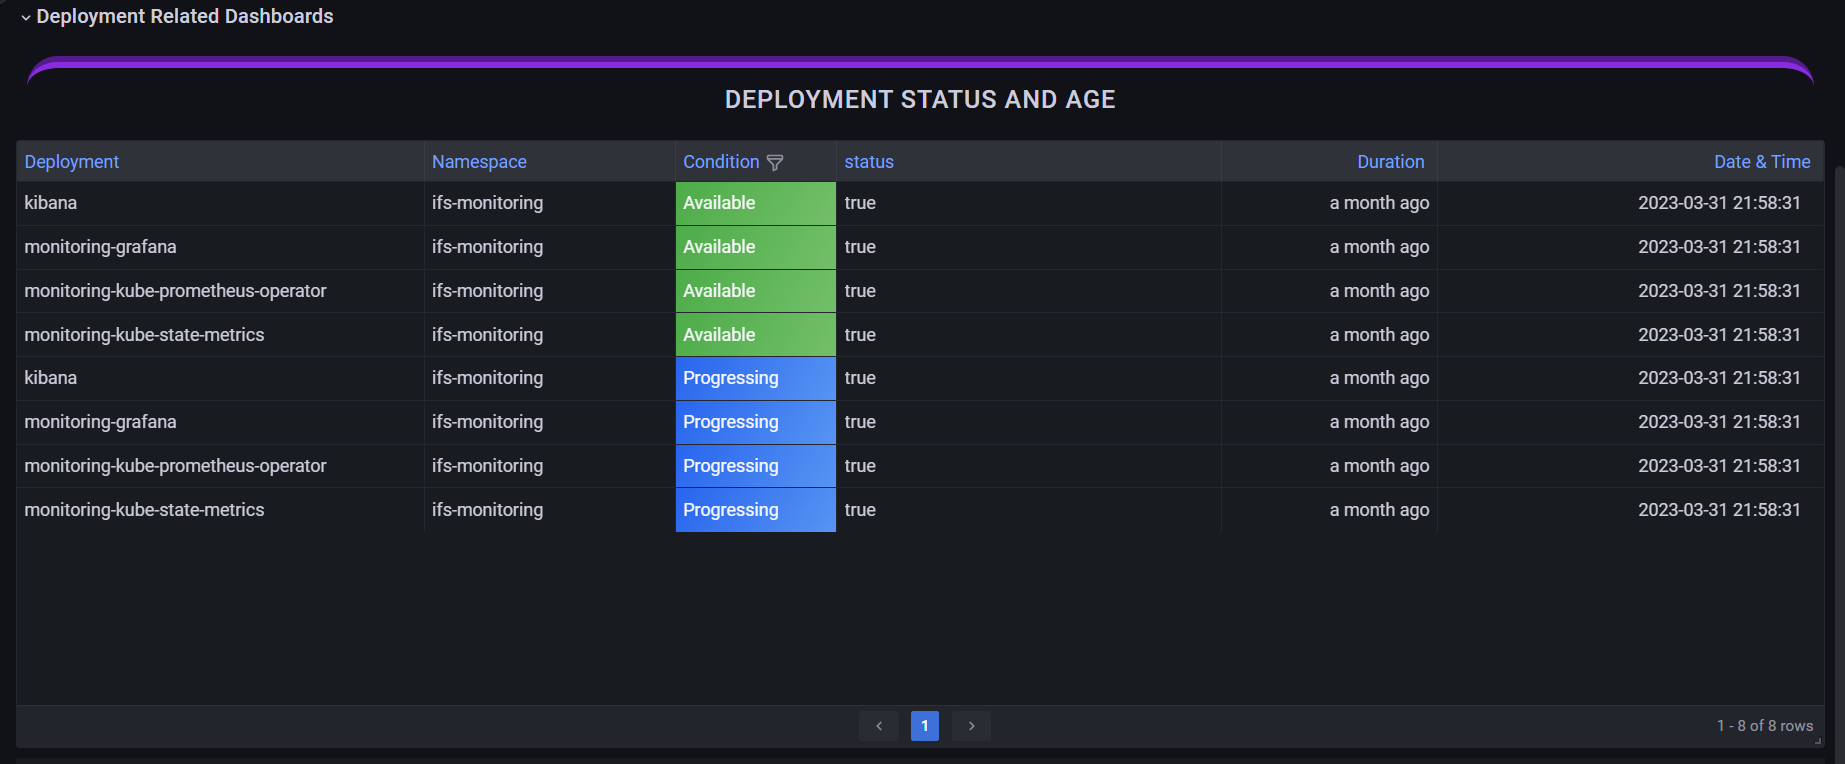
| Condition | Description | True/False Behavior |
|---|---|---|
| Available | This condition indicates whether the desired number of replicas specified in the Deployment is available and ready. It ensures that the Pods are running, have passed their readiness probes (if defined), and are in a healthy state. | True - The Deployment is serving traffic as expected. |
| Progressing | The Progressing condition indicates the overall progress of a Deployment's rollout. It shows whether the Deployment is actively updating or scaling its Pods. | True - The Deployment is still making progress towards the desired state. |
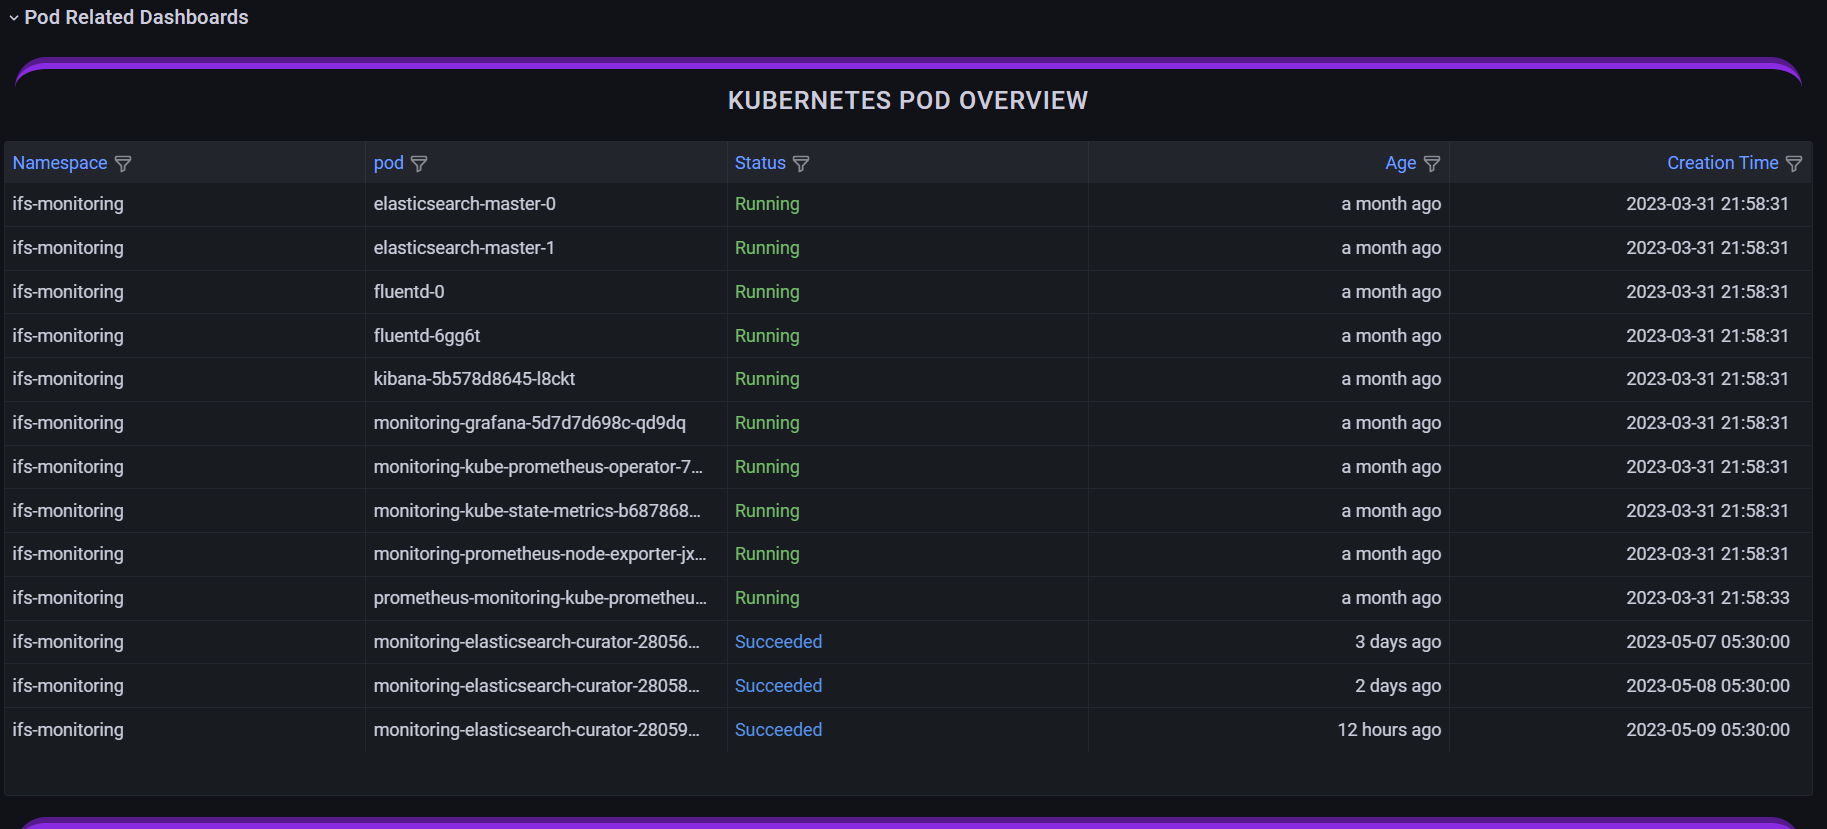
Pod Related Dashboard
The Pod related dashboard displays the deployments relative to the namespaces along with their status and age.
| Status | Description |
|---|---|
| Pending | The Pod has been accepted by the Kubernetes cluster, but one or more of the containers has not been set up and made ready to run. This includes the time a Pod spends waiting to be scheduled, as well as the time spent downloading container images over the network. |
| Running | The Pod has been bound to a node, and all of the containers have been created. At least one container is still running or is in the process of starting or restarting. |
| Succeed | All containers in the Pod have terminated in success, and will not be restarted. |
| Failed | All containers in the Pod have terminated, and at least one container has terminated in failure. That is, the container either exited with non-zero status or was terminated by the system. |
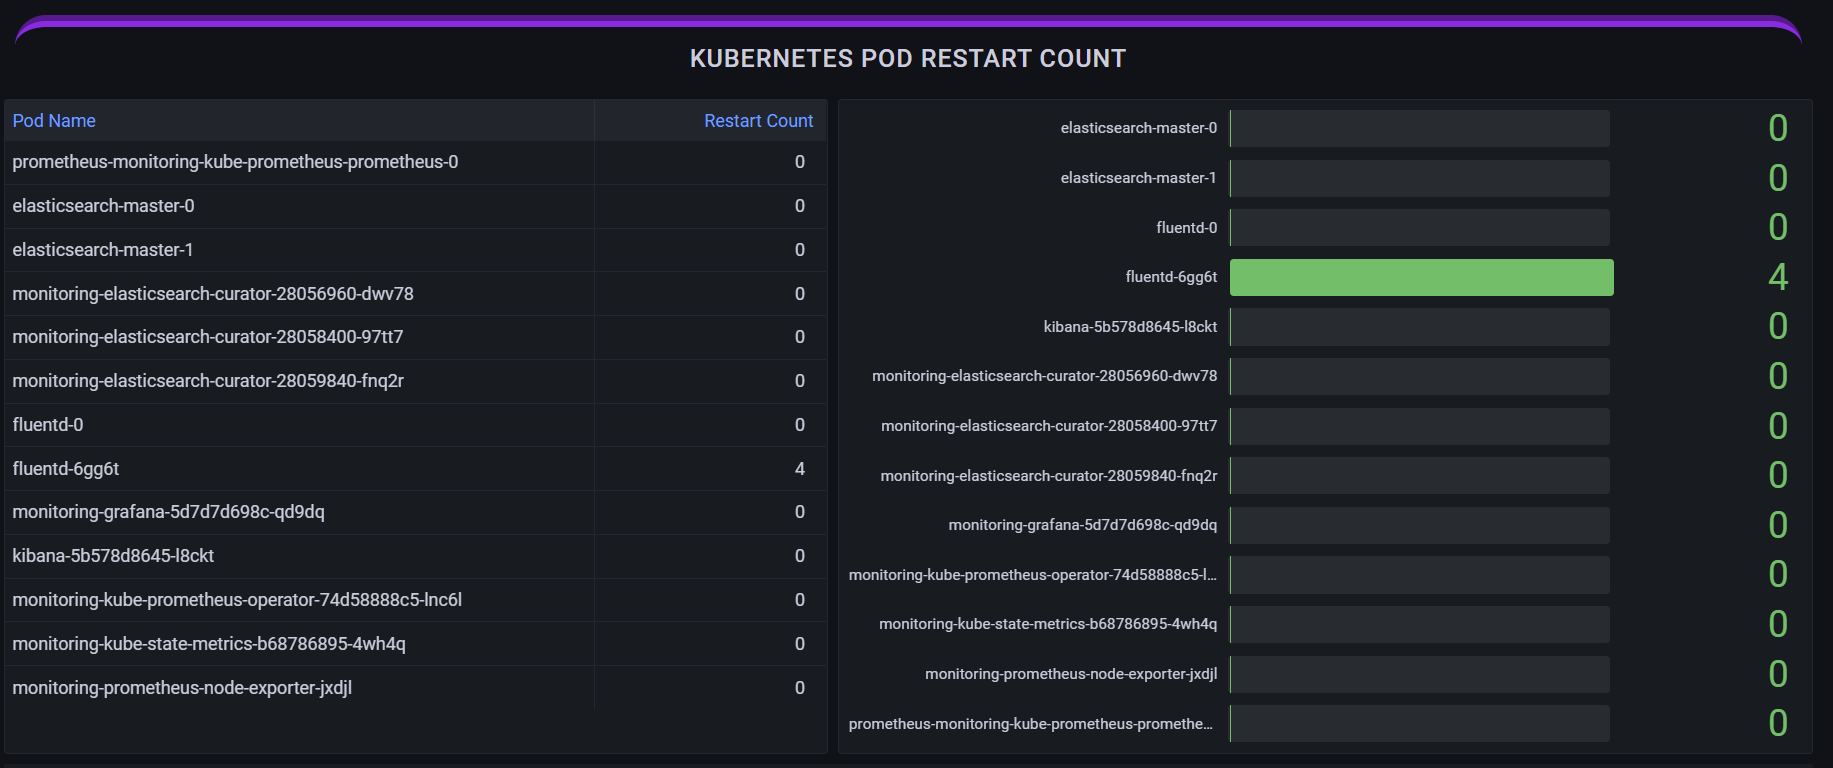
The below dashboard shows the pod restart counts both numerically and visually:
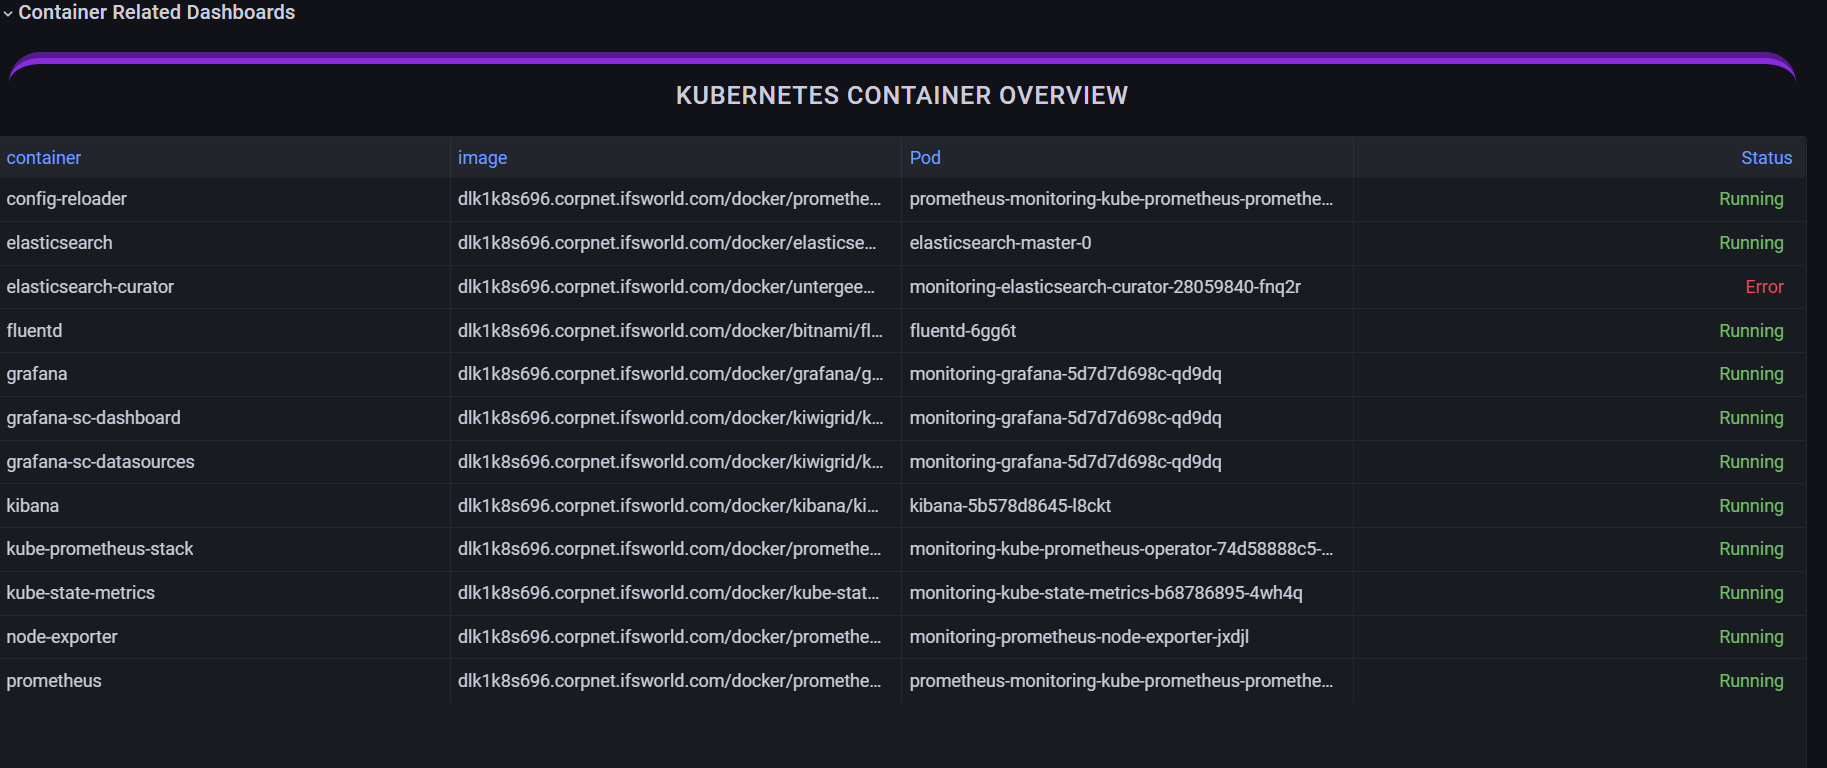
Container Related Dashboard
The container related dashboard displays container details with the Docker image, their pod name, and the container's real-time status.
| Status | Description |
|---|---|
| Error | The error status indicates that the container encountered an issue during its execution. It could be due to application errors, resource constraints, or other factors that caused the container to fail. |
| Running | The running status indicates that the container is up and running successfully within a pod. It indicates that the container has started and is actively executing its defined workload. |
| Terminated | The terminated status signifies that the container has stopped running. This status can occur for various reasons, such as the application completing its execution, an error or crash within the container, or manual termination. |
| Completed | The completed status specifically applies to containers that are run to completion, such as one-time batch jobs or tasks. It indicates that the container has finished executing successfully and has exited. |