Debugging
- Error Reporting in IFS Cloud Web
- Client error dialog
- Logger in IFS Cloud Web
- Trace support
- Developer Tools
- Network tab
- Console tab
- Device testing mode
- IFS Cloud Web Devtools
- Setup the extension
- Linking IFS Cloud Web DevTool
- Access IFS Cloud Web Devtool
- Components in IFS Cloud Web DevTool
- Additional Tools - POSTMAN
Error Reporting in IFS Cloud Web
Client error dialog
If you encounter a bug while running the IFS Cloud Web client you will most likely will be presented with the Client-error dialog. The dialog is shown to let the user know that the client has ended up in a state from which further execution of commands cannot be guaranteed to have a stable and predicted outcome.
This dialog is shown even for minor errors that may not have any big impact on the user experience, but because of the environment in which the client is running it is hard for the framework to know for sure which components and areas in the client that have been affected by the bug.
The dialog presents you with a couple of options. You may click on the “Report” command and this expands the dialog to show more information about the error. This also provides the facility to copy the error log in to clipboard, so that when reporting the bug, this log message can be included.
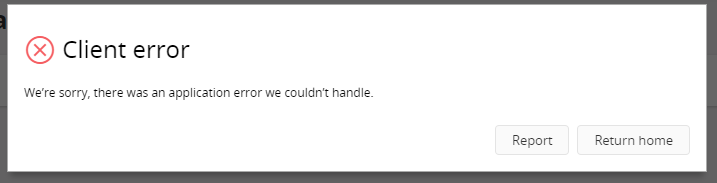
Figure 1 - Client Error dialog
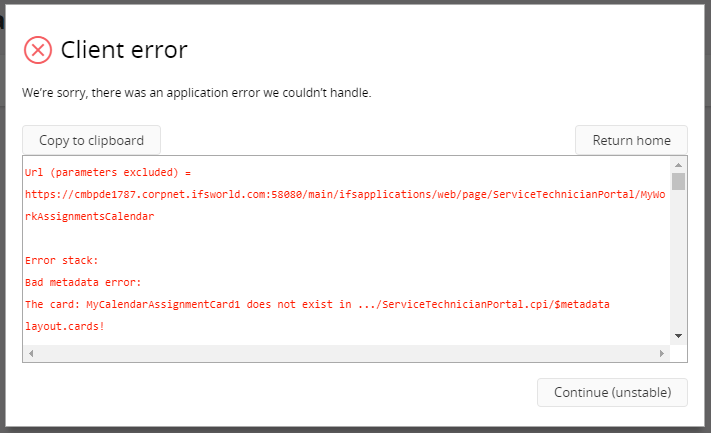
Figure 2 - Client Error dialog displaying the error report
The other option this dialog provides is to either “Return Home” if it is no longer possible to continue with the flow or “Continue (Unstable)” which allows you to continue working with the flow if the error is a minor issue.
Server errors
This type of errors will be displayed when there is an error occurring in the server side. There are two types of server errors:
- Application errors - Application errors are always shown in toast messages and never in the server dialog.
- Server errors - Server errors can be shown either as toasts or in the server error dialog.
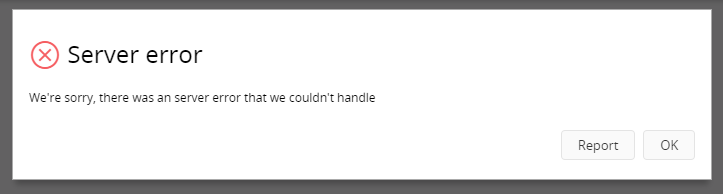
Figure 3- Server Error dialog
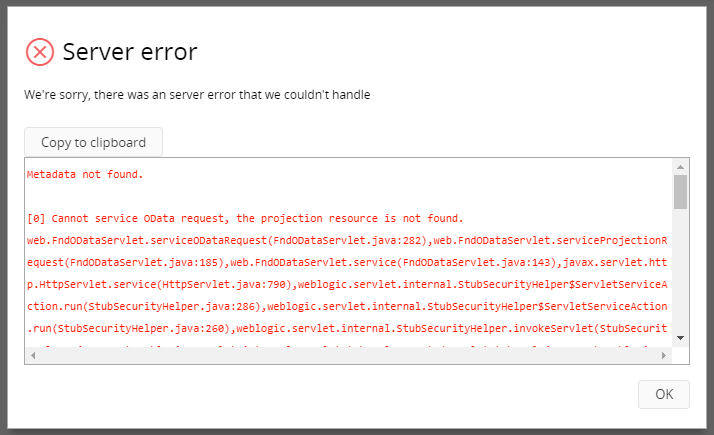
Figure 4 - Server Error dialog displaying the error report
Database Tracing Support
It is possible to view the trace data in the response by adding odata-debug=json parameter to the request URL of the entityset.
For example:
https://EnvironmentId.corpnet.ifsworld.com:58080/main/ifsapplications/projection/v1/ProjectionName.svc/EntitysetName?$skip=0&$top=25&odata-debug=json
The output from this URL includes a multitude of debug information about the https request that was made, server environment, runtime information about the server Olingo library etc.
At the bottom of the output of this URL, trace output from the database is contained in the ifs-trace json array. Each item of this array is a database trace line parsed in to a JSON structure. Included in this array is the SQL that is generated from the metadata in the entityset to retrive data to the page.
Trace support
Trace information can be added to the.plsvc file and this information will appear in devtools network. Trace information can be added using the following method.
Log_SYS.Fnd_Trace_(Log_SYS.debug_, 'Trace Message');
There can be different log levels given to this method. Log_SYS.debug_ is one such level. The other levels are Log_SYS.error_, Log_SYS.info_, Log_SYS.trace_ and Log_SYS.warning_.
Eg: Let’s consider an action that accepts an assignment. We can add the above trace method in to the implementation of the action in.plsvc file as below.
PROCEDURE Accept_Assignment (
    taskseq_                   IN NUMBER,
    execution_instance_seq_     IN NUMBER )
IS
BEGIN
    Log_SYS.Fnd_Trace_(Log_SYS.debug_, 'This is a custom trace message');
    Jt_Execution_Instance_API.Set_Accept(task_seq_, execution_instance_seq_);
END Accept_Assignment_;
Then if we enable logging in IFS Cloud Web client and execute the action ‘AcceptAssignment’, we will be able to see the information we have added in IFS Cloud Web Devtools.
If a parameter is need to be added to this trace message, then it is possible to add it using string interpolation as shown below.
PROCEDURE Accept_Assignment (
    taskseq_                   IN NUMBER,
    execution_instance_seq_     IN NUMBER )
IS
BEGIN
    Log_SYS.Fnd_Trace_(Log_SYS.debug_, 'This is a custom trace message '||task_seq_||' with task seq as parameter');<br/>    Jt_Execution_Instance_API.Set_Accept(task_seq_, execution_instance_seq_);<br/>END Accept_Assignment_;<br/>
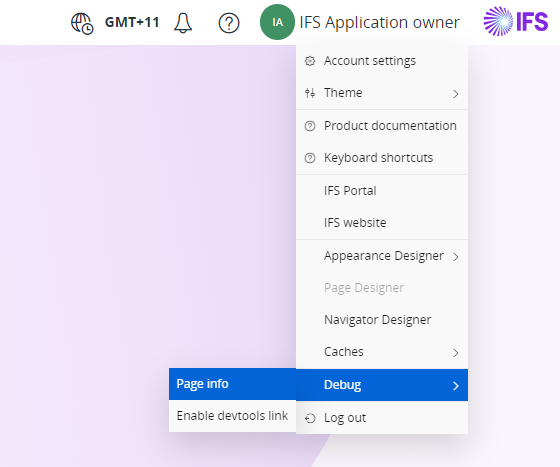
Page info
Page info can be accessed from the user profile dropdown menu under Debug, it will give you mostly the same information as in IFS Cloud Web DevTools Assistant/Pages/Dialogs but without having to have it installed.
Note that to get the complete information in Page info, you will have to have "Enable devtools link", which is also available under Debug, before loading the page you need info on, if you do not do this, some of the information will not be available.
Developer Tools
Another way to get more information about the requests and the responses sent and received when loading a page in IFS Cloud Web is to user the browser tools. This can be opened in Google Chrome by 'Customize and Control Google Chrome (Three vertical dotted line at the rightmost corner of the browser below the close button) --> More tools --> Developer Tools'. Or you can open this by simply pressing F12.
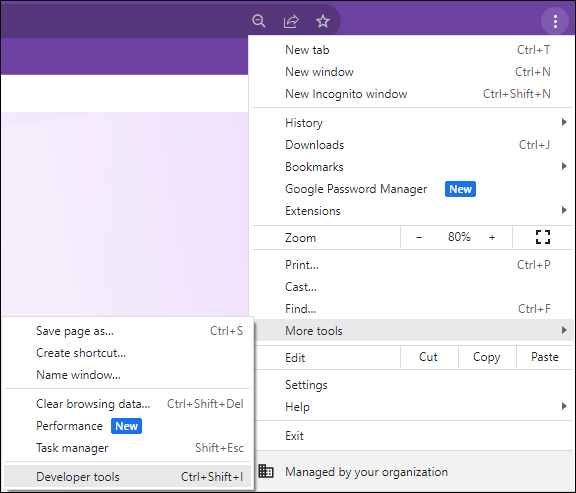
Figure 7 - Debugging through Browser (Google Chrome) Developer Tools
Network Tab
Open developer tools and then refresh the IFS Cloud Web page that requires debugging. Then all the requests will appear under the network tab. By clicking on each request, it is possible to see more information about each request.
Headers tab will include information about the request sent and the Preview tab will contain ifs-trace json array. Response tab contains the metadata of the response and in case of an error, error information can be viewed using this tab. Also in the timing tab, it is possible to view information about how long it takes for the current request to communicate with the server and fetch the data to the client. This is a good indication where performance need to be tested. If the data is fetched from a view and the request takes a long time, then an issue can be that the performance of the given view is not optimized.
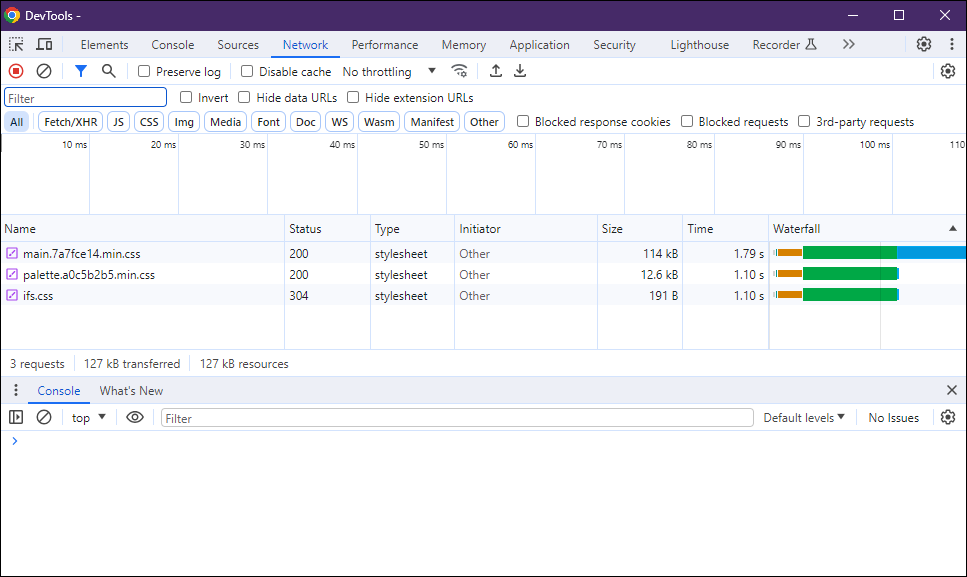
Figure 8 - Use of the Network Tab
If debugging is enabled, RMB on the request → Open in New Tab will open the same information as in database trace support. If debugging is disabled then the same step will view the data fetched from the request.
In case of an action or a function, by clicking on the request of the action, it is possible to view the parameter values that are passed in the Headers tab. The returned value for a function can be viewed using the response or the preview tab.
Console tab
This mainly include any errors that occurs on framework side and should be reported to framework.
Device testing mode
By clicking on the “Toggle Device Toolbar”, it is possible to enter to device testing mode. This allows a page to be viewed in different UI sizes. It can be used to test how the page appears in different devices.
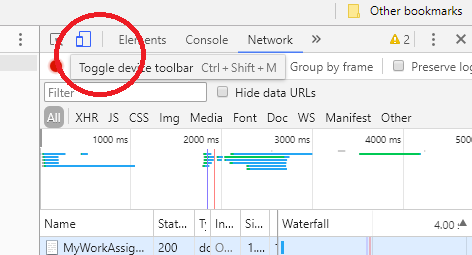
Figure 9 - Toggle Device Testing option
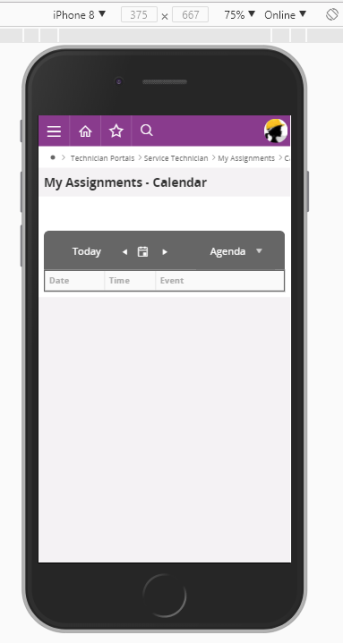
Figure 10 - Testing client on mobile device mode
IFS Cloud Web DevTools
The IFS Cloud Web DevTools is a specialized tool designed for debugging IFS Cloud Web applications. It allows you to gain insights into the application's structure and preview the current state of the inspected IFS Cloud Web version.
Additionally, you can export the gathered information and attach it to aid in debugging when you need to create support cases for IFS Cloud Web.
This tool functions as a Chrome DevTools extension. When using IFS Cloud Web, it seamlessly integrates by adding a dedicated tab named "IFS Cloud" to your Google Chrome DevTools interface.
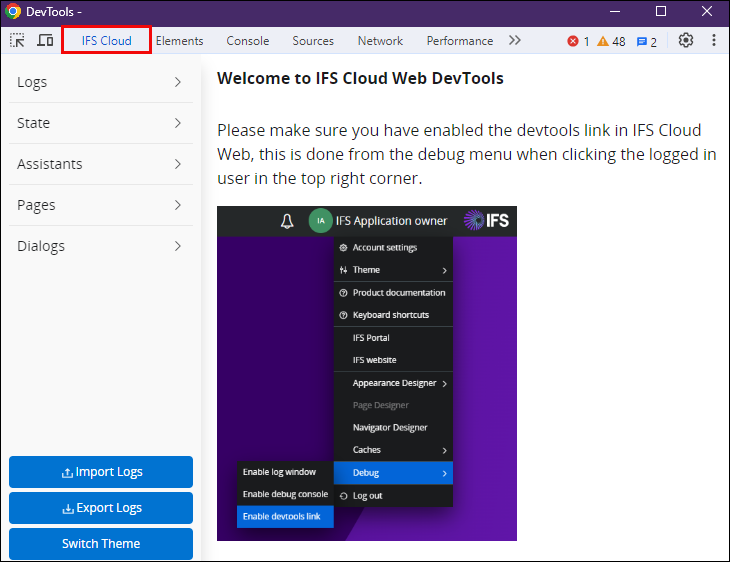
Figure 11 - IFS Cloud Web Devtools extension
Setup the extension
In order to utilize IFS Cloud Web DevTools, you must first add it to your Chrome browser. You can do this by following this link provided to the Chrome Web Store.
- Once you are in Chrome webstore click on "Add To Chrome" button
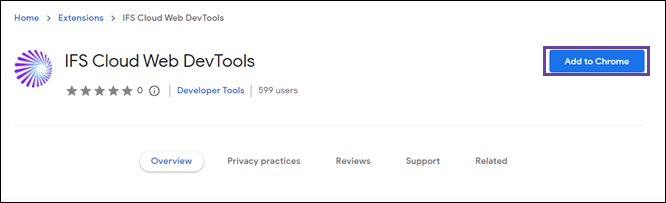
Figure 12 - Chrome Web Store
-
Once you add the extension to your Chrome browser, you can enable it by following the steps below.
-
Click on "Vertical Ellipsis Button" on your Chrome web browser
-
Click on "Extensions" and click on "Manage Extensions"
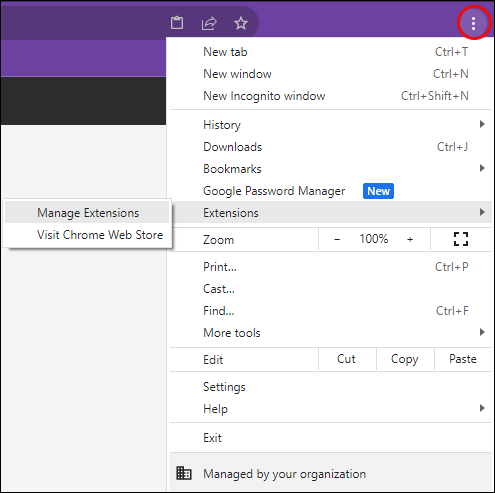
Figure 13 - Manage Extension
- Once you are in the extension repository, find the "IFS Cloud Web DevTools" extension tile and click the "Slider Button" to activate.
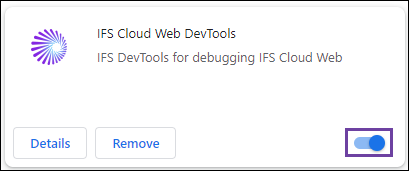
Figure 14 - Extension tile
Linking IFS Cloud Web DevTool
IFS Cloud Web DevTools is a specialized tool tailored to assist both users and developers utilizing IFS Cloud in comprehending the structure of a webpage. This extension offers comprehensive insights into the elements of a page and their interconnections, simplifying the navigation and troubleshooting process for intricate web pages within the IFS client environment.
To linking "IFS Cloud Web DevTools", navigate to any page within the IFS client
- If the page is not compatible with the "IFS Cloud Web DevTools", extension icon (
 ) will appear in gray. When you click on the extension icon, a message will be displayed indicating that the page is not supported.
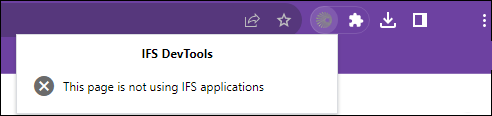
Figure 15 - IFS Cloud Web DevTool inactive
- If the page is compatible with the "IFS Cloud Web DevTools", extension icon (
 ) will appear in generic IFS colors. When you click on the extension icon, a message will be displayed indicating that the page is supported by the "IFS Cloud Web DevTools".
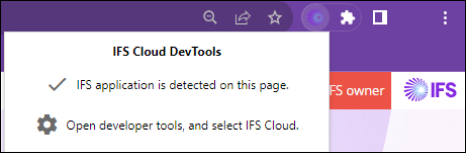
Figure 16 - IFS Cloud Web DevTool active
If you are in a cloud page that supports "IFS Cloud Web DevTools". Follow these instructions to activate the link between the client and the tool.
- Click on "User Profile" and hover over "Debug" section
- Click on the "Enable devtools link"
Once the link is created, as an indication the color of the "User Profile" icon will shift to red. In addition, the client will transmit stored data to IFS Cloud.
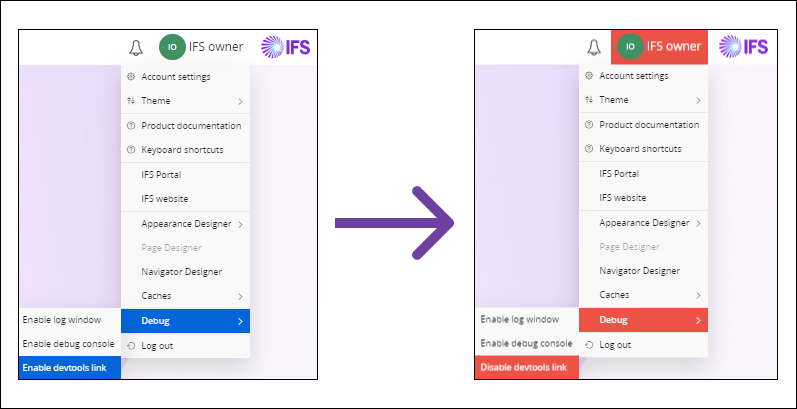
Figure 17 - Link IFS Cloud Web DevTool
Access IFS Cloud Web DevTool
After successfully linking the "IFS Cloud Web DevTools", go to Chrome Developer Tools. You can now see a new tab, labeled as "IFS Cloud" within the Chrome Developer Tool interface. Once you click this tab, it will be populated with data from the client, and you will also notice that the left menu now features several additional panes.
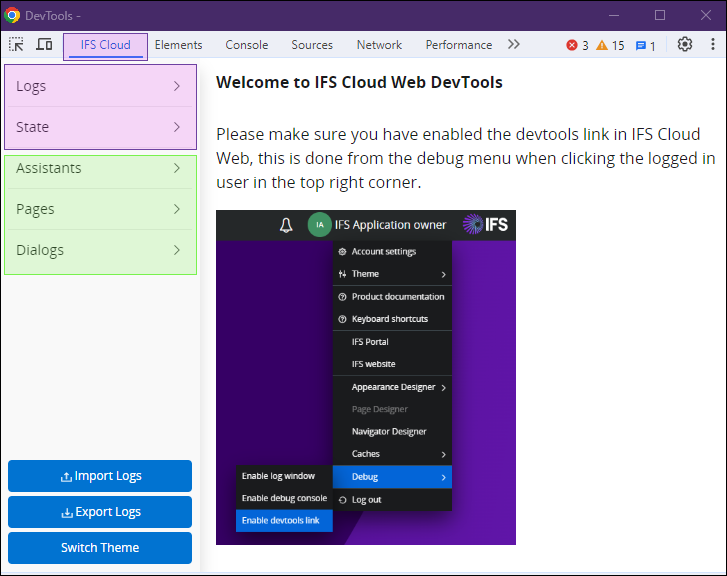
Figure 18 - IFS Cloud Web DevTool (Overview)
Logs: Consists of Network requests and Client Logs
State: Consists of Records, Metadata, View States and Selections
The Assistants, Pages, and Dialog panes are dynamic sections that appear exclusively for specific pages within the IFS Cloud web application.
Components in IFS Cloud Web DevTool
Logs
The "Logs" pane in the "IFS Cloud Web DevTools" displays both Network and Client logs. These logs can be used to understanding how the IFS client is behaving and communicating with the server.
Network
The Network pane in "IFS Cloud Web DevTools" displays all the requests that the IFS client has made to the server. This pane is similar to the regular network tab in the "Chrome Devtools", and allows you to see the name, method, status, size, and time of each request. You can also open the request in the API Explorer to see more details about the request.
Additionally, you can filter the requests by service or search for a specific request name to better understand the client's behaviour.
Note: Network pane only displays requests specific to the IFS Cloud, so you won't see requests from other applications or websites.
The Network pane is a powerful tool for troubleshooting issues and optimizing your development workflow when working with the IFS client.
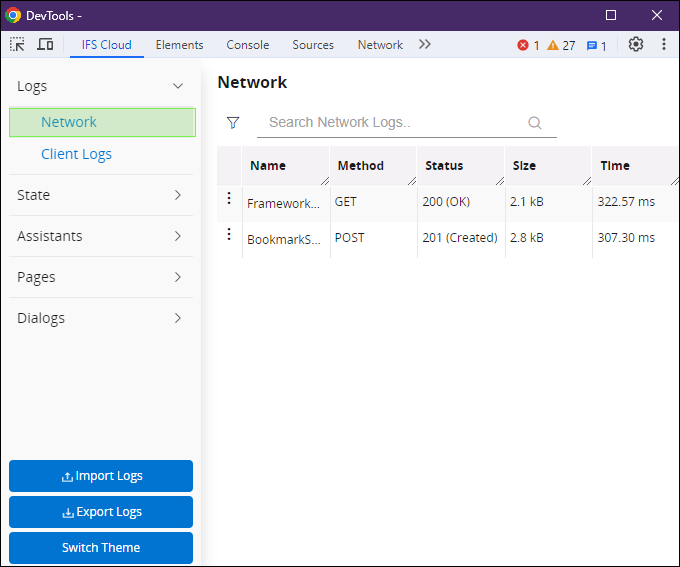
Figure 19 - IFS Cloud Web DevTool (Network Pane)
Upon selecting a request in the "Network" pane, an additional section will become visible which would provide you with supplementary information about the request across several tabs, such as "Headers," "Response," "Payload," "Trace," and "Server."
Headers
You can examine the headers for both the request and response from the "Headers" tab. This provides valuable information like content type, encoding, and caching details for both the request and response.
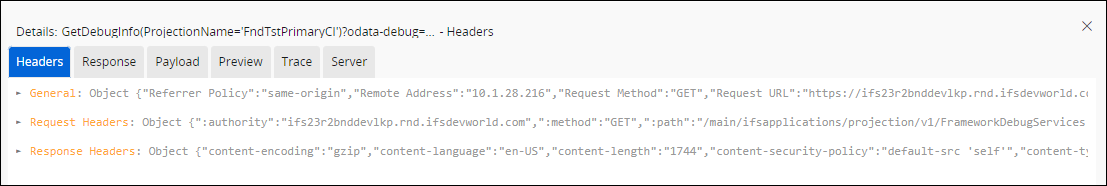
Figure 20 - IFS Cloud Web DevTool (Network Pane - Headers section)
Response
You can examine the response body of the request from the "Response" tab. This can be used to understanding the content of the response, such as JSON data or HTML markup.
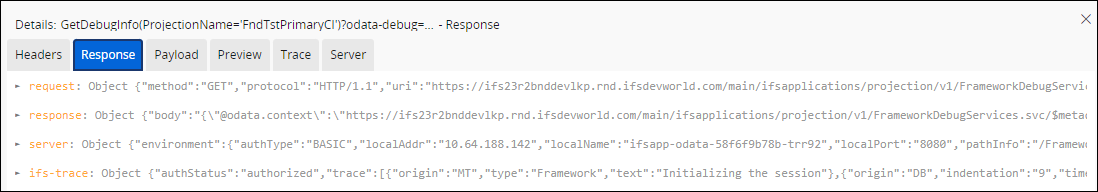
Figure 21 - IFS Cloud Web DevTool (Network Pane - Response section)
Payload
You can inspect the payload of the request, allowing you to comprehend the data that was transmitted, such as form data or JSON data.

Figure 22 - IFS Cloud Web DevTool (Network Pane - Payload section)
Note: "Trace" and "Server" tabs are special to IFS Cloud and are not found in the regular network tab.
Trace
In the "Trace" tab, you can observe the IFS-trace response presented in a table format, featuring columns labeled "Type," "Text," "Time," and "Level."
The "Text" column provides an indented view derived from the trace object, offering users a clear hierarchy of server calls.
Furthermore, you have the capability to filter based on the "Type" or search within the "Text." Additionally, by clicking on the three-dot menu, you can execute a "copy" action to store the information to the clipboard. For specific SQL statements, there is an option to perform a "copy special" action, which formats the SQL statement in a way that allows users to seamlessly paste it into a SQL database for direct execution.
The "Time" column displays the total delay time and the difference between two consecutive calls. The values presented are in seconds.
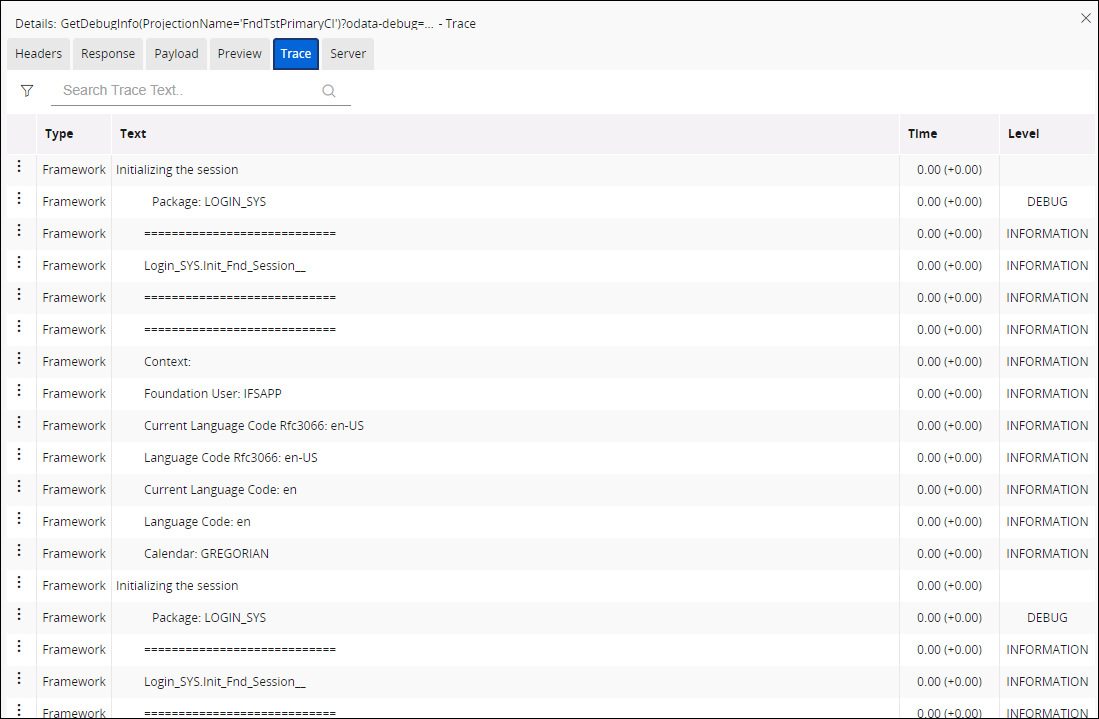
Figure 23 - IFS Cloud Web DevTool (Network Pane - Trace section)
Server
Within the "Server" tab, you can examine the server's response. This proves useful in gaining insight into how the server is reacting to the request you made.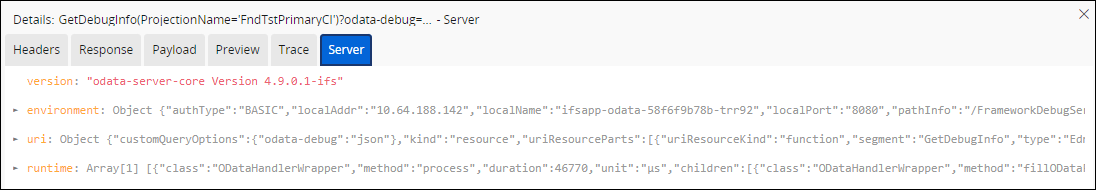
Figure 24 - IFS Cloud Web DevTool (Network Pane - Server section)
Client Logs
In this pane, you'll find a table with four headers: "Time," "Category," "Message," and "Info."
- "Time" indicates when the log message was created.
- "Category" specifies the type of log message (e.g., "Error," "Warning," or "Info").
- "Message" provides the actual text of the log message.
- "Info" offers supplementary details about the log message, such as a stack trace or variable values at the time of message creation.
You have the capability to filter logs based on their category and conduct searches for specific messages, making it convenient to locate the information you need. This feature proves invaluable in pinpointing any errors or warnings that might be influencing the behavior of the IFS client.
Additionally, some logs within the "Info" column may include expandable sections that unveil further information. This is particularly useful for gaining a deeper understanding of the context in which the log message originated.
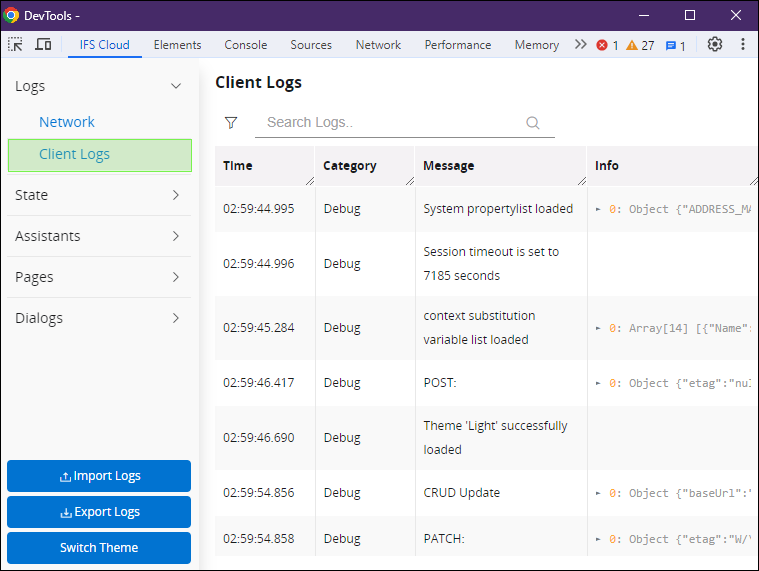
Figure 25 - IFS Cloud Web DevTool (Client Logs)
State
The State dropdown menu in IFS Cloud Devtools is a valuable feature for gaining insight into the current state of the IFS client. It provides access to four important panes: "Records," "Metadata," "View States," and "Selections," all of which directly reflect the client's state.
- The "Records" pane offers visibility into the loaded records, enabling you to grasp the application's structure and preview its current state.
- The "Metadata" pane presents detailed information about records, encompassing aspects like field names, data types, and validation rules, among other attributes.
- The "View States" pane showcases the status of views within the application.
- The "Selections" pane reveals the state of selections, which can include details about selected records or applied filters.
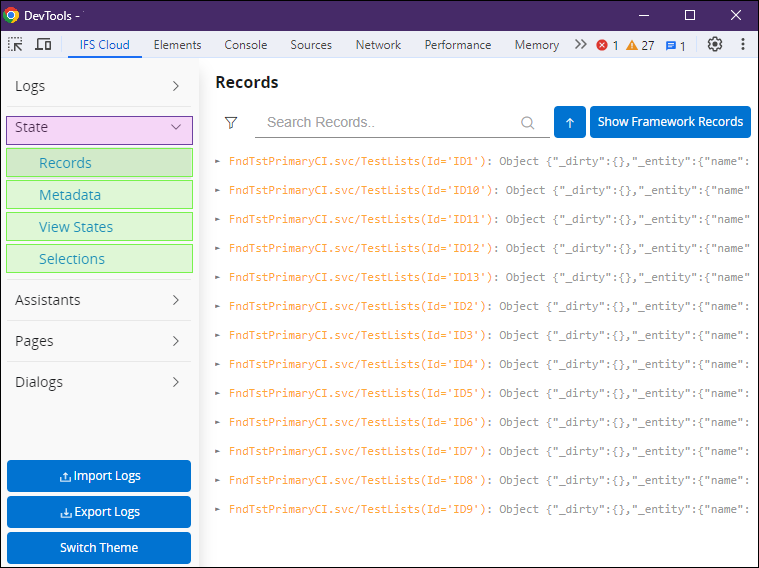
Figure 26 - IFS Cloud Web DevTool (State Pane)
In summary, the State dropdown menu serves as a powerful tool for both troubleshooting issues and enhancing your development process when working with the IFS client. It allows for a more comprehensive understanding of the client's state, aiding in the resolution of problems and the streamlining of development tasks.
Records
The Records pane within IFS Cloud Devtools is an invaluable tool for gaining insights into the status of records within your application. It provides a comprehensive view of the loaded records from the store. Additionally, you have the option to switch and display framework records by using the "Show Framework Records" button.
Furthermore, you have the ability to filter records based on projection, conduct searches for specific record names, and sort the records either in ascending or descending order. This functionality greatly facilitates the process of quickly locating the specific records you require and comprehending their current state.
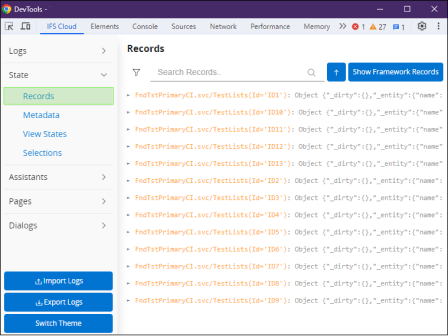
Figure 27 - IFS Cloud Web DevTool (Records Pane)
Metadata
The Metadata pane in IFS Cloud Devtools is a robust tool designed for examining the loaded metadata within your application. Within this pane, you can observe the projection and layout of the metadata, and there's also a search functionality available by name.
To access the detailed information of a specific metadata entry, simply click on it in the list. This action will unveil comprehensive details about the metadata, including its field names, data types, and validation rules.
This functionality proves particularly useful for gaining a clear understanding of your application's structure and for troubleshooting any issues that may arise during development or usage.
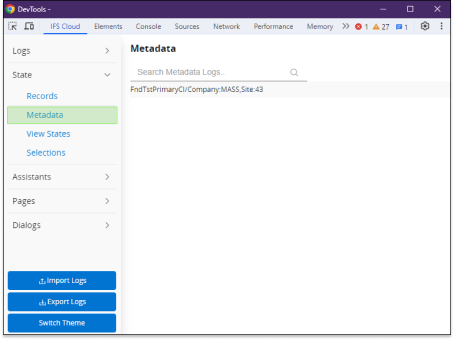
Figure 28 - IFS Cloud Web DevTool (Metadata Pane)
View States
The View States pane in IFS Cloud Devtools allows you to search for and expand view states to access their detailed information. This feature is particularly useful for gaining insights into the current state of your application and for troubleshooting any issues that may arise.
By examining the view states, you can pinpoint any potential problems with the views and make necessary optimizations to enhance their performance. This capability proves invaluable in ensuring that your application runs smoothly and efficiently.
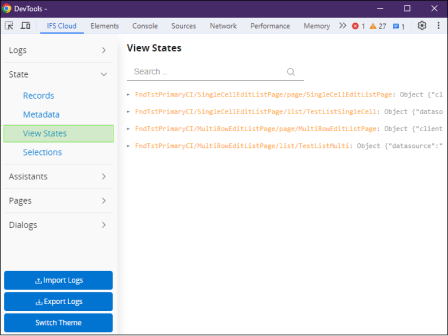
Figure 29 - IFS Cloud Web DevTool (View States Pane)
Selections
The Selections pane provides a means to observe the current and previous selections made in the client. On the left side of the pane, there's a list of the loaded selections, which you can expand or collapse to reveal or conceal their specific details.
Upon selecting a particular entry from the list, its corresponding details are presented on the right side of the pane. This may encompass information like the selection's name, type, and associated properties. In cases where multiple selections are active, you'll encounter a list of objects that you can further expand to view their respective details.
In summary, the Selections pane serves as a valuable tool for gaining insights into the status of selections within your application. It proves invaluable for troubleshooting issues and streamlining your development process when working with IFS Cloud.
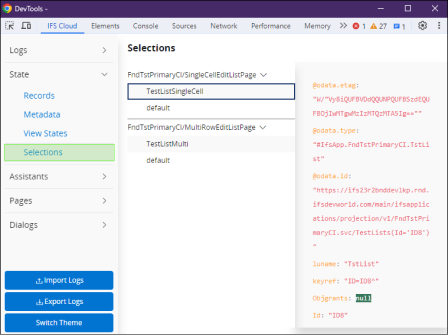
Figure 30 - IFS Cloud Web DevTool (Selections Pane)
Assistants / Pages / Dialogs
In "IFS Cloud Web Devtools", the panes for Assistants, Pages, and Dialogs are dynamically generated based on the user's current location within IFS Cloud. When you click on an Assistant, Page, or Dialog in the left menu, a corresponding PageInfo pane specific to that component will be presented.
The PageInfo pane provides a detailed breakdown of the component, including its view, projection, entity, content, and the fields available. Additionally, you have the option to access even more intricate information about each individual field.
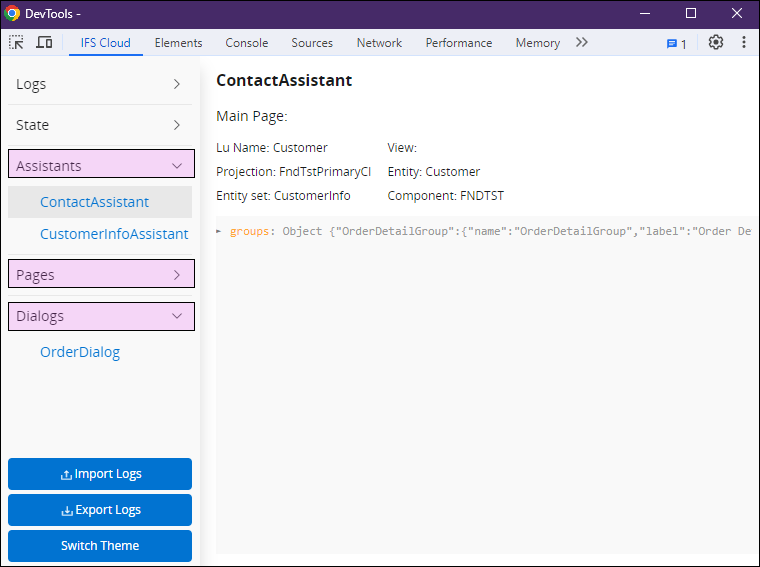
Figure 31 - IFS Cloud Web DevTool (Assistants, Pages & Dialogs Panes)
In summary, the dynamic generation of panes within "IFS Cloud Web Devtools" simplifies the process of examining and comprehending the various components of your application. This feature proves highly useful for developers and users alike.
Import/Export
When working with IFS Cloud, users have the capability to perform export and import actions to effectively handle their data and network requests.
Figure 32 - IFS Cloud Web DevTool (Import & Export)
During an export action, a snapshot is captured of the current state of the IFS Cloud. This includes both store data and network requests. This snapshot is then compressed into a zip file named: "ifs-cloud-logs-" ( ). Inside this zip file, you can find the store snapshot labeled as "log--" (
 ), and the network snapshot labeled as "network-"(
 ).
).
However, when it comes to importing data, it's essential to note that only the .ifscloud file can be imported using the import action. The network logs, on the other hand, must be imported specifically through the network tab. Importing data only impacts the IFS Cloud Web DevTools and does not alter the actual running application.
In summary, the export and import actions prove to be invaluable tools for efficiently managing both data and network requests in the IFS Cloud. By creating snapshots of the current state, users can readily handle their data and address any potential issues that may arise.
Additional Tools - POSTMAN
Postman is a third part Chrome plugin that allows you to interact with the REST API. It is possible to make different kinds of HTTP requests - GET, POST, PUT, PATCH and DELETE. This is a tool that can be used to test the actions and function in a projection.
In addition to postman plugin you are required to install chrome plugin "Postman Interceptor". This will fetch the cookies for the environment page from your web browser once you log in to the environment page, and use in the postman tool to authenticate your requests.
Once postman plugin is installed to chrome browser, it is possible to create a new request as shown below or you can close this dialog and directly move to the main window.
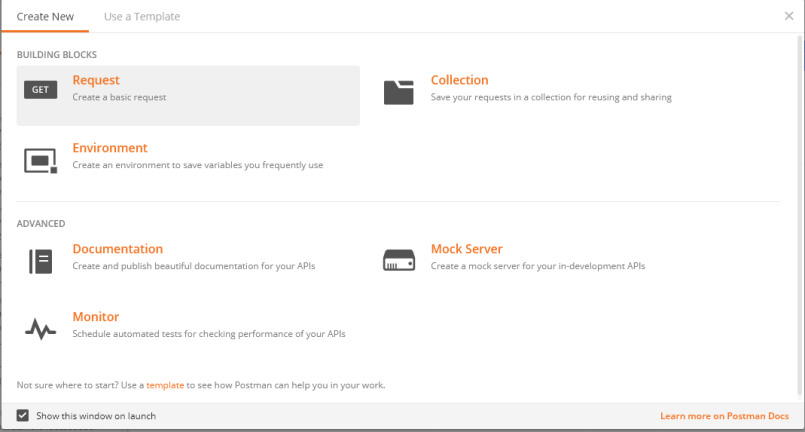
Figure 33 - POSTMAN Tool
This allows you to select the type of request you want to send and add the request URL.
Before sending a request make sure that the “postman interceptor” is turned on. If not you will get a login error and will not be able to send the request successfully. It can be turned on as shown below.
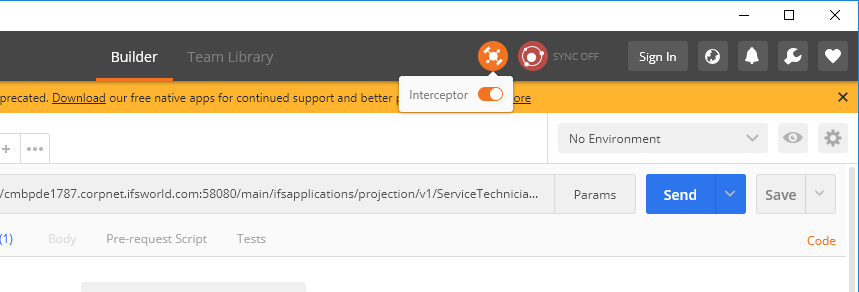
Figure 34 - Turning on Interceptor of the POSTMAN Tool
As shown in the screenshot below it is possible to select the required request type and add the URL of the request. Then the request can be sent using the sent button and the results will be shown in the "Body" tab.
Eg: To test a function call that accepts a parameter as an input and returns a structure as the output as given below, URL that should be entered can be similar to as follows. This is a GET request and the request type should be set as GET.
function GetExpenseInInfo Structure(ExpenseInInfoStruct) {
    parameter TaskSeq Number;
}
https://environment.corpnet.ifsworld.com:58080/main/ifsapplications/projection/v1/ProjectionName.svc/GetExpenseInInfo(TaskSeq=3220)
The output for this request is shown in JSON format. This can be changed using the drop down provided by POSTMAN.
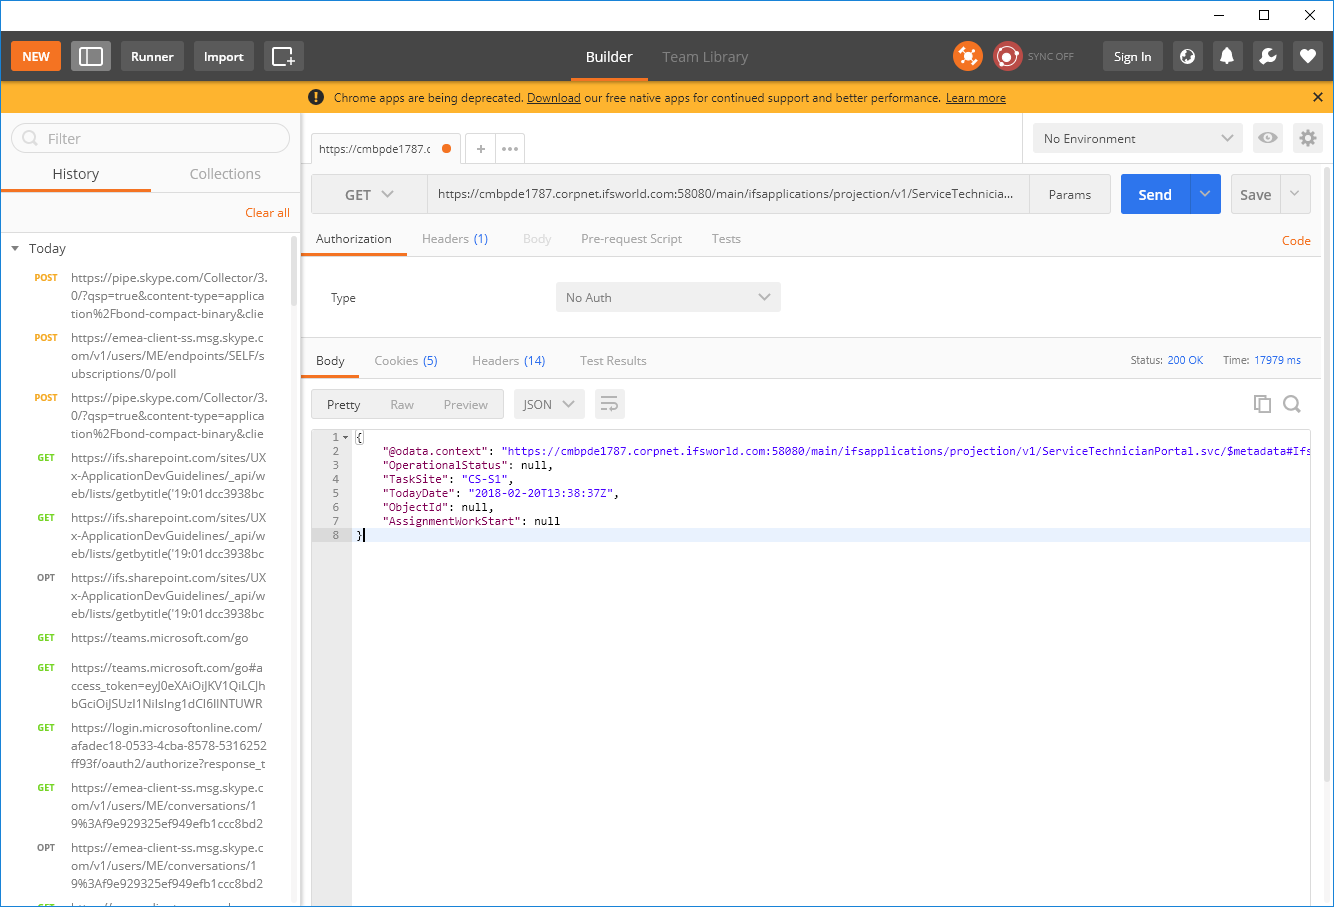
Figure 35 - Testing GET request with the POSTMAN Tool
It is possible to test other types of requests using POSTMAN as well. If we want to test a action in a projection then we can follow the similar pattern to enter the action in to the URL. But the request type should be set as POST.
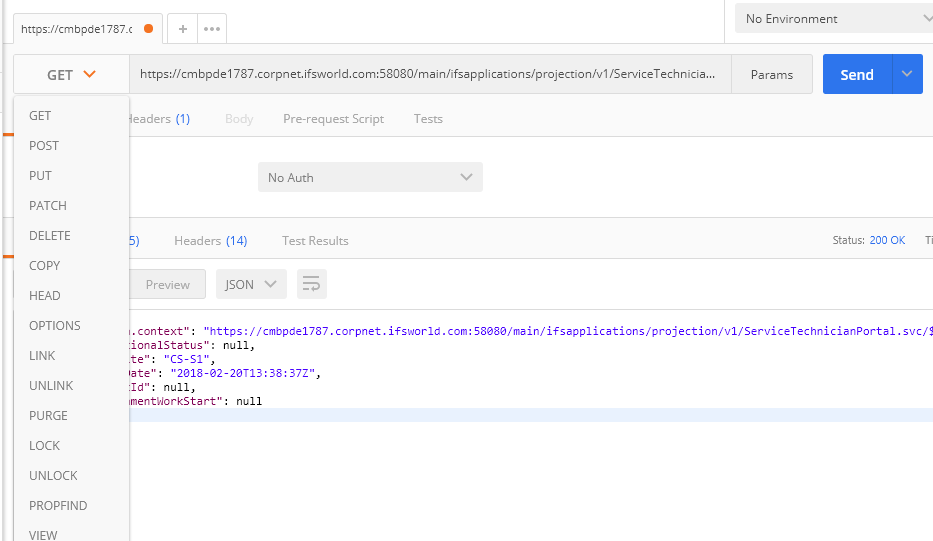
Figure 36 - Testing POST request with the POSTMAN Tool