Workflow Performance Benchmarking
This article documents the results of structured load testing carried out on IFS Cloud BPA Workflows. The primary objective was to benchmark IFS Cloud BPA Workflows and understand how simple and complex loop-heavy Workflows behave under concurrent user load, using loop cardinality, Workflows per execution and resource consumption as the key metrics.
Two representative Workflow patterns were tested: a lightweight synchronous Workflow and a complex asynchronous loop Workflow. Load was applied at 1 to 300 concurrent users. During this testing, the asynchronous loop Workflow showed progressive reliability issues as Loop Cardinality and concurrency increased. That observation led to a follow-up test in which the heap setting was adjusted to see whether it changed the outcome, and by how much — this is documented as a separate performance improvement test outcome further down in this article, alongside the original benchmark results.
Test Environment
All testing was conducted on a dedicated IFS Cloud environment. No other business workloads, integrations, reports or user activity ran concurrently during any test window.
| Component | Specification |
|---|---|
| Environment size | Large (L) — rated for approximately 300 concurrent users |
| OData PODs | 2 × ifsapp-odata; each pod: 4 GB memory (request = limit), ~1.3 GB idle usage |
| CPUs | 16 |
| Database | Oracle Database 19c Enterprise Edition |
| Disk | 1,024 GB allocated |
| IFS Cloud version | 26.1.x |
| ODP_JAVA_OPTS (default) | -XX:MaxRAMPercentage=95.0 -XX:-OmitStackTraceInFastThrow -Dodp.projection.cache.limit=500 |
| Test tool | Apache JMeter (trigger load); Workflow engine history database and BPA async audit tables (Workflow-level results); Azure Monitor (infrastructure metrics) |
Tested Workflows
Two BPA Workflows were purpose-built and pushed to their limits. Both were deliberately left un-optimized — no filters, no parallel execution, no payload trimming were applied. This establishes a conservative baseline; real optimized Workflows can be expected to perform the same or better.
Simple Synchronous Workflow
A lightweight, synchronous Workflow used to establish a baseline for request/response-style Workflows that complete within the triggering request itself.
| Property | Value |
|---|---|
| Projection used in the Workflow | CustomerOrderHandling (184 attributes — a wide, heavyweight entity) |
| Trigger | Projection Action on Locality creation |
| Execution style | Synchronous — completes within the trigger request cycle (~1 second) |
| Steps | Generate unique label note → Read customer order (ETag captured) → Update LabelNote → Verify update (read-after-write) |
| Database interactions per execution | 3 |
| Loops | None |
| Optimizations applied | None |
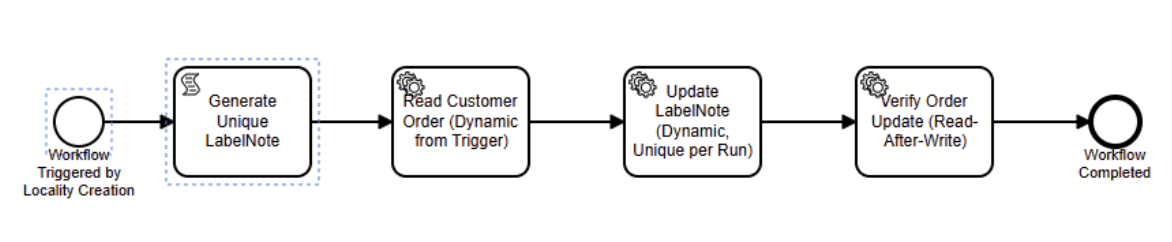
Figure 1 — Simple Workflow design: synchronous execution, no loops
Bulk Asynchronous Loop Workflow
A background, asynchronous Workflow built around sequential loops, used to push a worst-case, unoptimized loop-heavy design to its limits.
| Property | Value |
|---|---|
| Projection used in the Workflow | BpaTestHandling (18 attributes — a lightweight entity) |
| Trigger | Projection Action on Location Type creation |
| Execution style | Asynchronous — trigger returns immediately (~1 s); Workflow runs in the background on the Workflow engine inside the OData POD |
| Steps | Create N entities (sequential multi-instance loop) → Read created records → Delete all (sequential multi-instance loop) → Verify deletion |
| Loop Cardinality (N) | Varied from 1 to 2,000 to increase complexity. At LC 2,000: 4,000 entity operations ≈ 4,002 database interactions per execution |
| Database interactions per execution | ≈ 2 × Loop Cardinality + 2 collection reads |
| Status Monitoring | Asynchronous Workflow execution status was monitored using the BPA_ASYNC_SYS_TAB and BPA_ASYNC_SYS_AUDIT_TAB tables, as well as the Asynchronous Workflow Executions page. |
| Optimizations applied | None |
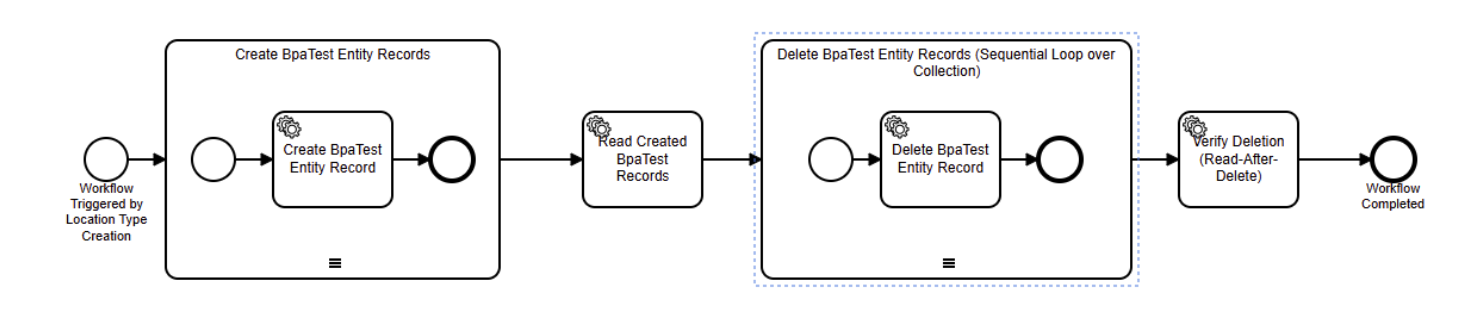
Figure 2 — Bulk Data Workflow design: asynchronous background execution with sequential loops
Note on attribute count: The Simple Workflow tests a 184-attribute entity — a deliberately demanding case for a synchronous Workflow. The Bulk Workflow tests an 18-attribute entity. Loop timings measured here reflect a lightweight entity; loops over wider entities will cost proportionally more per iteration.
Load Test Parameters
The following abbreviations are used throughout this document:
| Term | Meaning | Values tested |
|---|---|---|
| LP — Load Profile | Number of concurrent JMeter users, each firing one trigger (one Workflow instance per user) | 1, 50, 100, 300 |
| LC — Loop Cardinality | Number of sequential iterations in the Bulk Workflow loop (records created then deleted) | Tested with 1 to 2,000 iterations |
| Ramp | JMeter ramp-up period in seconds over which all users start (5 s per user in the standard series) | 1, 250, 500, 1,500, 15,000 s |
| Heap | MaxRAMPercentage — share of the 4 GB OData POD container memory the JVM may claim as heap | 95% (default) |
Simple Workflow Results
This section covers the results of the Simple Workflow tests, ran across LP1 to LP300 and a 1-hour endurance run.
Simple Workflow Trigger Response Times
The table below shows trigger response times for each LP, plus the 1-hour endurance run.
| Run | Ramp (s) | Users | Min (ms) | Median (ms) | 95th pct (ms) | Max (ms) | Errors |
|---|---|---|---|---|---|---|---|
| LP1 | 1 | 1 | 1,112 | 1,112 | 1,112 | 1,112 | 0 |
| LP50 | 50 | 50 | 1,061 | 1,086 | 1,130 | 1,170 | 0 |
| LP100 | 100 | 100 | 1,062 | 1,090 | 1,126 | 1,137 | 0 |
| LP150 | 150 | 150 | 1,057 | 1,101 | 1,126 | 1,197 | 0 |
| LP200 | 200 | 200 | 1,056 | 1,089 | 1,119 | 1,161 | 0 |
| LP250 | 250 | 250 | 1,050 | 1,087 | 1,119 | 1,210 | 0 |
| LP300 | 300 | 300 | 1,048 | 1,082 | 1,113 | 1,143 | 1 (0.33%) |
| LP300 re-run (ramp 900 s) | 900 | 300 | 1,064 | 1,098 | 1,144 | 1,247 | 0 (0.00%) |
| 1-hour endurance | 1,500 | 300 | 1,040 | 1,069 | 1,095 | 2,713 | 2 (0.05%) |
The single error at LP300 (0.33%) did not reproduce when the ramp-up was extended to 900 seconds (0.00% errors), confirming it was a brief arrival-burst artifact rather than a capacity limit. The endurance-test errors were isolated HTTP 500 error codes in a single 5-minute window; all Workflow instances completed successfully per Workflow engine history.
Simple Workflow Database Resource Usage
The table below shows database CPU, memory and disk write activity observed during the Simple Workflow endurance and burst runs.
| Run | Heap | DB CPU (avg / peak) | DB memory available | Disk write ops/s | Data written |
|---|---|---|---|---|---|
| 1-hour endurance | 95% | 2.9% / 10.5% | ~25%, steady | 12 / 16 | 2.66 GiB |
| LP300 re-run, ramp 900 s | 95% | 2.2% / 4.6% | ~26%, steady | 34 / 227 | 7.30 GiB |
Database resource usage stayed low throughout, confirming the database was not a limiting factor for the Simple Workflow pattern.
Simple Workflow Throughput
The table below shows measured throughput for each LP and the endurance run.
Note: Execution is synchronous, so every successful request is a completed Workflow. In the paced burst runs, measured throughput matched the configured arrival rate exactly with no queuing. The endurance throughput reflects the test-plan pacing, not a platform ceiling (database CPU stayed at 2–5% throughout).
| Run | Ramp | Samples | Errors | Trigger pacing | Throughput (wf/s) | Per minute |
|---|---|---|---|---|---|---|
| LP1 | 1 | 1 | 0 | Single request | 0.90 | — |
| LP50 | 50 | 50 | 0 | 1 user / s | 1.00 | 60 |
| LP100 | 100 | 100 | 0 | 1 user / s | 1.00 | 60 |
| LP150 | 150 | 150 | 0 | 1 user / s | 1.00 | 60 |
| LP200 | 200 | 200 | 0 | 1 user / s | 1.00 | 60 |
| LP250 | 250 | 250 | 0 | 1 user / s | 1.00 | 60 |
| LP300 | 300 | 300 | 1 | 1 user / s | 1.00 | 60 |
| LP300 re-run | 900 | 300 | 0 | 1 user / 3 s | 0.33 | 20 |
| 1-hour endurance | 1,500 | 3,850 | 2 | Continuous ~70 min | 0.92 | ≈55 |
Bulk Workflow Results
This section covers the results of the Bulk Data Workflow tests, ran across LP1–LP300 and loop cardinalities from 1 to 2,000, to benchmark performance and establish the point at which the Workflow execution starts to fail.
Outcomes by Load Profile and Loop Cardinality
The table below shows the outcome of representative LP and LC combinations. As LC increases, Workflow instances increasingly needed async retries to complete, and at the highest Loop Cardinality tested, the Workflow failed outright and the OData PODs became unresponsive.
| Loop Cardinality | LP50 & ramp 250 s | LP100 & ramp 500 s | LP300 & ramp 1,500 s | LP300 & ramp 15,000 s |
|---|---|---|---|---|
| 500 | Completed — no retries | Completed — no retries | Completed — 11 of 300 needed retries | — |
| 750 | Completed — no retries | Completed — no retries | Completed — 28 of 300 needed retries | — |
| 1,000 | Completed — 16 retried | Completed — ~half retried | Completed — 139/300 (~46%) retried | — |
| 2,000 | FAILED — 3 out of 50 samples completed; POD restarts | FAILED — 6 out of 100 samples completed; POD restarts | FAILED — 8 out of 300 samples completed; PODs unresponsive | FAILED — 243 out of 300 samples; PODs unresponsive |
Bulk Workflow Database Resource Usage
The table below shows database CPU, memory and disk write activity during the heaviest run, where the Workflow itself was failing.
| Configuration | DB CPU (avg / peak) | DB memory available | Disk write ops/s | Data written |
|---|---|---|---|---|
| LP300 & LC 2,000 & ramp 1,500 (heap 95% — failing run) | 3.2% / 23.3% | dipped to 21% | 38 / 205 | 97.0 GiB |
DB CPU stayed below 25% and memory remained relatively steady even while the Workflow itself was failing — an early signal that the database was not the bottleneck behind these failures.
Root Cause Analysis
This subsection explains what was found when the failures observed above were investigated. The first area reviewed was the OData POD itself, and its JVM heap setting (MaxRAMPercentage) was found to be at its default value of 95%. The OData POD runs a JVM inside a Kubernetes container with a hard 4 GB memory limit (cgroup limit). MaxRAMPercentage controls what fraction of that 4 GB the JVM may allocate as heap. The remainder must cover all JVM internals operating outside the heap:
| JVM memory area | Purpose | Approximate size |
|---|---|---|
Heap (controlled by MaxRAMPercentage) | Workflow engine execution state, entity data, Workflow variables, Workflow engine history | ~3.8 GB at the default 95% setting |
| Metaspace | Loaded class metadata and JIT-compiled code | 200–400 MB |
| Thread stacks | Stack memory per active Workflow engine executor thread (~1 MB each) | 100–300 MB |
| Direct / native buffers | Off-heap NIO, JDBC driver, Netty network buffers | 100–300 MB |
| OS and kernel overhead | Kernel page cache and system overhead within the container cgroup | 50–100 MB |
At the default 95% setting, the heap cap is ~3.8 GB, leaving only ~200 MB for everything else — insufficient under sustained loop-Workflow load.
When the total footprint exceeds 4 GB the kernel OOMKills the JVM process. Kubernetes detects the container exit and restarts it. This is visible as unexpected OData POD restarts in the Kubernetes events and in the BPA_POD_HISTORY_TAB table. This pointed directly at the JVM heap setting as the next thing to test, rather than the database or the Workflow design itself. That follow-up test is documented in Heap Setting Change — Performance Improvement Test below.
Heap Setting Change — Performance Improvement Test
Both the Simple and Bulk Workflow test suites above were run using the OData POD's default configuration. As explained in Root Cause Analysis, this meant the JVM heap setting (MaxRAMPercentage) was at its default value of 95%. As the first step to test whether this had any effect, MaxRAMPercentage was changed to 70% — keeping every other environment parameter and configuration unchanged — and the same tests were re-run. This section presents that test outcome for both Workflow patterns, followed by the resulting performance recommendation.
Simple Workflow — Heap 70% Comparison
To confirm the heap setting change did not negatively affect the lightweight, synchronous Workflow pattern, the Simple Workflow 1-hour endurance test was repeated at heap 70%.
| Run | Ramp (s) | Concurrent Users | Min (ms) | Median (ms) | 95th pct (ms) | Max (ms) | Errors |
|---|---|---|---|---|---|---|---|
| 1-hour endurance (heap 70%) | 900 | 300 | 1,015 | 1,052 | 1,094 | 2,448 | 1 (0.03%) |
| Run | Heap | DB CPU (avg / peak) | DB memory available | Disk write ops/s | Data written |
|---|---|---|---|---|---|
| 1-hour endurance | 70% | 2.3% / 8.7% | ~25%, steady | 9 / 12 | 2.35 GiB |
| Run | Ramp | Samples | Errors | Trigger pacing | Throughput (wf/s) | Per minute |
|---|---|---|---|---|---|---|
| 1-hour endurance (heap 70%) | 900 | 2,913 | 1 | Continuous ~55 min | 0.88 | ≈53 |
Response times, database resource usage and throughput were consistent with the heap 95% endurance run in Simple Workflow Results above — confirming that the heap setting has no measurable effect on this simple, synchronous Workflow pattern.
Bulk Workflow — Heap 70% Comparison
MaxRAMPercentage was lowered from the default 95% to 70% and the Bulk Workflow test suite was re-run in full, across the same LPs and LCs, to see whether reliability improved. An intermediate value of 80% was also tested for comparison. This section presents that comparison as a test outcome — it is not a starting configuration, but a change identified through this testing.
Key finding: Setting
MaxRAMPercentageto 70% on the OData POD delivered 100% Workflow success at every tested load level — including 300 concurrent users each processing 2,000 records per execution. The default value of 95% caused progressive degradation and, at higher loads, complete Workflow failure and POD unresponsiveness, as shown earlier.
The chart below plots median Workflow duration against Loop Cardinality at heap 70%, across the four LPs.
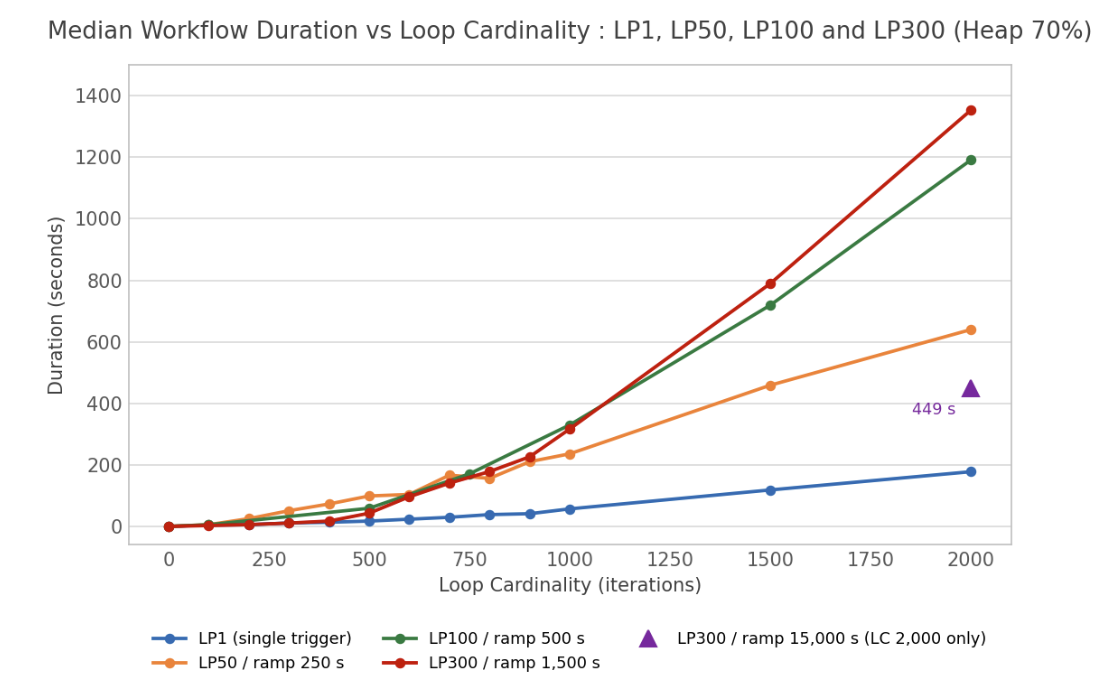
Figure 3 — Median Workflow Duration vs Loop Cardinality: LP1, LP50, LP100 and LP300 (Heap 70%)
Bulk Workflow Duration at Heap 70%
The table below shows median Workflow duration (seconds) across LPs and LCs, at heap 70%. Every run in this table completed 100% of Workflow instances with no errors and no async retries.
| Loop Cardinality | LP1 (single) | LP50 & ramp 250 s | LP100 & ramp 500 s | LP300 & ramp 1,500 s | LP300 & ramp 15,000 s |
|---|---|---|---|---|---|
| 1 | 0.1 | 0.1 | 0.1 | 0.1 | — |
| 100 | 4.7 | 5.7 | 5.5 | 2.8 | — |
| 200 | 5.5 | 25.3 | — | 5.9 | — |
| 300 | 11.2 | 51.1 | — | 10.9 | — |
| 400 | 13.5 | 73.0 | — | 17.4 | — |
| 500 | 17.4 | 99.0 | 59.0 | 43.0 | — |
| 600 | 23.5 | 103.9 | — | 96.4 | — |
| 700 | 29.6 | 166.6 | — | 140.7 | — |
| 750 | — | — | 170.9 | — | — |
| 800 | 38.4 | 156.2 | — | 178.3 | — |
| 900 | 41.3 | 210.5 | — | 226.3 | — |
| 1,000 | 57.0 | 236.0 | 329.9 | 316.7 | — |
| 1,500 | 118.6 | 459.0 | 719.3 | 789.5 | — |
| 2,000 | 177.9 | 639.8 | 1,191.2 | 1,353.1 | 449.3 |
Key insight: at 300 concurrent users with proportional 5 seconds per user pacing, completion times track the 100-trigger curve — and at smaller loop cardinalities finish even faster. Arrival spacing is the dominant factor controlling queueing. At LP300 & ramp 15,000 s, the median for LC 2,000 dropped from 1,353 seconds to 449 seconds — a 3× improvement achieved purely by spreading trigger arrivals.
Heap Setting Comparison at Peak Load
The identical heaviest test was run three times, changing only MaxRAMPercentage:
| MaxRAMPercentage | Completed (no retries) | Completed (with retries or POD scaling) | Failed | Success rate | POD behaviour |
|---|---|---|---|---|---|
| 70% | 300 | 0 | 0 | 100% | Stable — no scaling, no restarts |
| 80% | 0 | 300 | 0 | 100% (retry-assisted) | Extra PODs spun up; replicas cycled; executions took longer |
| 95% | 8 | 0 | 292 | 2.7% | OData PODs became unresponsive |
Note: The database was never the bottleneck — DB CPU stayed below 23% and memory was stable even in the failing runs. Failures at 95% were application-tier, not database exhaustion.
The chart below compares heap 70% and heap 95% at LP300 with a 1,500 s ramp as Loop Cardinality increases. Duration stays clean at 70%; at 95% retries grow with Loop Cardinality and the run fails at LC 2,000.
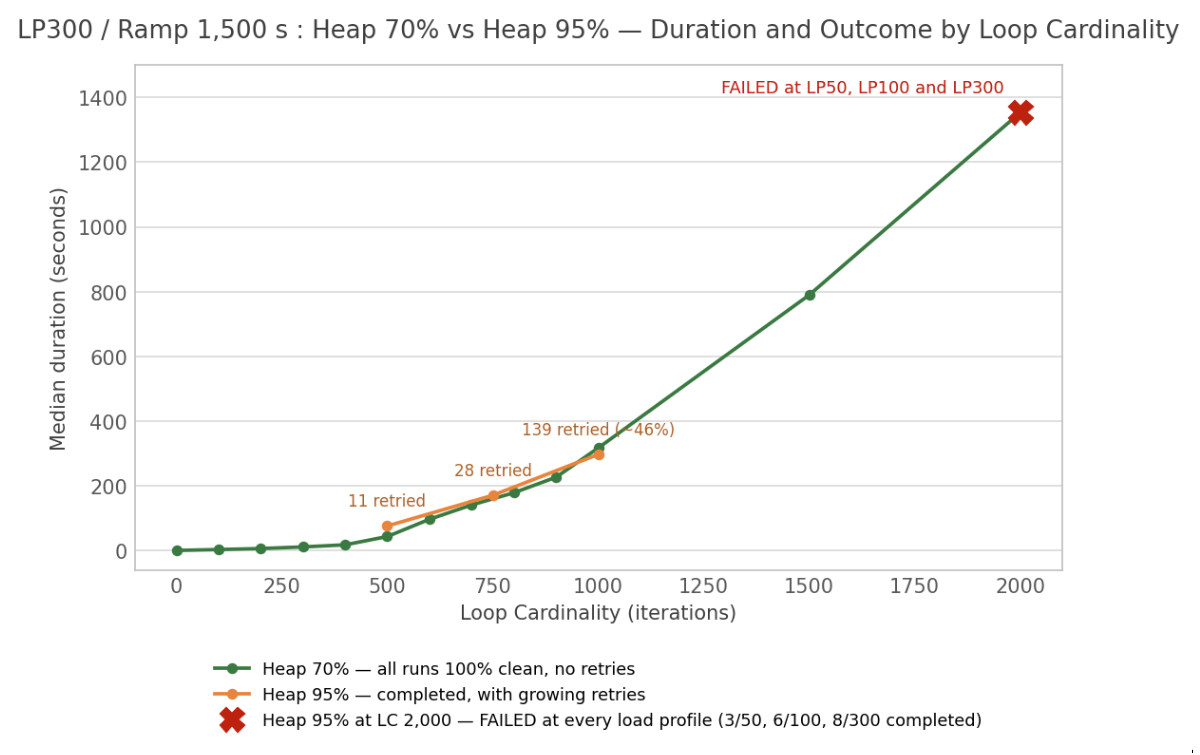
Figure 4 — LP300 & Ramp 1,500 s: Heap 70% vs Heap 95% — Duration and Outcome by Loop Cardinality. The green line shows clean completions at 70%; the orange line shows increasing retries at 95% as loop cardinality grows; the red X marks complete failure at LC 2,000 across every LP.
The chart below shows the heaviest test — 300 concurrent users, 2,000-record loops, 1,500 s ramp — run three times, changing only MaxRAMPercentage. Heap 70% completed every instance; 80% completed only with retries and POD scaling; 95% failed almost entirely.
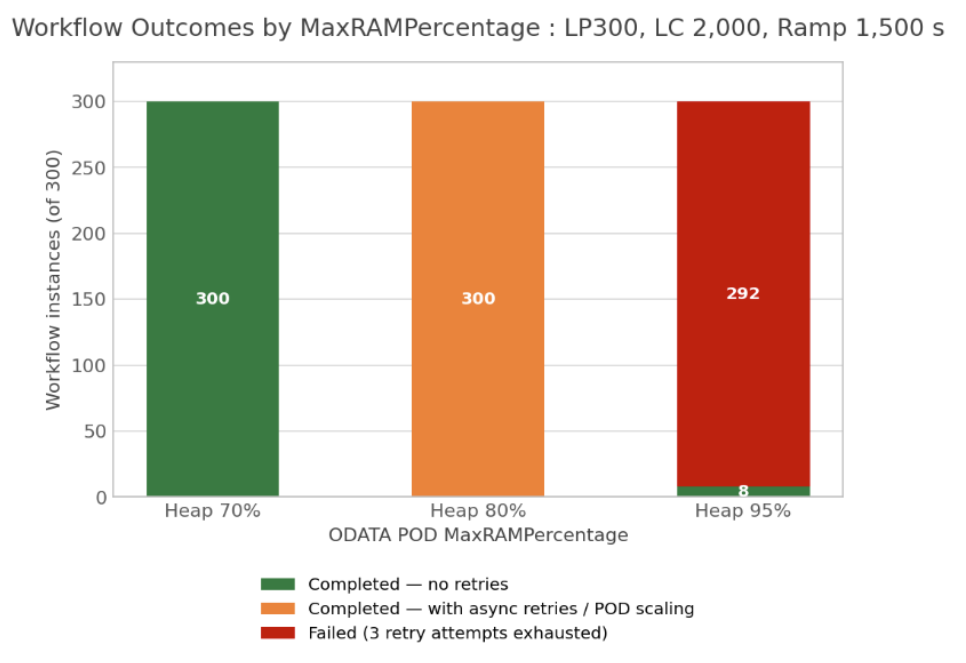
Figure 5 — Workflow Outcomes by MaxRAMPercentage at LP300, LC 2,000, Ramp 1,500 s: the identical heaviest test run three times, changing only MaxRAMPercentage.
Heap 70% versus 95% Outcome Comparison
The table below lists matching load and loop combinations at heap 70% and heap 95%, side by side. Behaviour is identical at smaller loops; retries appear first at 95%, then complete failure at LC 2,000 regardless of concurrent users or ramp.
| Concurrent users | Loop Cardinality | Heap 70% — outcome & duration | Heap 95% — outcome & duration | Deviation at 95% |
|---|---|---|---|---|
| 100 | 500 | All completed, no retries — typical ~1 min | All completed, no retries | None — identical behaviour |
| 100 | 750 | All completed, no retries — typical ~2.8 min | All completed, no retries — typical ~2.7 min | None |
| 50 | 1,000 | All completed, no retries — typical ~4 min | Completed — 16 needed retries | Retries appear (first strain) |
| 100 | 1,000 | All completed, no retries — typical ~5.5 min | Completed — ~half needed retries | Completion depends on retry safety net |
| 300 | 500 | All completed, no retries — typical ~43 s | Completed — 11 needed retries — typical ~76 s | Retries at 500-record loops |
| 300 | 1,000 | All completed, no retries — typical ~5.3 min | Completed — 139 of 300 samples (~46%) needed retries | Near-half retried; approaching limit |
| 50 | 2,000 | All completed, no retries — typical ~10.7 min | FAILED — 3 of 50 samples completed; 47 exhausted retries; POD restarts | Collapse at 50 concurrent users |
| 100 | 2,000 | All completed, no retries — typical ~19.9 min | FAILED — 6 of 100 samples completed; POD restarts | Collapse — Loop Cardinality drives failure |
| 300 | 2,000 (ramp 25 min) | All completed, no retries — typical ~22.5 min | 292 of 300 samples FAILED; PODs unresponsive | 97% failure, identical workload |
| 300 | 2,000 (ramp ~4 h) | All completed — typical ~7.5 min | 243 of 300 samples FAILED; PODs unresponsive | Pacing cannot rescue wrong heap setting |
Bulk Workflow Database Resource Usage at Heap 70%
The table below shows database CPU, memory and disk write volume for representative Bulk Workflow runs at heap 70%. DB CPU stayed below 23% and memory remained steady — consistent with the default-heap run shown earlier, confirming the database was never the bottleneck at either setting.
| Configuration | DB CPU (avg / peak) | DB memory available | Disk write ops/s | Data written |
|---|---|---|---|---|
| LP100 & LC 500 (heap 70%) | 7.8% / 12.5% | ~25%, steady | 13 / 39 | 6.0 GiB |
| LP100 & LC 1,000 (heap 70%) | 5.8% / 14.7% | ~26%, steady | 25 / 143 | 21.0 GiB |
| LP100 & LC 2,000 (heap 70%) | 4.6% / 22.6% | ~26%, steady | 13 / 67 | 41.0 GiB |
| LP300 & LC 2,000 & ramp 1,500 (heap 70%) | 4.5% / 20.6% | ~27%, steady | 21 / 150 | 104.7 GiB |
| LP300 & LC 2,000 & ramp 15,000 (heap 70%) | 5.4% / 18.1% | ~25%, steady | 19 / 99 | 139.9 GiB |
Why Heap 80% is not a safe middle ground: Load testing showed that 80% still causes async retries and POD scaling under the same Workloads that run cleanly at 70%. Retries consume extra capacity and mask the approaching limit.
Performance Recommendation
The benchmark results demonstrated that configuring MaxRAMPercentage=70.0 improved reliability and execution performance for the tested loop-heavy asynchronous Workflow workload. Under the same workload, the default setting of MaxRAMPercentage=95.0 resulted in increasing async retries, OData POD instability, and ultimately Workflow failures at higher load levels.
This recommendation is specific to the environment, Workflow design, and workload characteristics used in this benchmark. Customers should validate the configuration against their own workload requirements before applying it to production environments.
IFS Cloud Hosted Customers
Customers using IFS Cloud Hosted environments cannot modify OData POD JVM settings directly.
If evaluation of this recommendation is required, contact IFS Cloud Support to determine whether the configuration change is appropriate for the target environment and workload.
IFS Remote Customers
Remote customers can evaluate and apply this configuration change on the ifsapp-odata deployment. The ODP_JAVA_OPTS environment variable controls the JVM startup parameters used by the OData POD.
Recommended Configuration for the Tested Workload
The table below summarizes the configuration change required to apply this recommendation.
| Setting | Current (default) | Required |
|---|---|---|
| MaxRAMPercentage | 95.0 | 70.0 |
| Environment variable | ODP_JAVA_OPTS on ifsapp-odata deployment | — |
| POD restart required | Yes — the JVM must restart for the change to take effect | — |
| Impact during restart | Brief OData tier unavailability — plan during a low-traffic window | — |
Recommended ODP_JAVA_OPTS Value
Update only the MaxRAMPercentage parameter and retain all other JVM startup options unchanged.
Steps to Apply the Heap Setting
The table below lists the steps to apply and verify the heap setting change.
| Step | Action | Notes |
|---|---|---|
| A | Locate the ifsapp-odata Deployment | Use Lens or any a IFS Cloud infrastructure management interface |
| B | Find the ODP_JAVA_OPTS environment variable in the deployment spec | Contains multiple JVM flags — modify only MaxRAMPercentage |
| C | Change -XX:MaxRAMPercentage=95.0 to -XX:MaxRAMPercentage=70.0 | Keep all other flags unchanged |
| D | Apply the change and trigger a restart of the ifsapp-odata deployment | Use your Kubernetes management interface (e.g. Lens, or the IFS Cloud infrastructure tooling) or the equivalent kubectl command for your cluster setup |
| E | Confirm all POD replicas restarted and are in Running state | Verify via your Kubernetes management interface or cluster monitoring tooling before proceeding |
| F | Verify the new setting is active | Check the OData POD startup logs via your Kubernetes tooling and confirm the JVM started with -XX:MaxRAMPercentage=70.0 |
Rollback Considerations
If unexpected application behavior is observed after applying the configuration change, restore the previous MaxRAMPercentage value and restart the affected OData PODs.
Configuration changes should be introduced through normal change management processes and validated in a non-production environment whenever possible before adoption in production systems.
Monitor Workflow Health
After applying the heap setting change, use the checks below to confirm the environment is behaving as expected and to catch any early warning signs of heap pressure.
Check Async Workflow Retries and Failures
Run the following against the IFS database to check for retried or failed async executions for your tested Workflows. On a correctly configured system (if no Workflow failures has occurred), all rows should have RETRY_COUNT = 1:
SELECT BPA_KEY, STATUS, RETRY_COUNT, ROWVERSION
FROM   BPA_ASYNC_SYS_AUDIT_TAB
WHERE  RETRY_COUNT > 1 OR STATUS = 'FAILED'
ORDER  BY ROWVERSION DESC;
| Result | Interpretation | Action |
|---|---|---|
| No rows returned | All executions completing on first attempt — system is healthy | No action required |
| Rows with RETRY_COUNT = 2 or 3 | Early warning of heap pressure — retries appear before failures | Review Workflow loop complexity; confirm MaxRAMPercentage = 70% |
| Rows with STATUS = FAILED | Executions exhausted all 3 retry attempts — immediate attention required | Escalate; verify heap setting; review POD memory metrics |
Check OData POD Restarts
Multiple distinct PODs registering in a short window indicates unexpected scaling or restarts:
SELECT POD_NAME, POD_STARTUP_TIME, LAST_UPDATED
FROM   BPA_POD_HISTORY_TAB
ORDER  BY POD_STARTUP_TIME DESC;
Workflow Health Indicators
The table below summarizes the indicators to monitor and the action to take if each one is NOT met.
| Indicator | Expected (healthy) | Action if not met |
|---|---|---|
| Async retry count | All executions complete on 1st attempt (RETRY_COUNT = 1) | Review Workflow loop complexity and trigger volume; verify heap setting |
| FAILED executions | Zero | Escalate; verify MaxRAMPercentage; check POD restart events |
| POD restarts | None during Workflow execution windows | Confirm the configuration change was applied and the POD restarted |
| DB CPU | < 25% average even during heaviest runs | If DB CPU is high, investigate query plans; this was not observed in testing |
Early-warning signal: Retries appear before failures. At heap 95%: 11 retried at LC 500 → 28 retried at LC 750 → 139 retried at LC 1,000 → complete failure at LC 2,000. Monitoring RETRY_COUNT > 1 gives advance warning of approaching collapse. On a correctly configured system, the expected retry count is 1 (complete on 1st attempt) for your tested Workflows.
Benchmark Summary and Conclusions
The benchmark shows that IFS Cloud BPA Workflows can execute reliably at substantial load when Workflow complexity, trigger arrival rate, OData POD memory configuration, and environment capacity are aligned. The figures below describe the tested operating envelope of the dedicated Large (L) environment used for this benchmark. They are sizing examples, not platform-wide limits, guarantees, or service-level commitments.
Simple Synchronous Workflow Summary
The Simple Workflow represented a lightweight request/response pattern without loops. Each execution performed three database interactions against a wide 184-attribute entity and completed within the triggering request.
Tested Capacity and Results
| Test scenario | Tested workload | Observed result |
|---|---|---|
| Concurrent execution | 300 concurrent users, one Workflow per user | 300 of 300 completed without errors when ramped over 900 seconds. Median response time was 1,098 ms and the 95th percentile was 1,144 ms. |
Endurance execution at heap (MaxRAMPercentage) 95% | 3,850 executions over approximately 70 minutes | All Workflow instances completed. Measured throughput was approximately 55 Workflows per minute. Two isolated HTTP 500 responses were reported by the load tool, but Workflow engine history confirmed successful completion. |
Endurance execution at heap (MaxRAMPercentage) 70% | 2,913 executions over approximately 55 minutes | The test sustained approximately 53 Workflows per minute. Response time and resource utilization remained consistent with the heap 95% test. |
| Database utilization | Simple Workflow endurance and burst tests | Average database CPU remained between 2.2% and 2.9%, with peak usage between 4.6% and 10.5%. |
Simple Workflow Conclusion
- Up to 300 concurrent simple synchronous Workflows were tested successfully when ramped over 900 seconds.
- The endurance tests sustained approximately 53–55 completed Workflows per minute.
- Median response time remained close to 1.1 seconds at the tested load levels.
- Lowering JVM param
MaxRAMPercentagefrom 95% to 70% had no measurable effect on this Workflow pattern. - Database utilization remained low, indicating that the database was not a limiting component for the tested Simple Workflow.
For a comparable Large environment, 300 concurrent executions and approximately 53–55 executions per minute can be used as tested reference points for a simple Workflow of similar complexity. The per-minute result reflects the configured test pacing and must not be interpreted as the maximum platform capacity.
Bulk Asynchronous Workflow Summary
The Bulk Workflow represented a loop-heavy asynchronous pattern. Each instance created and deleted records using sequential loops. At Loop Cardinality 2,000, one Workflow performed approximately 4,002 database interactions.
Tested Capacity and Results
| Test scenario | Tested workload | Observed result |
|---|---|---|
Peak workload at heap (MaxRAMPercentage) 70% | 300 concurrent Workflow instances, each with Loop Cardinality 2,000, ramped over 1,500 seconds | 300 of 300 completed on the first attempt, with no retries, POD scaling, or POD restarts. Median duration was 1,353.1 seconds. |
| Peak workload with extended pacing | 300 concurrent Workflow instances, each with Loop Cardinality 2,000, ramped over 15,000 seconds | All Workflows completed. Median duration decreased to 449.3 seconds. |
Peak workload at heap (MaxRAMPercentage) 80% | 300 concurrent Workflow instances, each with Loop Cardinality 2,000 | All Workflows completed, but completion required retries or POD scaling, and executions took longer. |
Peak workload at heap (MaxRAMPercentage) 95% | 300 concurrent Workflow instances, each with Loop Cardinality 2,000, ramped over 1,500 seconds | Only 8 of 300 completed. The remaining 292 failed, and the OData PODs became unresponsive. |
Database utilization at heap (MaxRAMPercentage) 70% | 300 concurrent instances with Loop Cardinality 2,000 | Database CPU averaged 4.5%, peaked at 20.6%, and available database memory remained steady at approximately 27%. |
Bulk Workflow Conclusion
- At
MaxRAMPercentage=70.0, the environment safely completed 300 concurrent asynchronous Workflows, each with a Loop Cardinality of 2,000. - The successful peak test represented 600,000 create iterations, 600,000 delete iterations, and approximately 1.2 million database interactions across the run.
- All 300 instances completed on the first attempt, with zero retries, zero failures, and no POD restarts.
- Increasing the ramp from 1,500 to 15,000 seconds reduced median duration from 1,353.1 seconds to 449.3 seconds, demonstrating the effect of trigger pacing and queueing.
- The identical workload was not safe at the default 95% heap setting, where 292 of 300 Workflow instances failed.
- Retries appeared before complete failure at heap 95%: 11 of 300 instances retried at Loop Cardinality 500, 28 at 750, and 139 at 1,000. Therefore,
RETRY_COUNT > 1should be treated as an early capacity warning. - Database CPU remained below 23% during the heavy tests. The observed failures were associated with application-tier memory pressure rather than database exhaustion.
For a comparable Large environment with MaxRAMPercentage=70.0, 300 concurrent asynchronous Workflows with Loop Cardinality 2,000 can be used as the tested upper reference point from this benchmark. This is not a general safe limit for all asynchronous Workflows because entity width, loop design, payload size, nested loops, trigger arrival rate, environment size, and competing workloads can materially change capacity.
Overall Interpretation
- Use the Simple Workflow figures when the Workflow contains a small number of steps, no loops, and completes within the triggering request.
- Use the Bulk Workflow figures when the Workflow runs asynchronously and performs high-volume sequential loop processing.
- Do not combine the two figures into a single daily Workflow limit. The execution cost of the two patterns is substantially different.
- Before production rollout, repeat the benchmark with representative business data and competing workloads. Monitor async retries, failed executions, OData POD restarts, Workflow duration, and infrastructure utilization.
Frequently Asked Questions
| Question | Guidance |
|---|---|
| How many Workflows can be safely executed in an IFS Cloud environment? | There is no universal execution limit that applies to every IFS Cloud environment. Workflow capacity depends on multiple factors, including Workflow complexity, Loop Cardinality, entity size, environment sizing, available OData and database resources, heap configuration, trigger arrival rate, and competing workloads. Use the benchmark results in this article as a sizing reference only for environments and Workflow designs that are similar to the tested configuration. |
| Is there a daily Workflow execution limit? | No platform-wide daily execution limit is defined for IFS Workflows. Capacity should be assessed based on the characteristics of the specific Workflow and the resources available in the target environment. For high-volume implementations, perform representative load testing and monitor Workflow retries, failures, and OData POD health before deploying to production. |
| What qualifies as a high-frequency or high-volume workflow? | IFS does not define a single numeric threshold for what constitutes a high-frequency or high-volume Workflow. In general, a Workflow should be considered high volume when it involves large numbers of concurrent triggers, large or unbounded loops, wide payloads, or long-running processing. These characteristics are discussed in Potentially Unsuitable Use Cases and Characteristics of a Complex Workflow. High-volume Workflow designs should always be validated through representative performance testing before being deployed to production environments. |
| Why can Online SQL process large data volumes more efficiently than a Workflow? | A Workflow is not a database script. It runs in the Workflow engine inside the OData POD, persists execution state, and typically calls projections through IFS API tasks. Online SQL runs in the database and does not carry that middle-tier cost. IFS Workflows are intended for process automation — validations, user input and enriching an existing process — not for heavy or high-volume data processing. For large-scale data work, prefer alternatives such as Layered Application Architecture customizations or schedule tasks. See Select the correct use case and Potentially Unsuitable Use Cases. |
| How can Workflow performance be improved? | Consider the optimization recommendations described in Performance Improvement Tips |
| How should these benchmark results be used? | Use the benchmark results as a reference for comparing: Workflow design complexity, Loop Cardinality, Entity size and attribute count, Environment size, Heap configuration, Trigger concurrency and arrival patterns Actual performance may vary significantly depending on environment configuration and competing business workloads. Always validate expected production workloads through representative testing. |