Log monitoring - EFK Stack
EFK - Elasticsearch, Fluentd, and Kibana
-
Elasticsearch is a distributed and scalable search engine, used commonly to sift through large volumes of log data. Its' primary purpose is to store and retrieve logs from fluentd.
-
Fluentd is a log shipper. It is an open-source log collection agent which supports multiple data sources and output formats. It can also forward logs to elasticsearch. Fluentd is a unifying layer between systems that generate and store log data.
-
Kibana is a UI tool for querying, data visualization and dashboards. It is a query engine which allows exploring log data through a web interface, building visualizations for events logs, and is query-specific to filter information for detecting issues. Virtually any type of dashboard can be built using Kibana. Kibana Query Language (KQL) is used for querying elasticsearch data. Here Kibana is used to query index data in elasticsearch.
NOTE: The data retention period of Elasticsearch is 7 days. (This means logs can be accessed only for the past 7 days, including the current day. A curator-cronjob will be run daily to check and delete logs which are older than 7 days).
Content:
-
How to Access Kibana Dashboard
-
How to Create Index Pattern
-
How to Discover Kibana Logs
-
How to Import Kibana Dashboards
-
How to View Dashboards
-
How to Query Container Logs using KQL
How to Access Kibana Dashboard
1. Browse the Kibana Dashboard of IFS Remote Solution [Log in to Kibana]
- e.g. Browse to https://Linuxhost/kibana
2. Authentication
-
The user must enter the username and password to log in to dashboards.
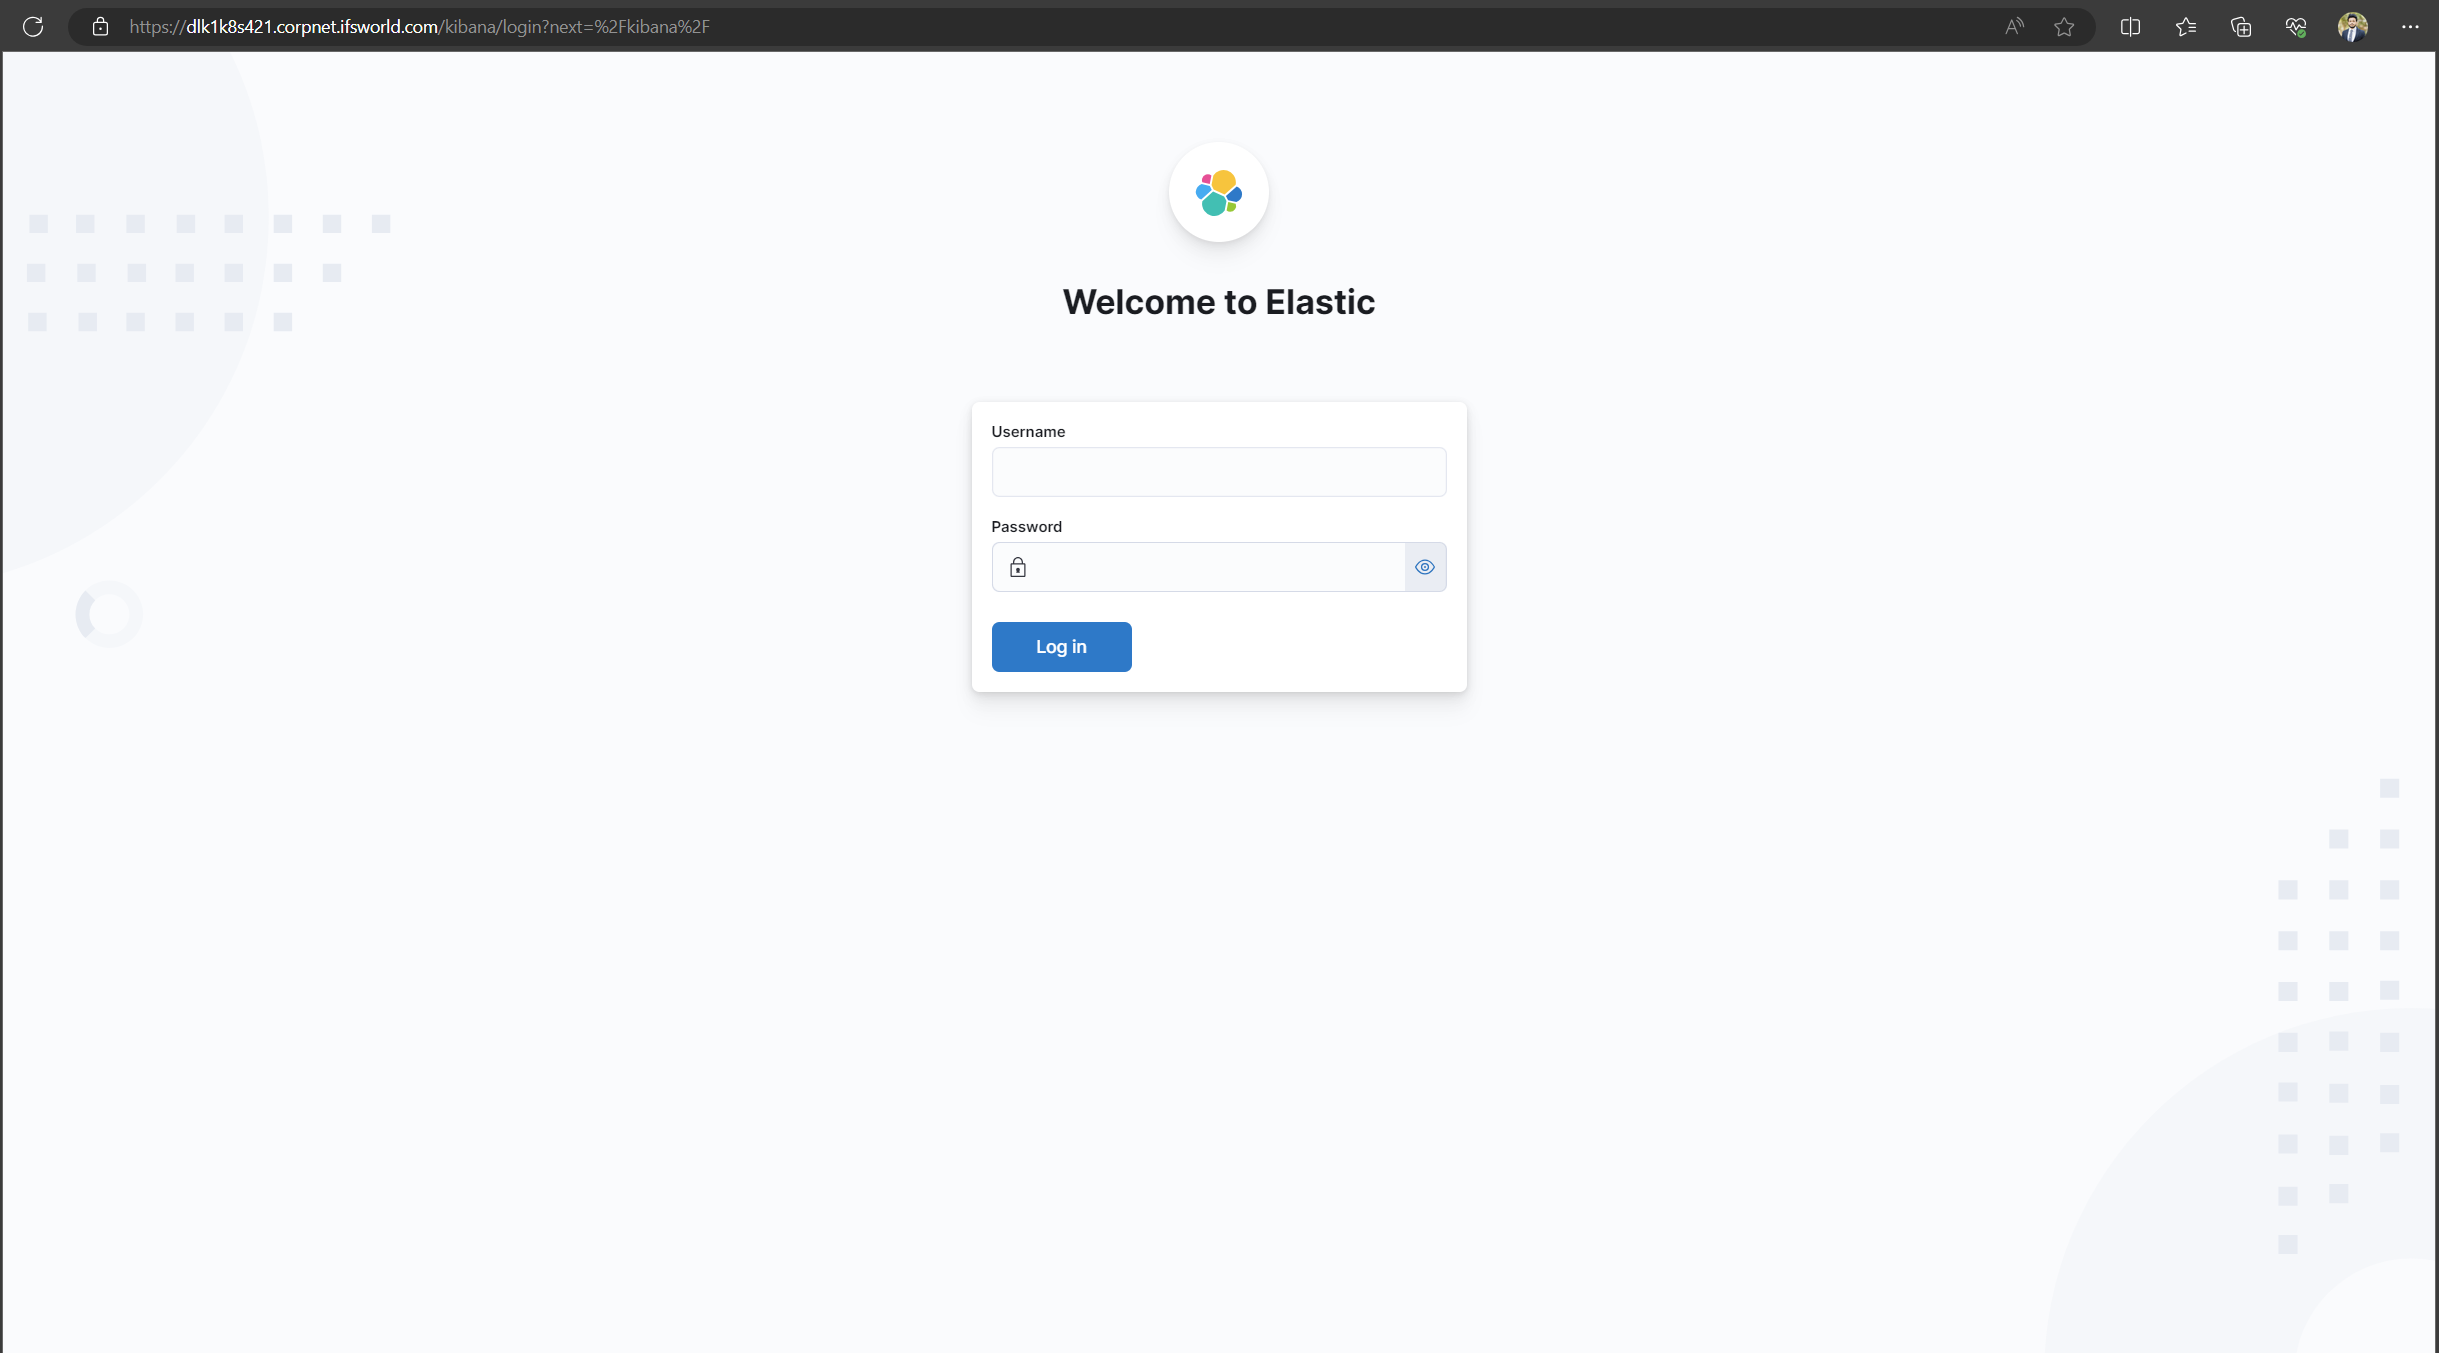
-
The user can extract the username and password from the IFS-Remote file location in their windows machine: ifsroot > config > secrets > kibana_creds file
-
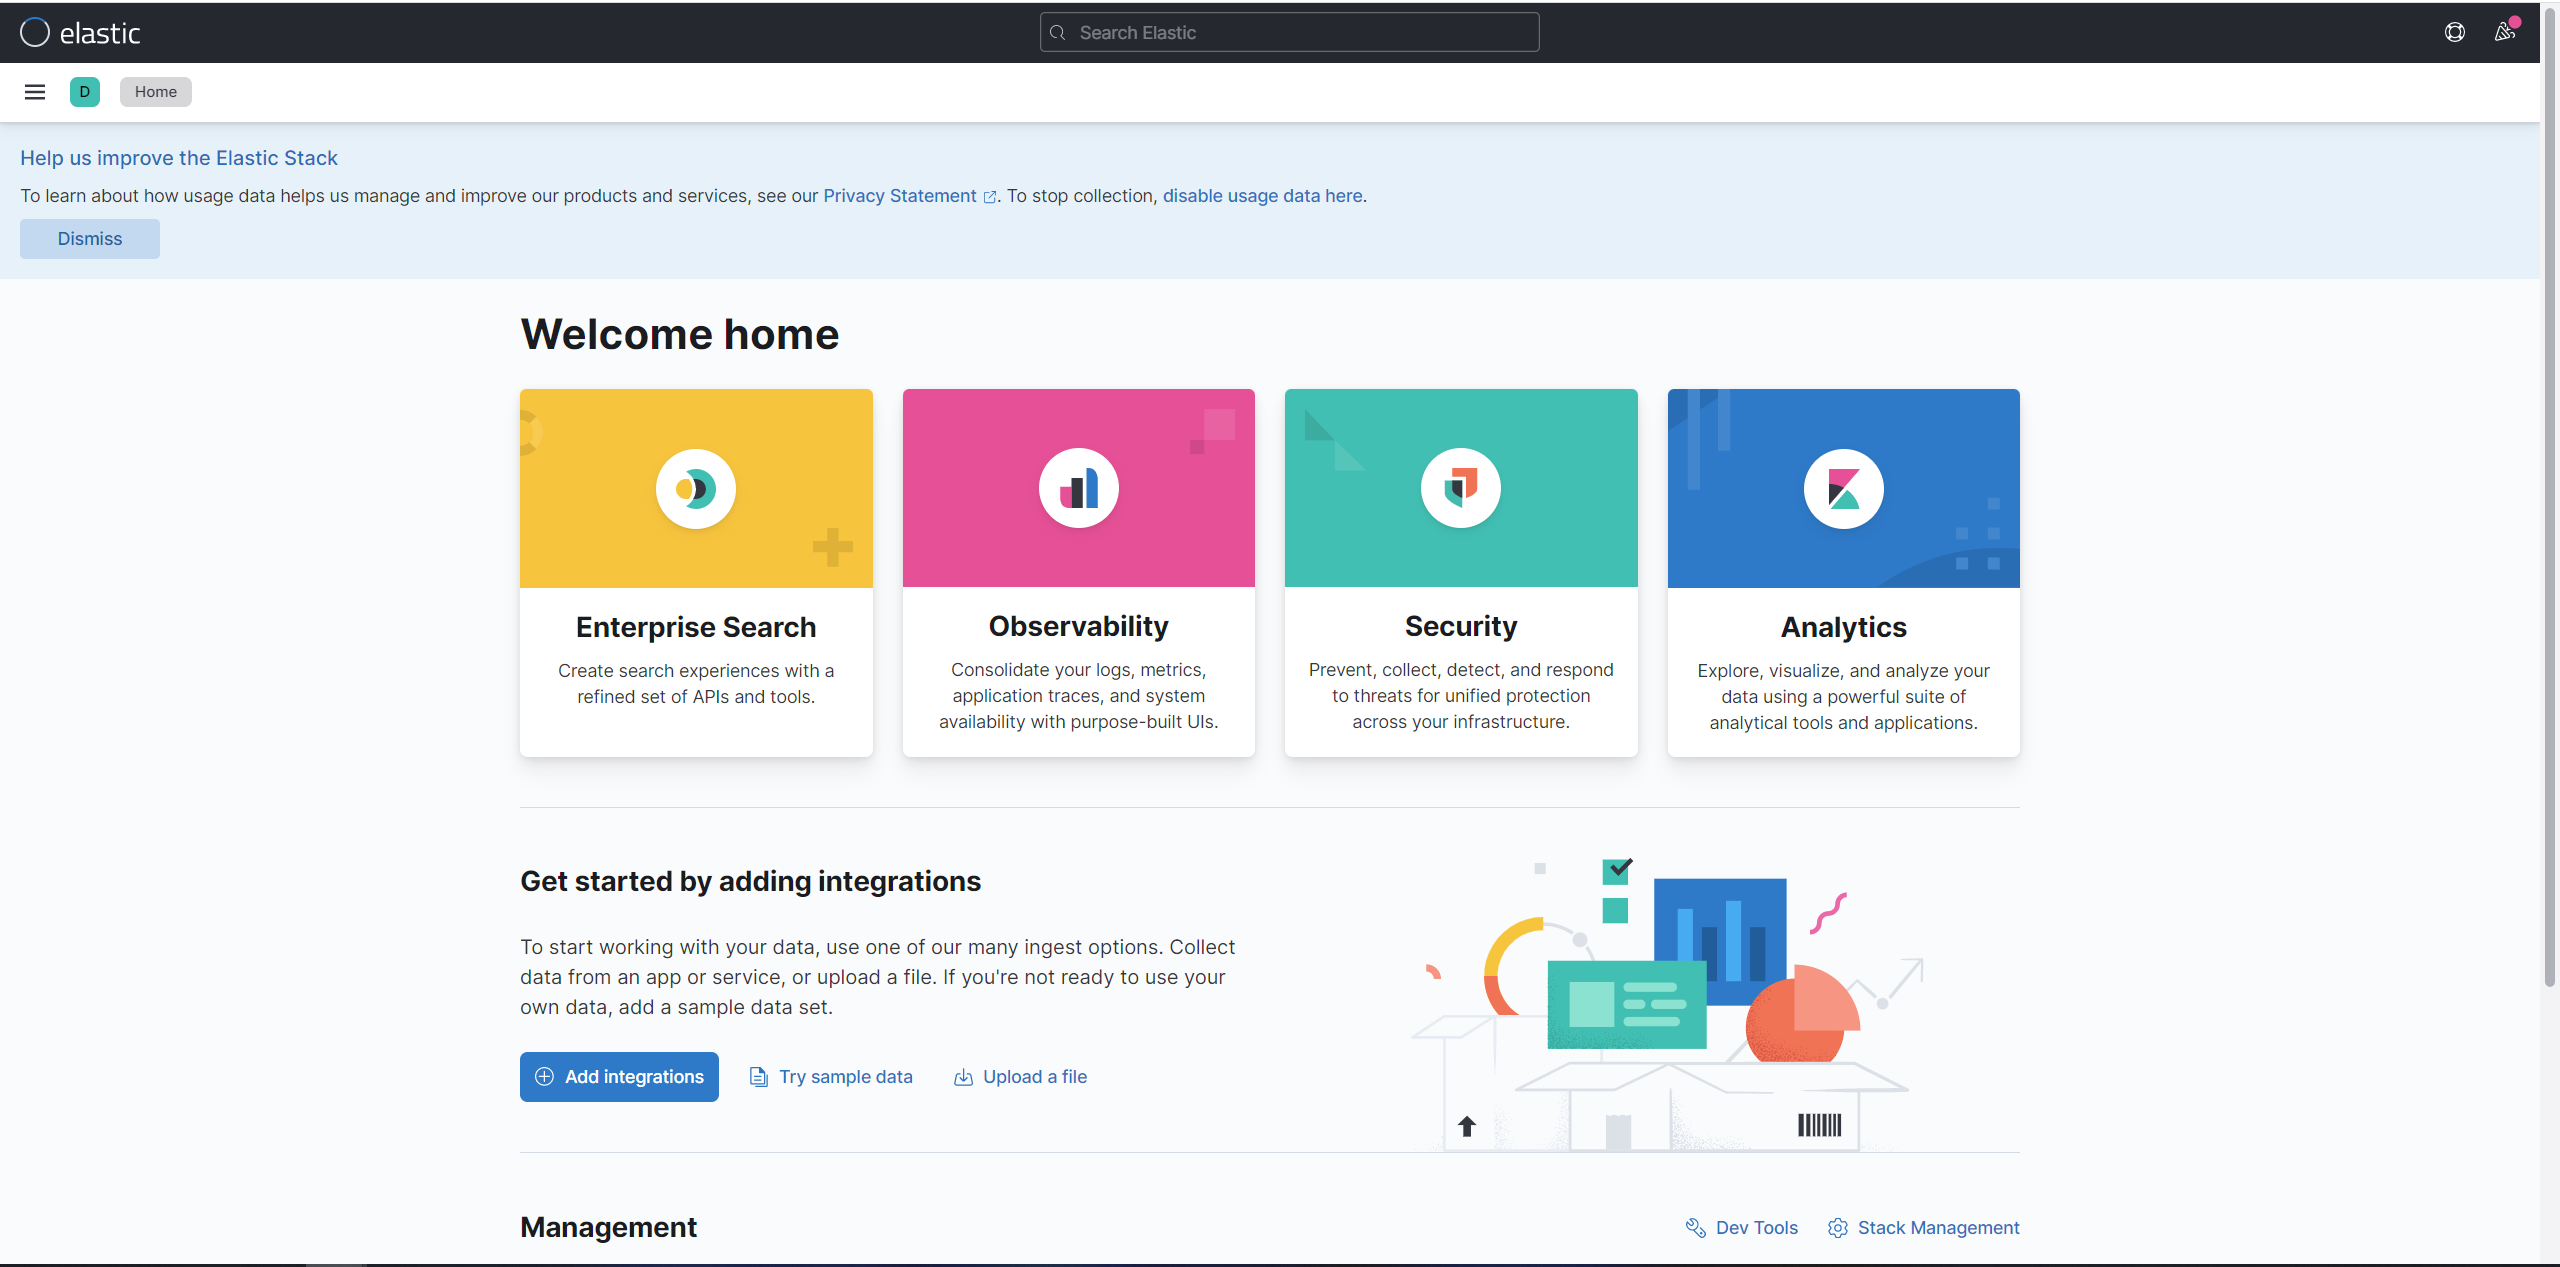
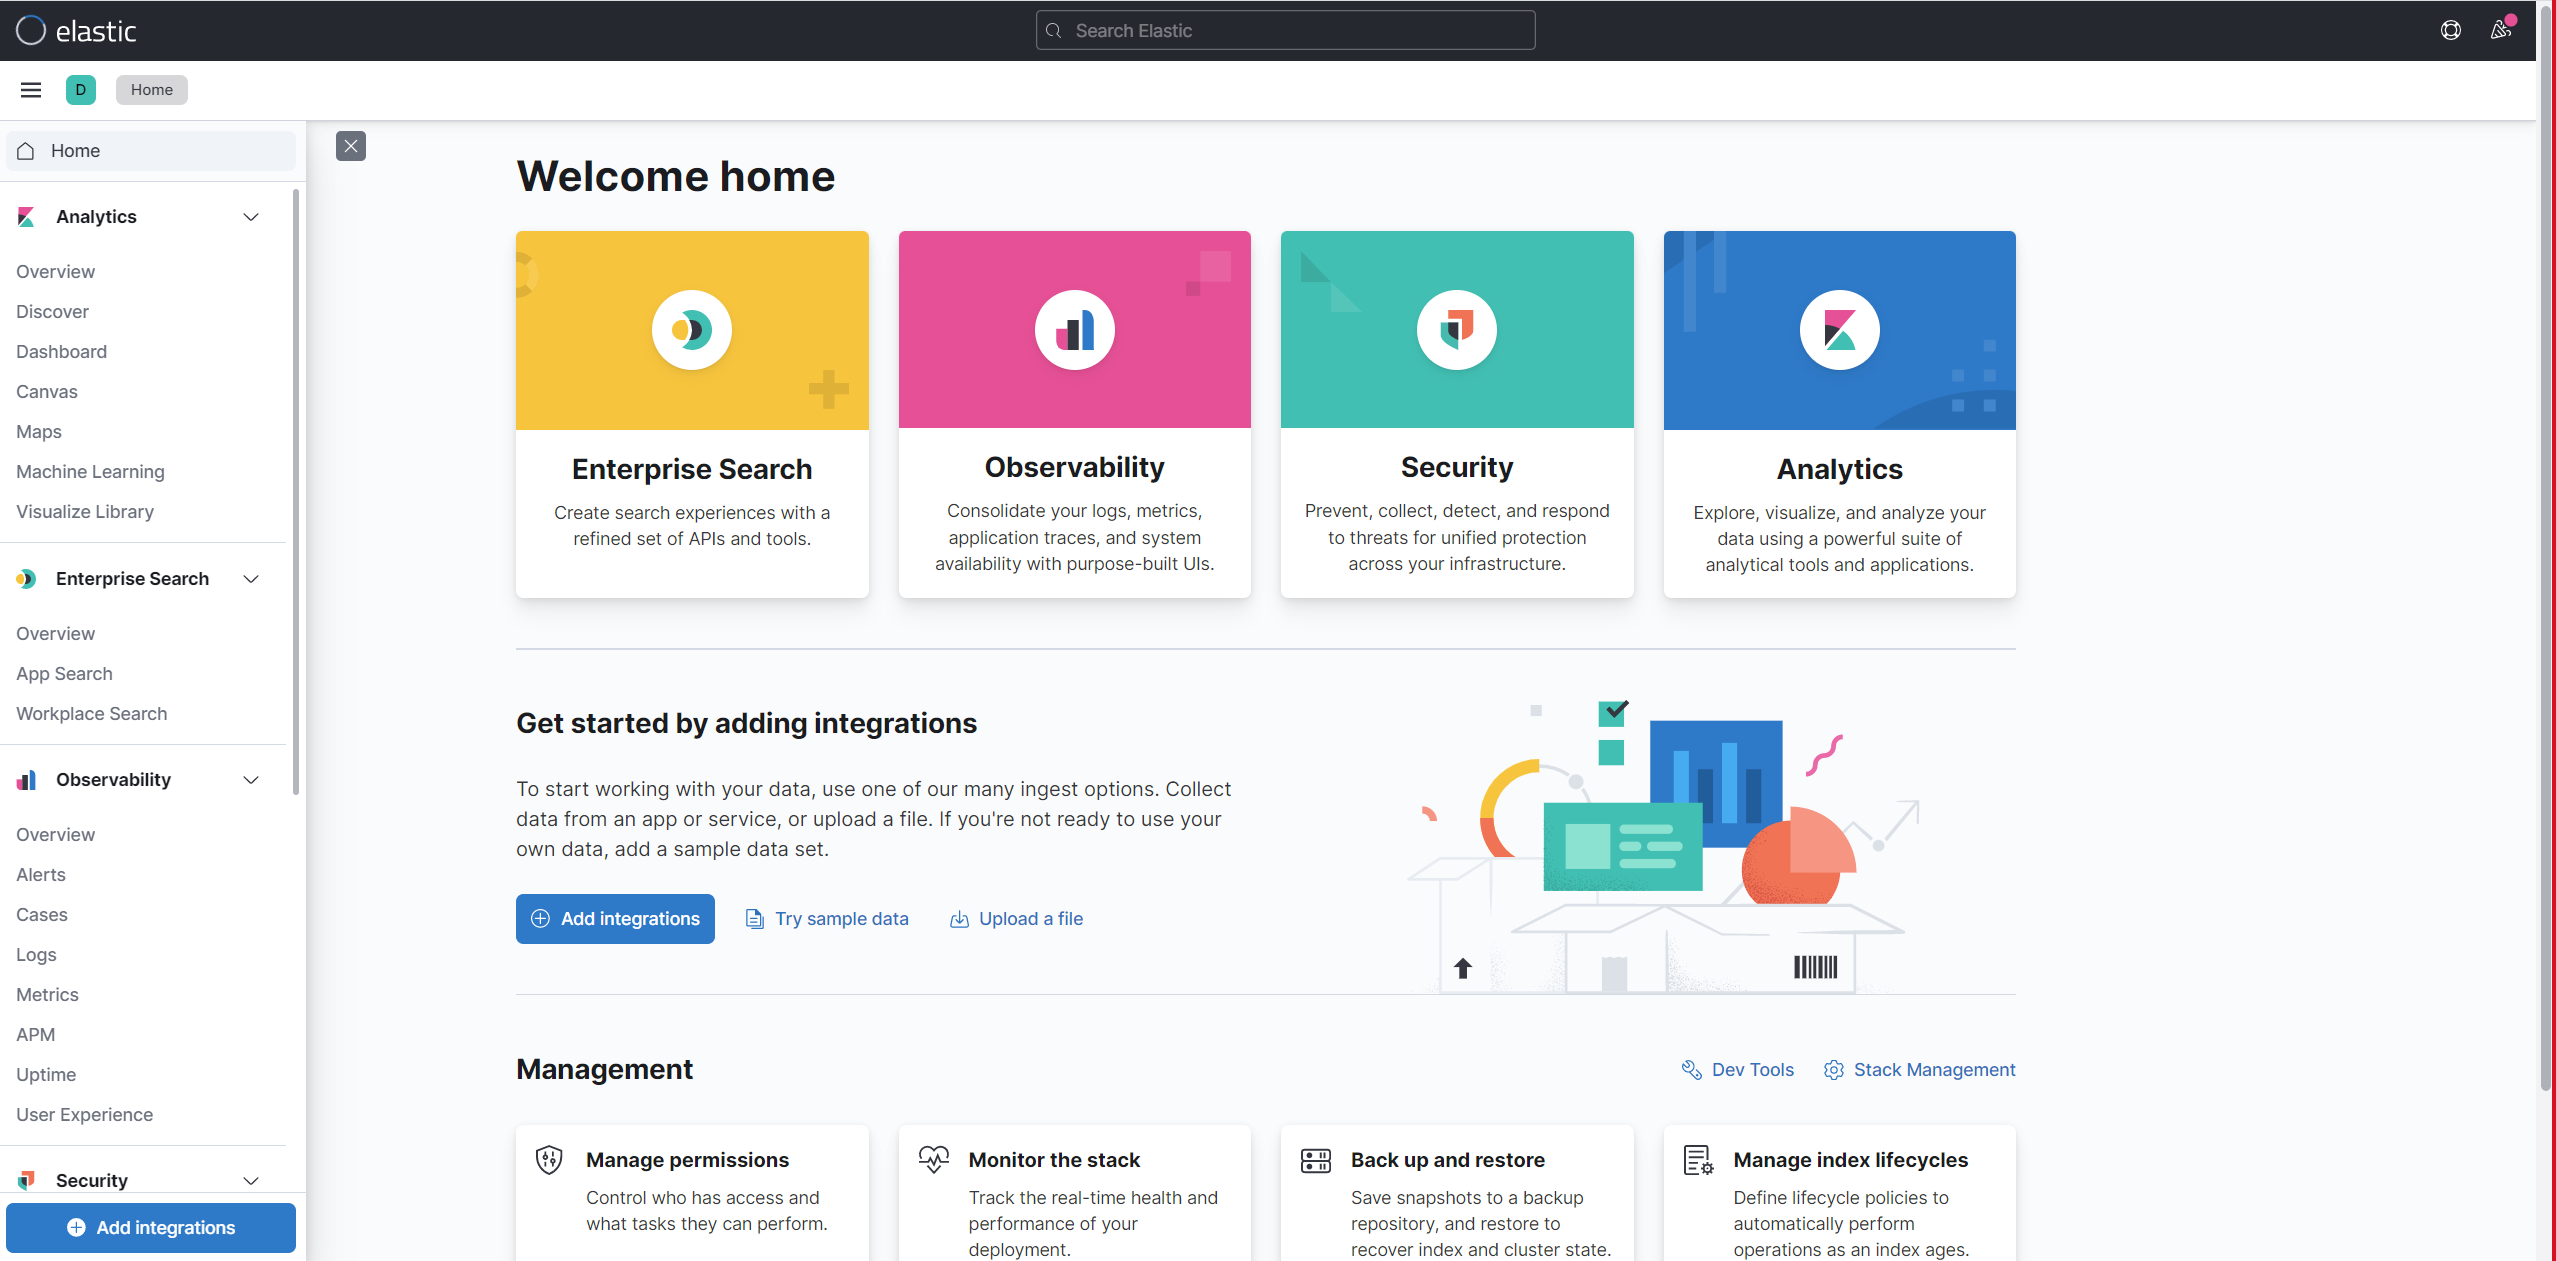
Kibana Home
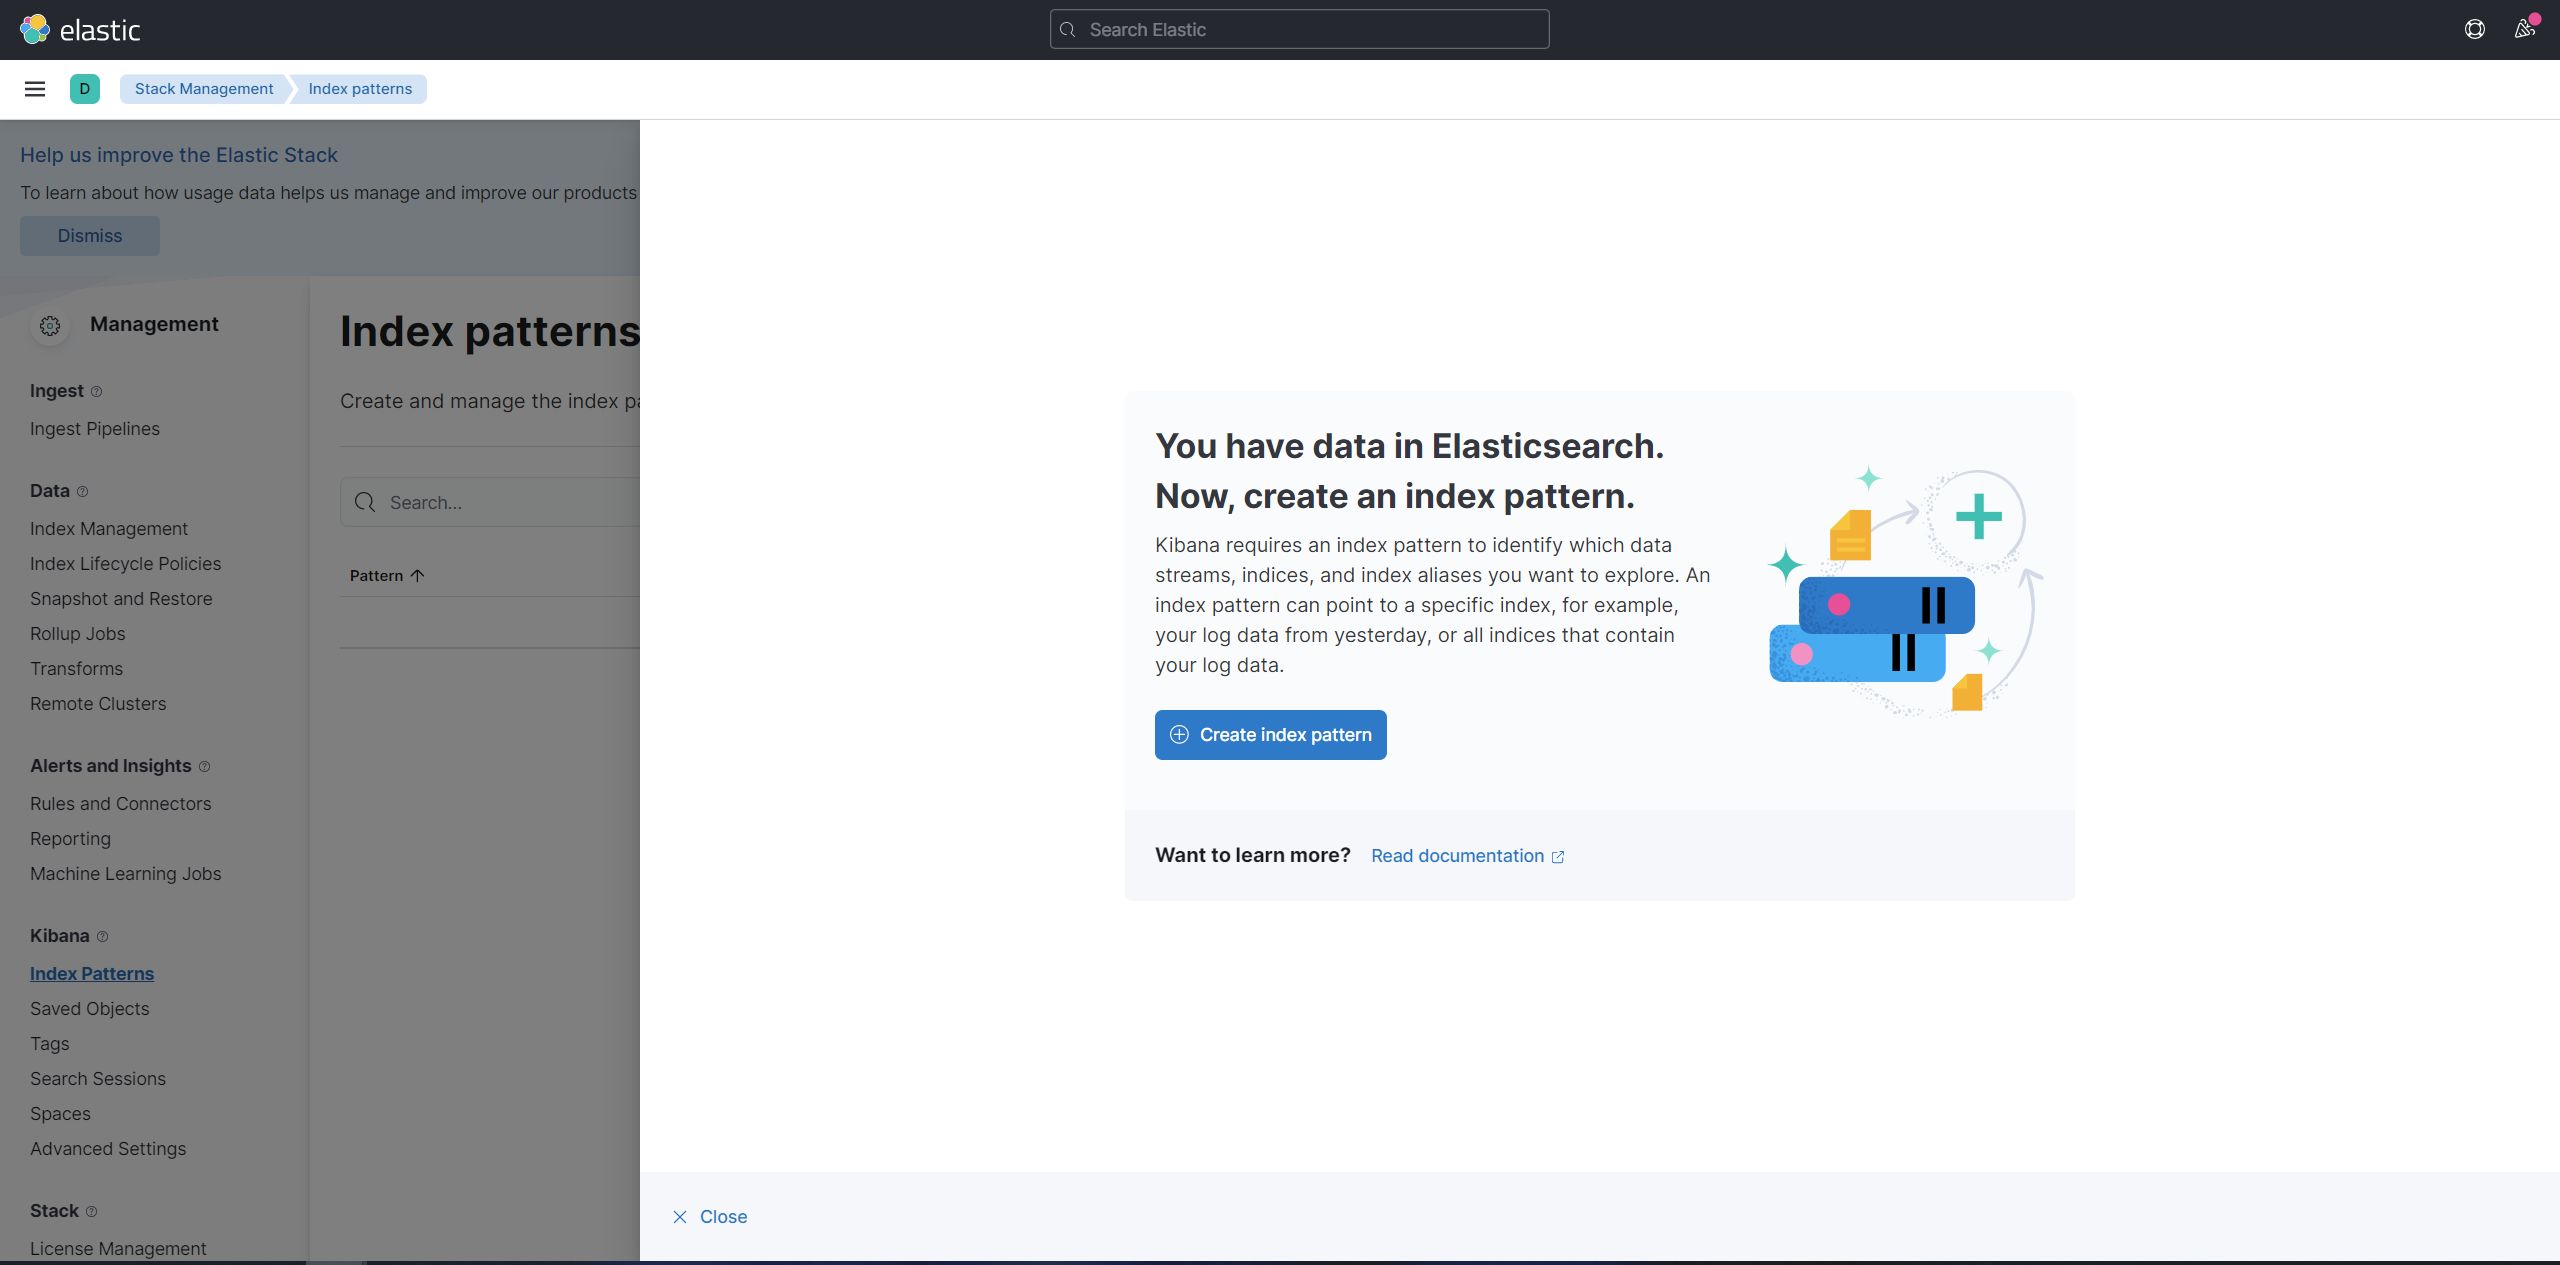
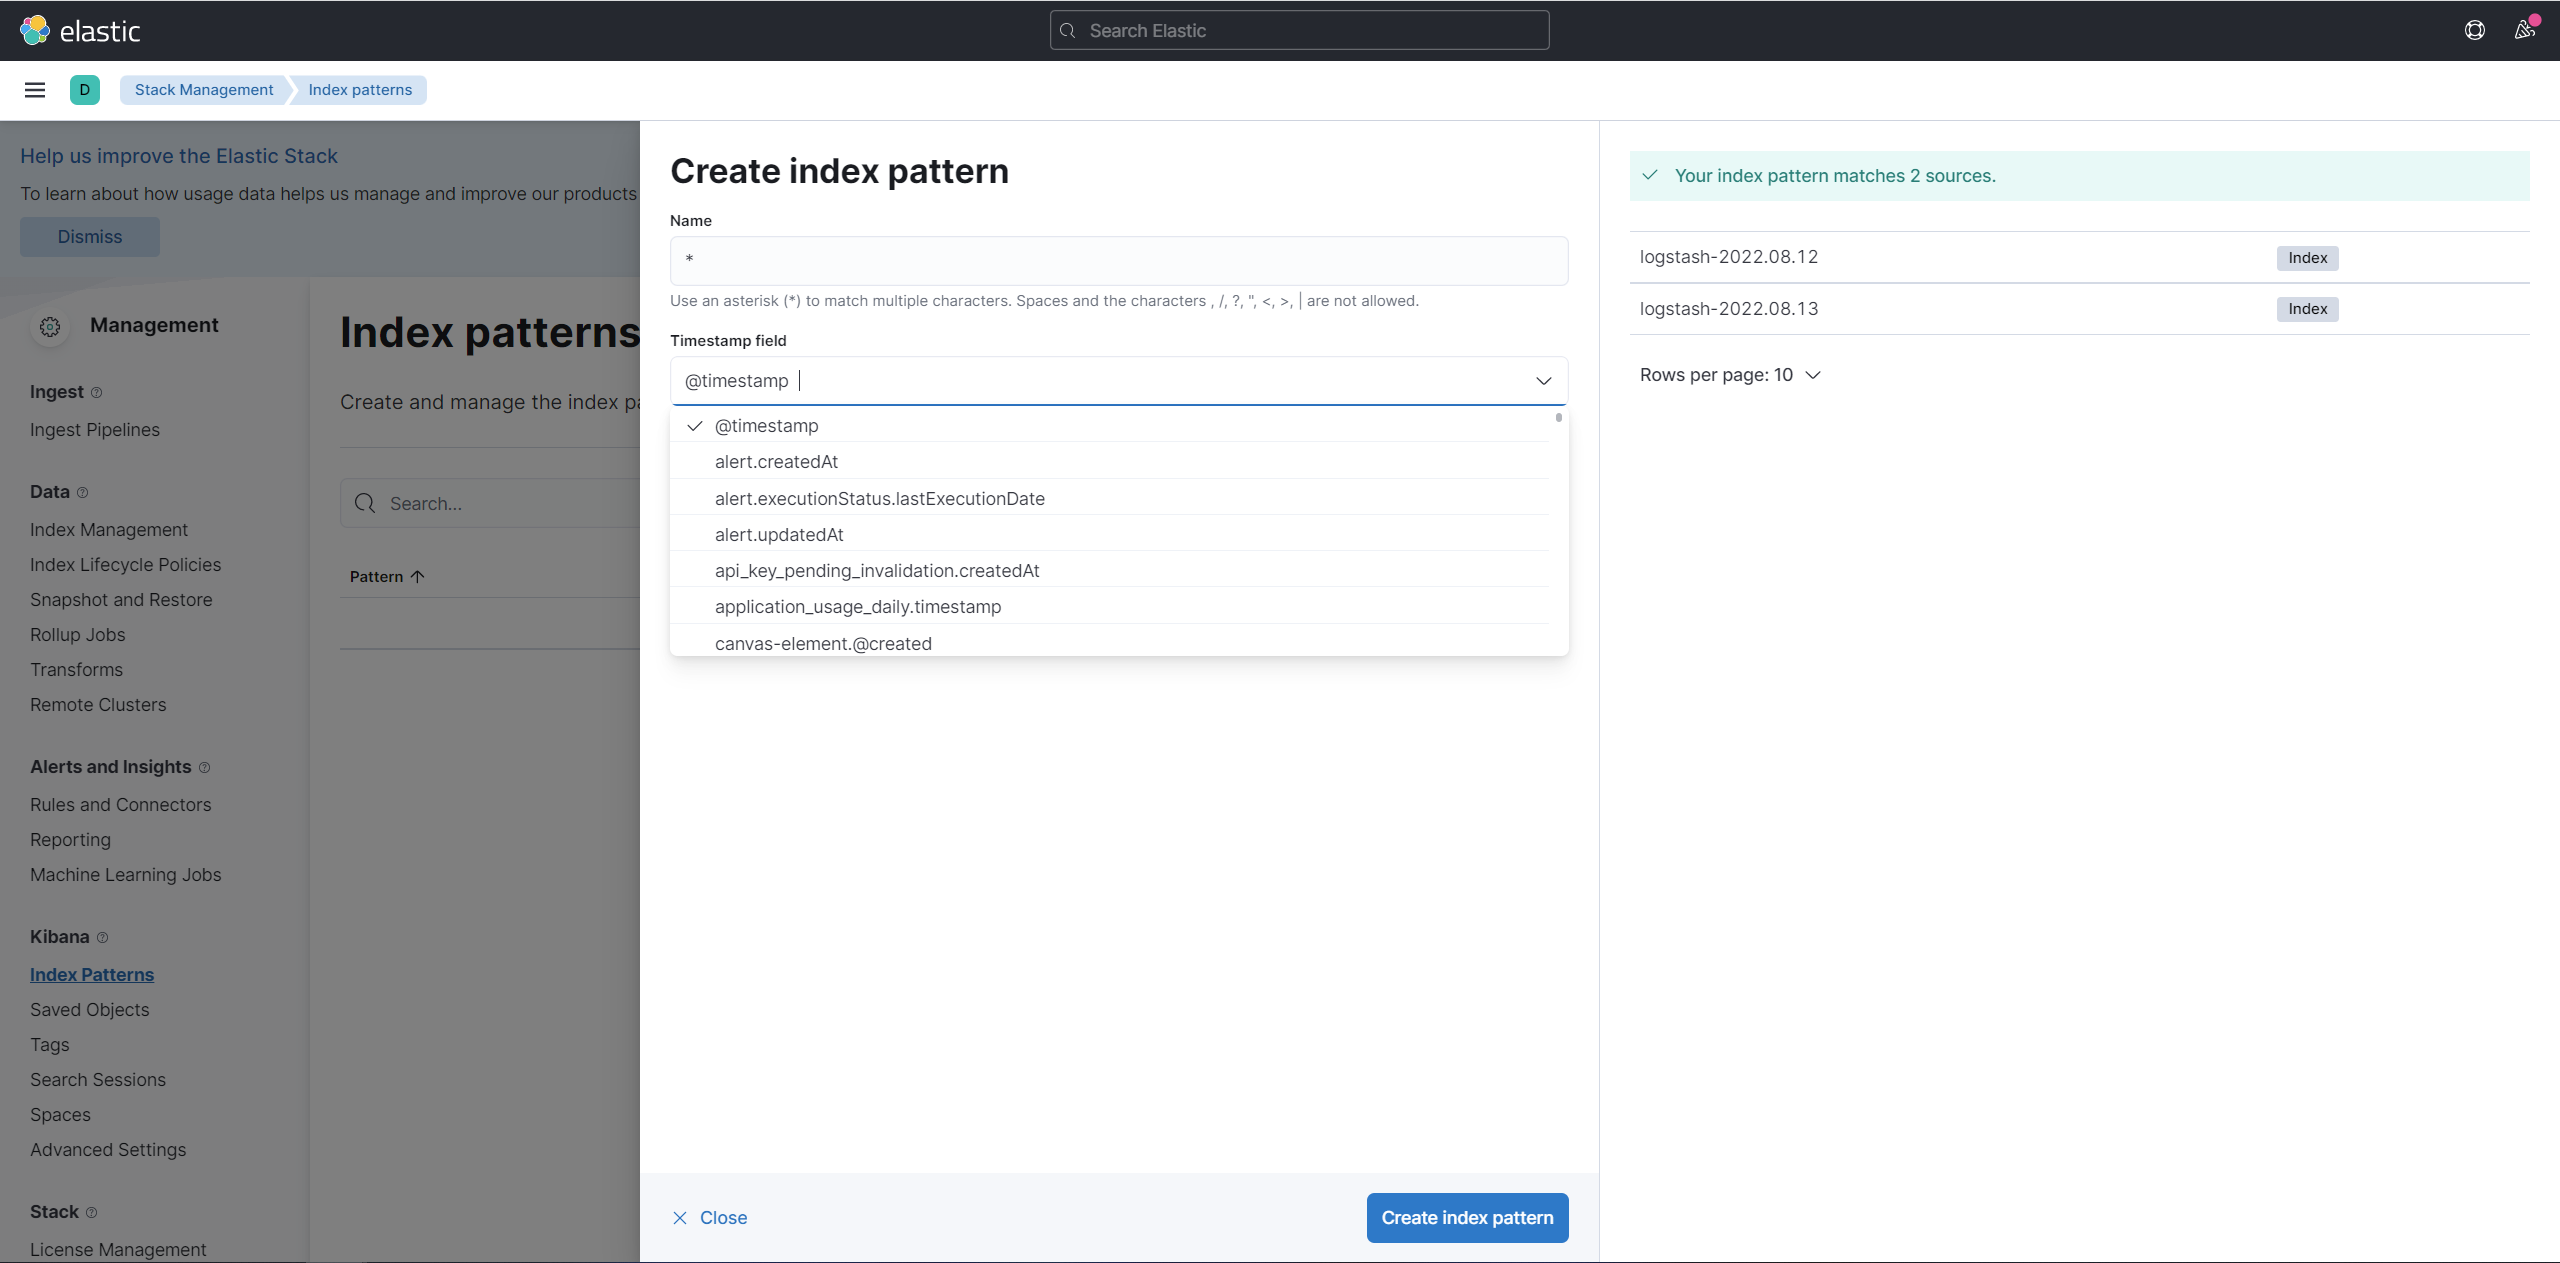
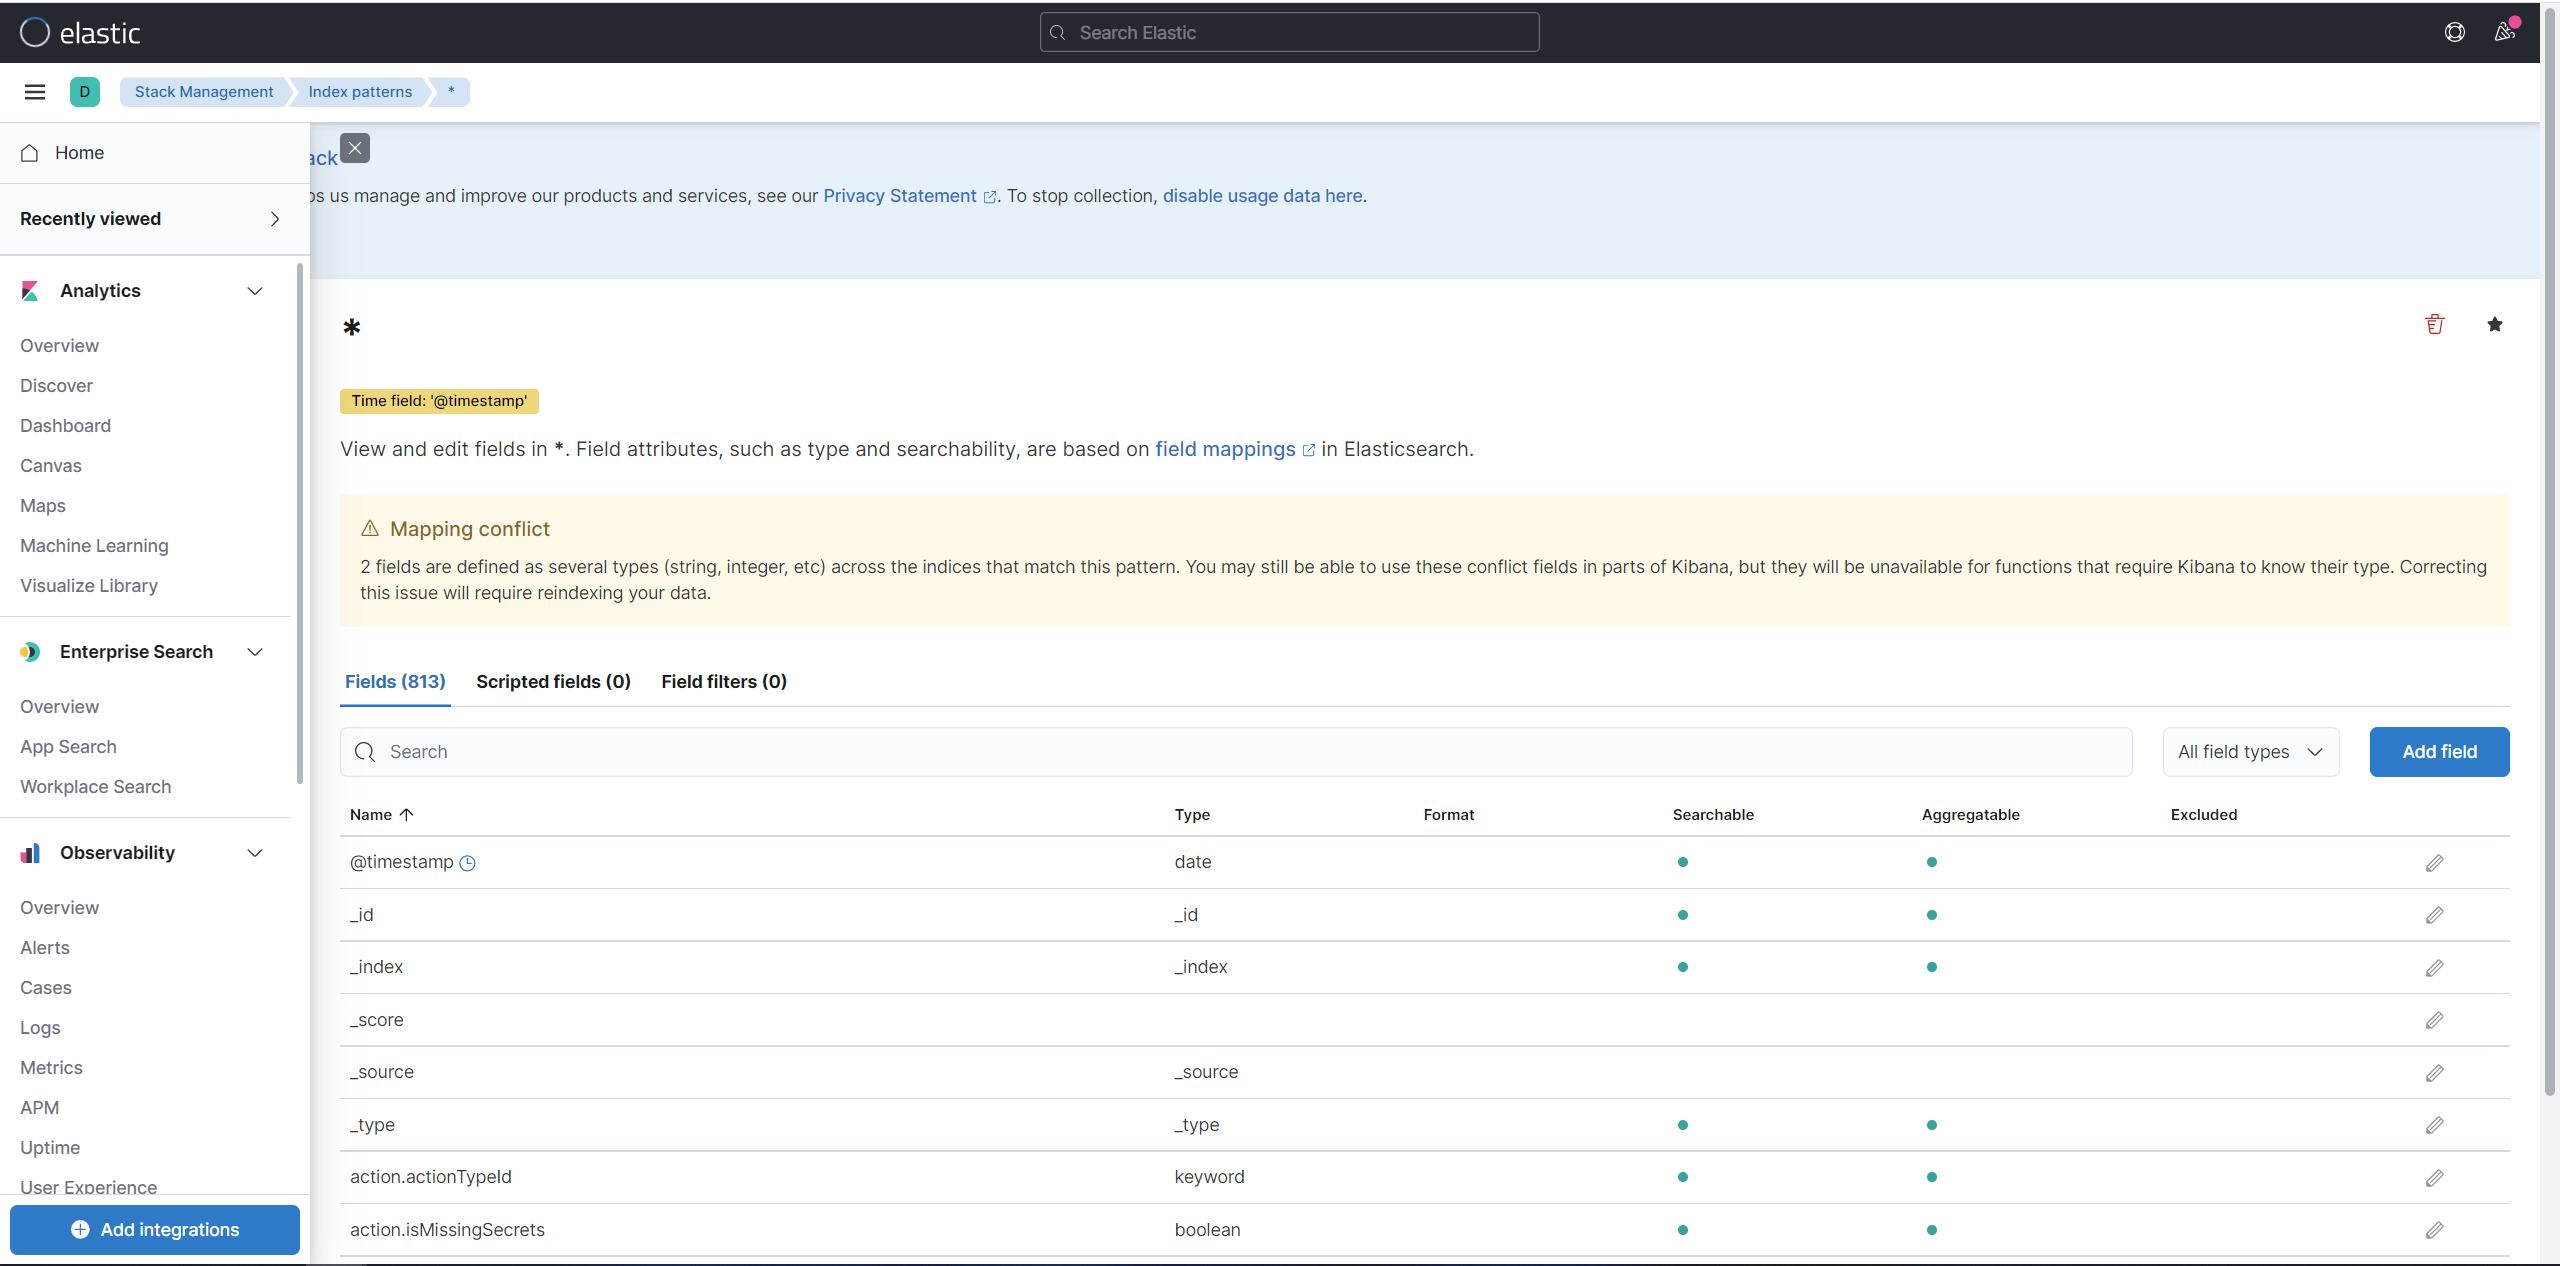
How to Create Index Pattern
-
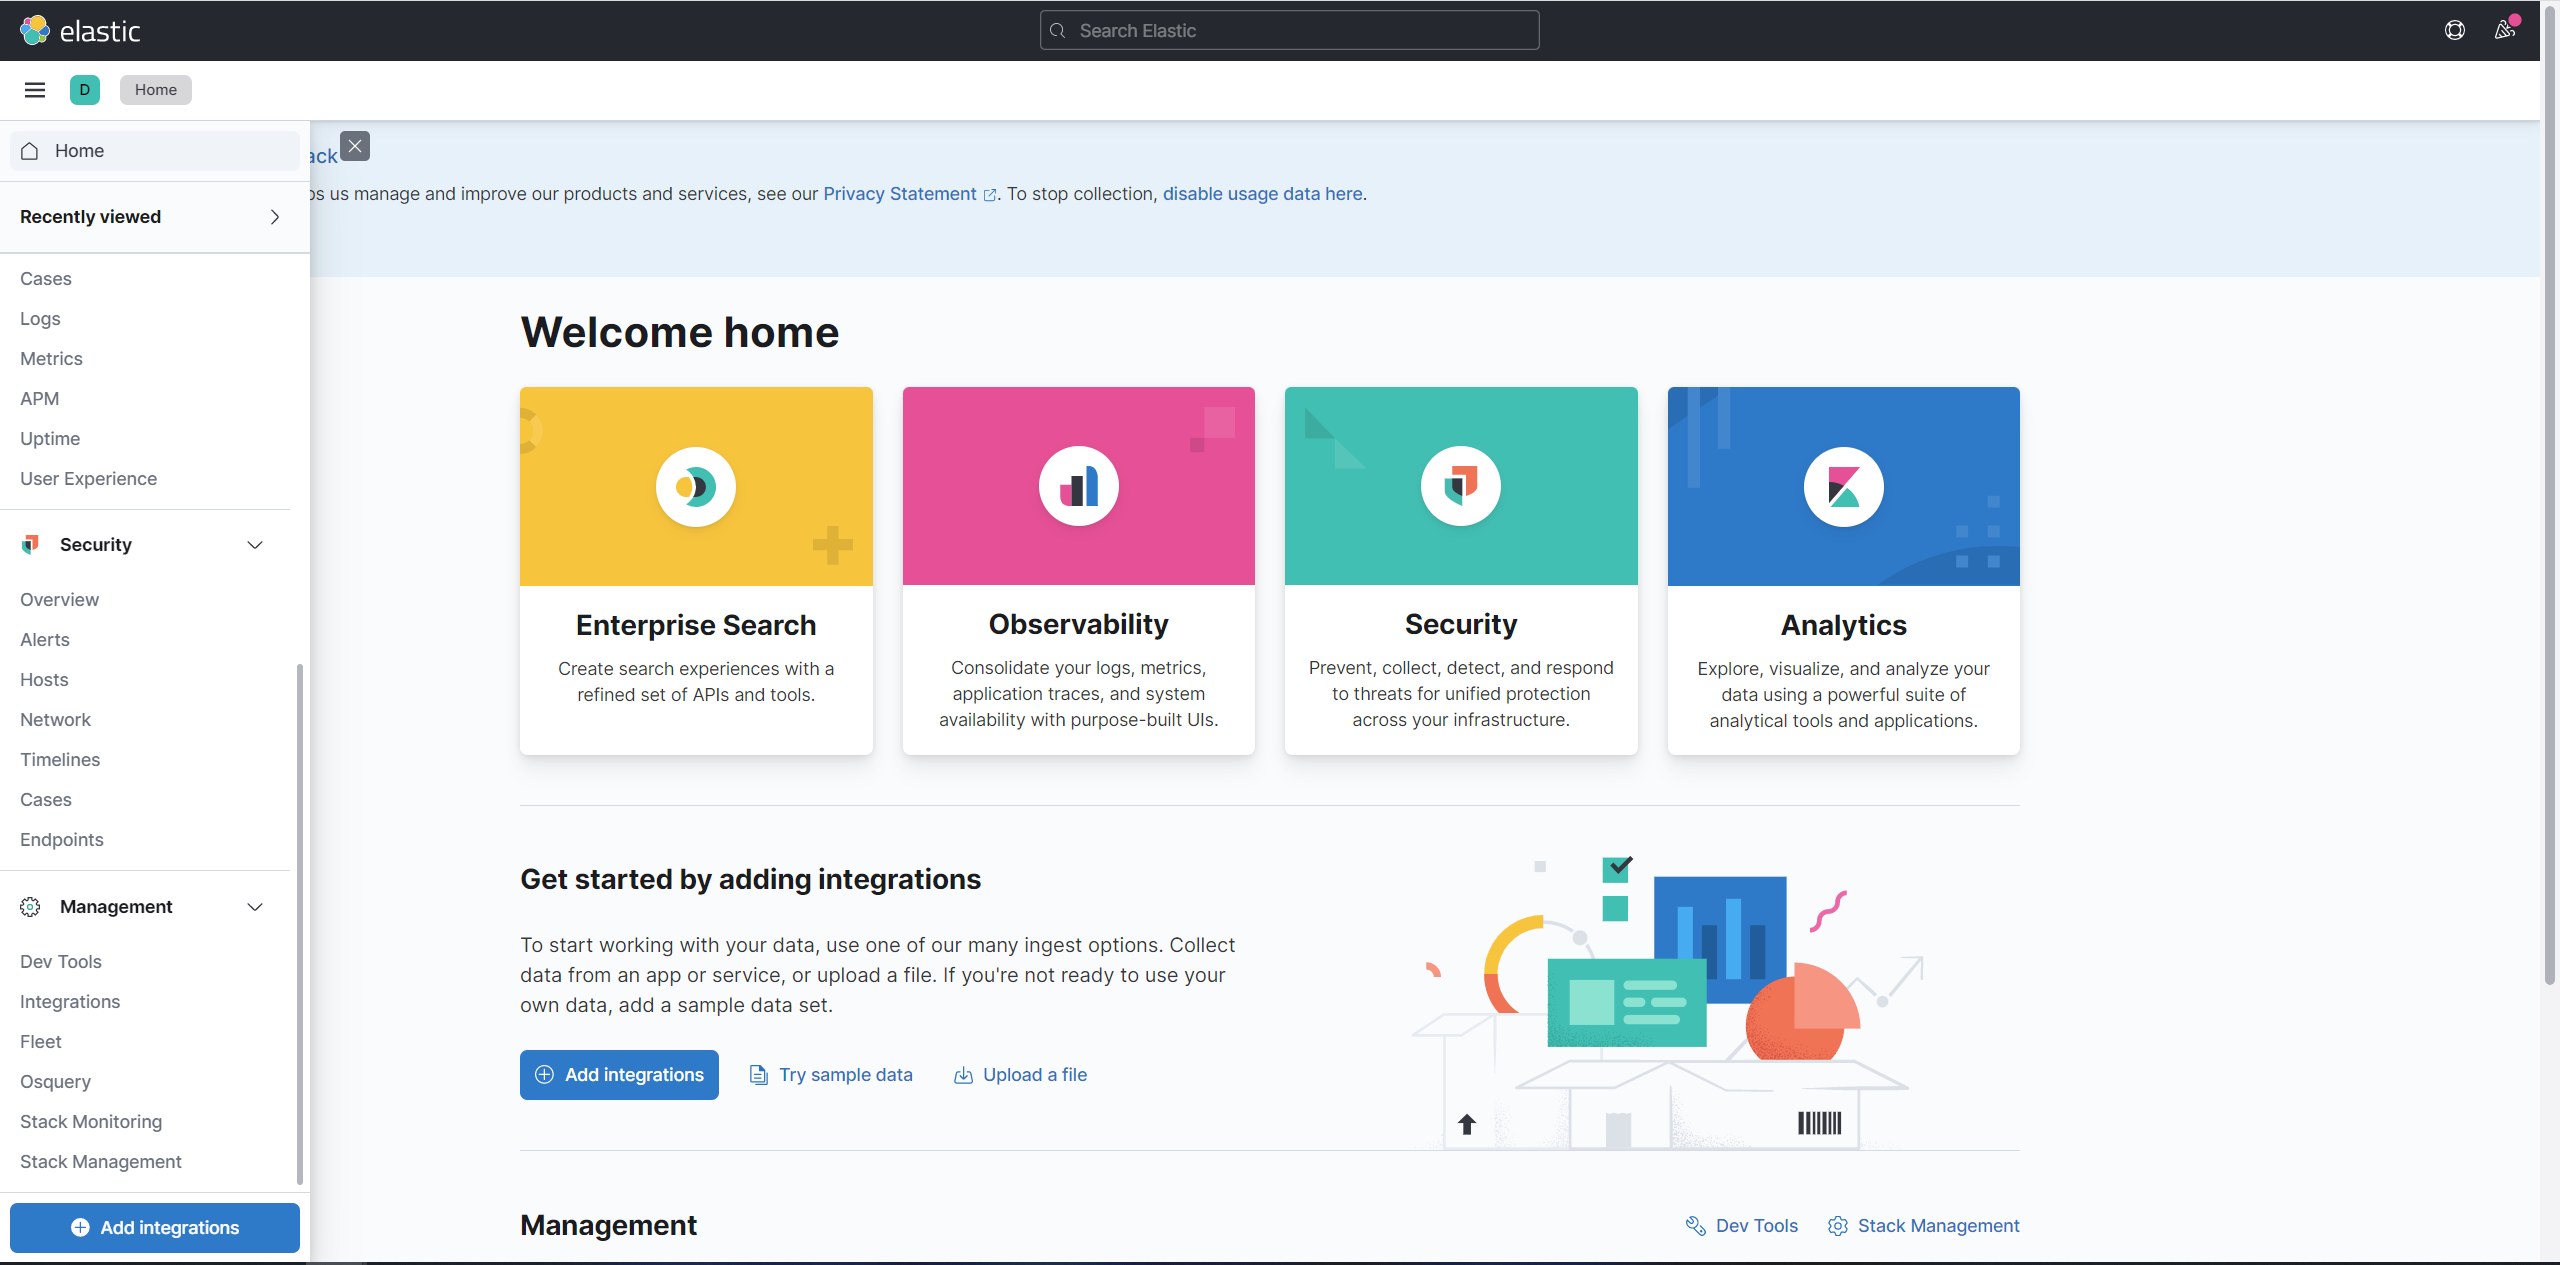
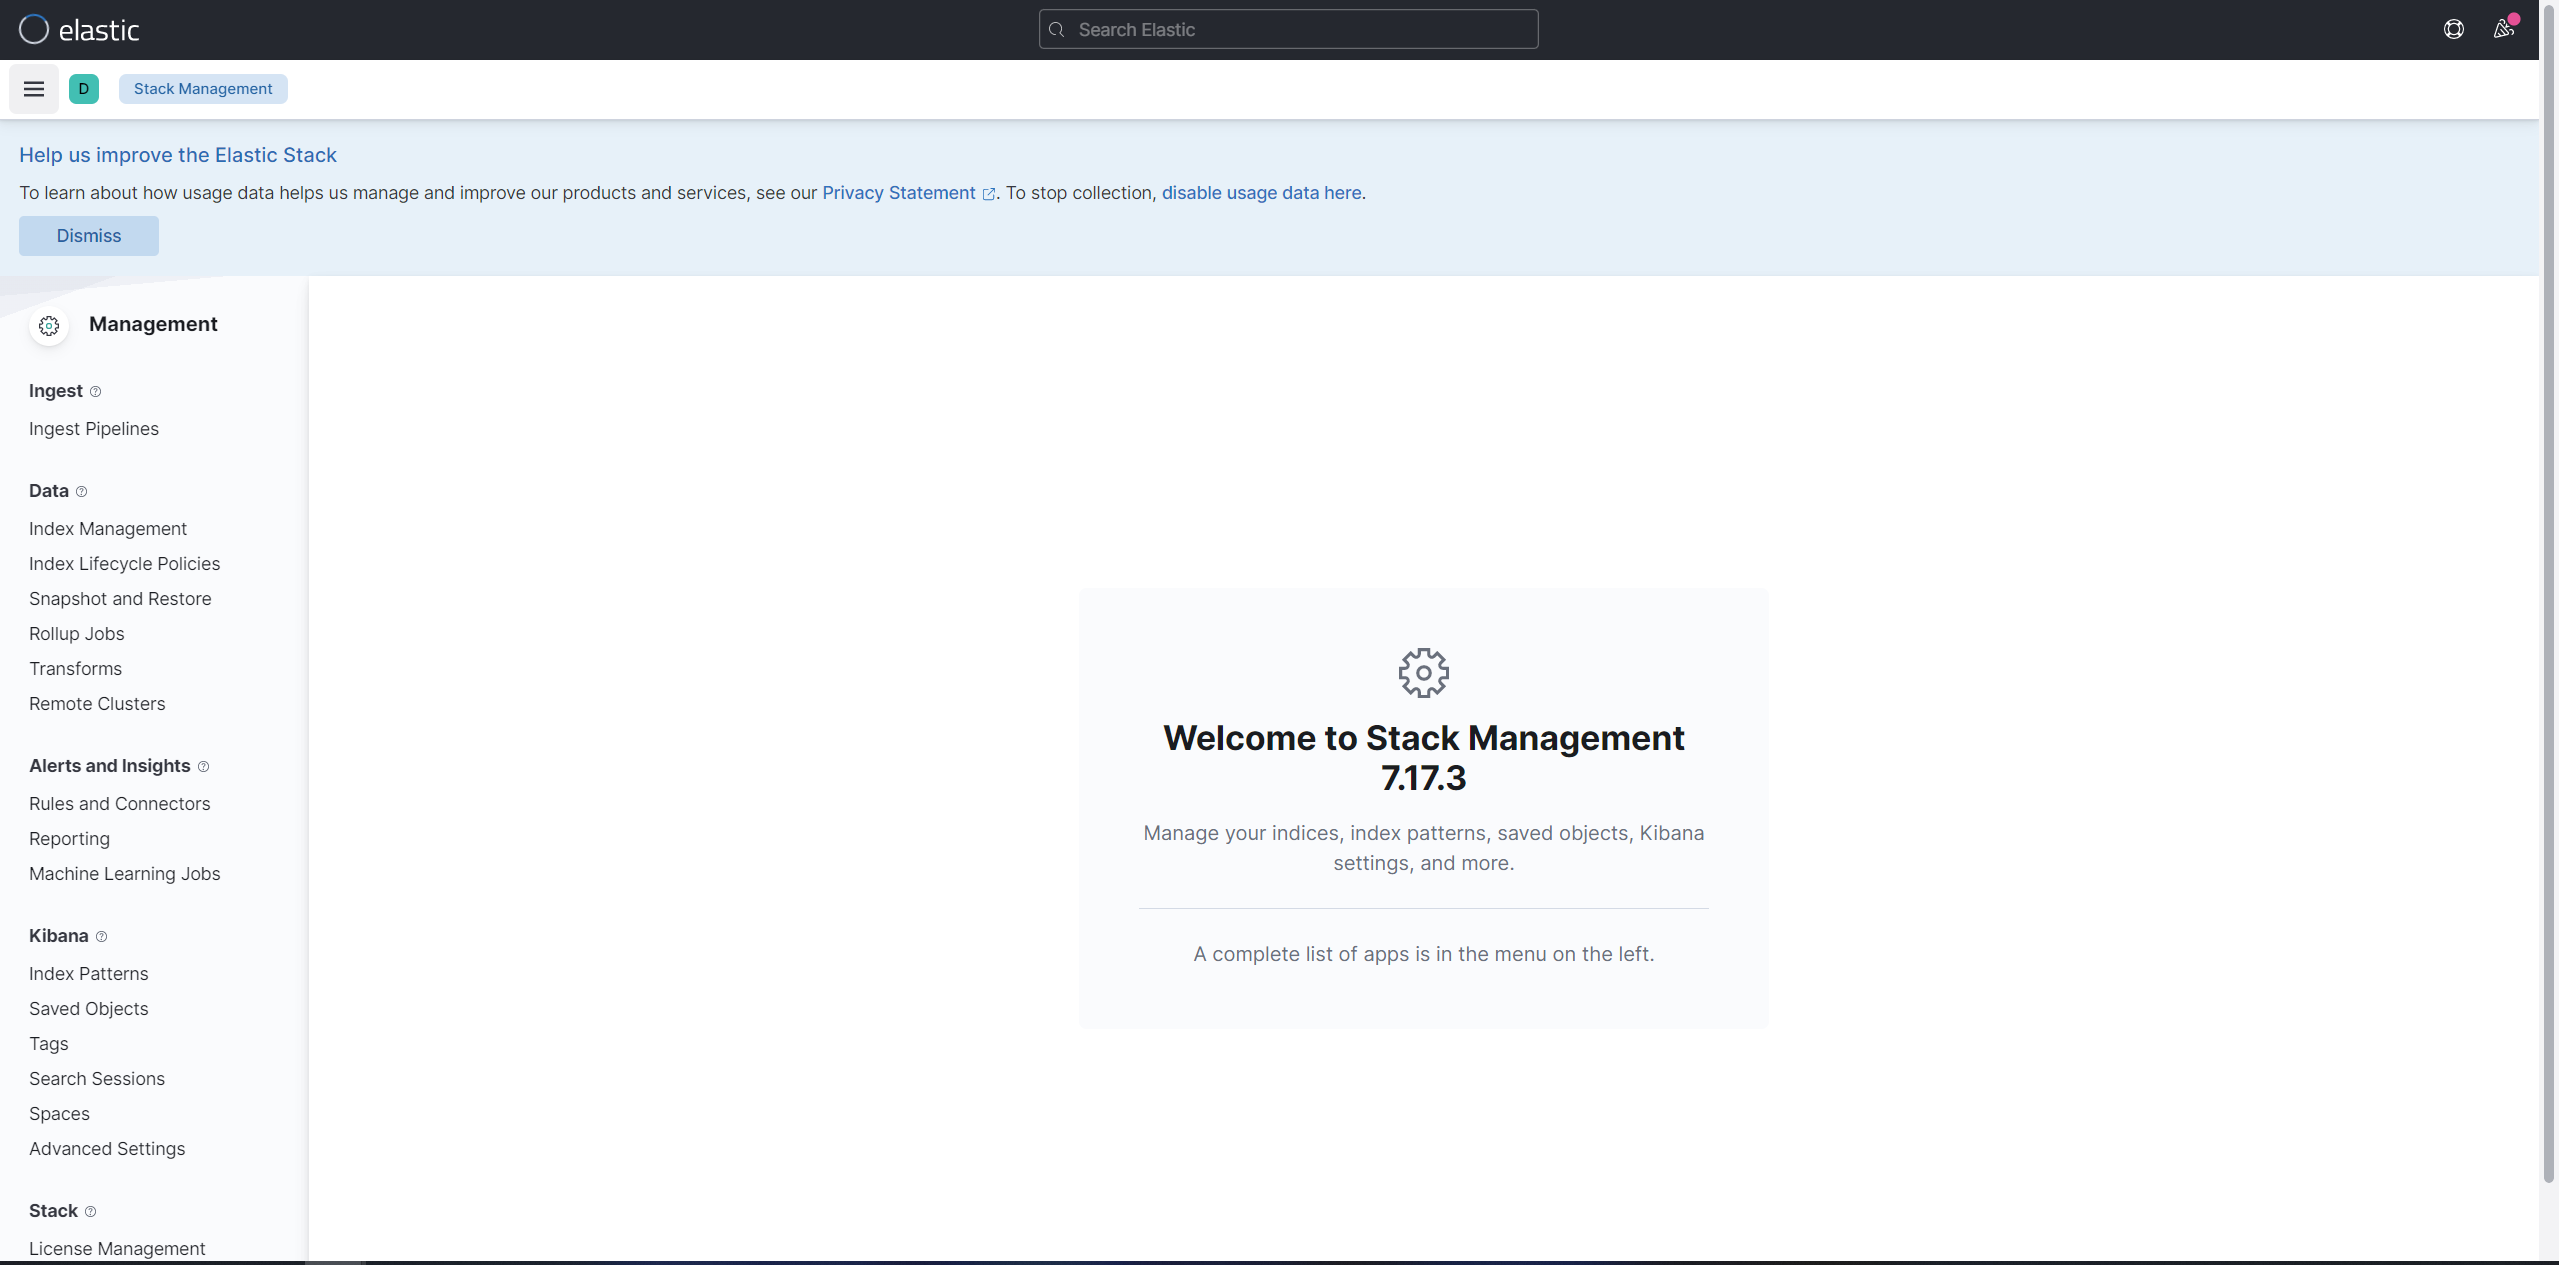
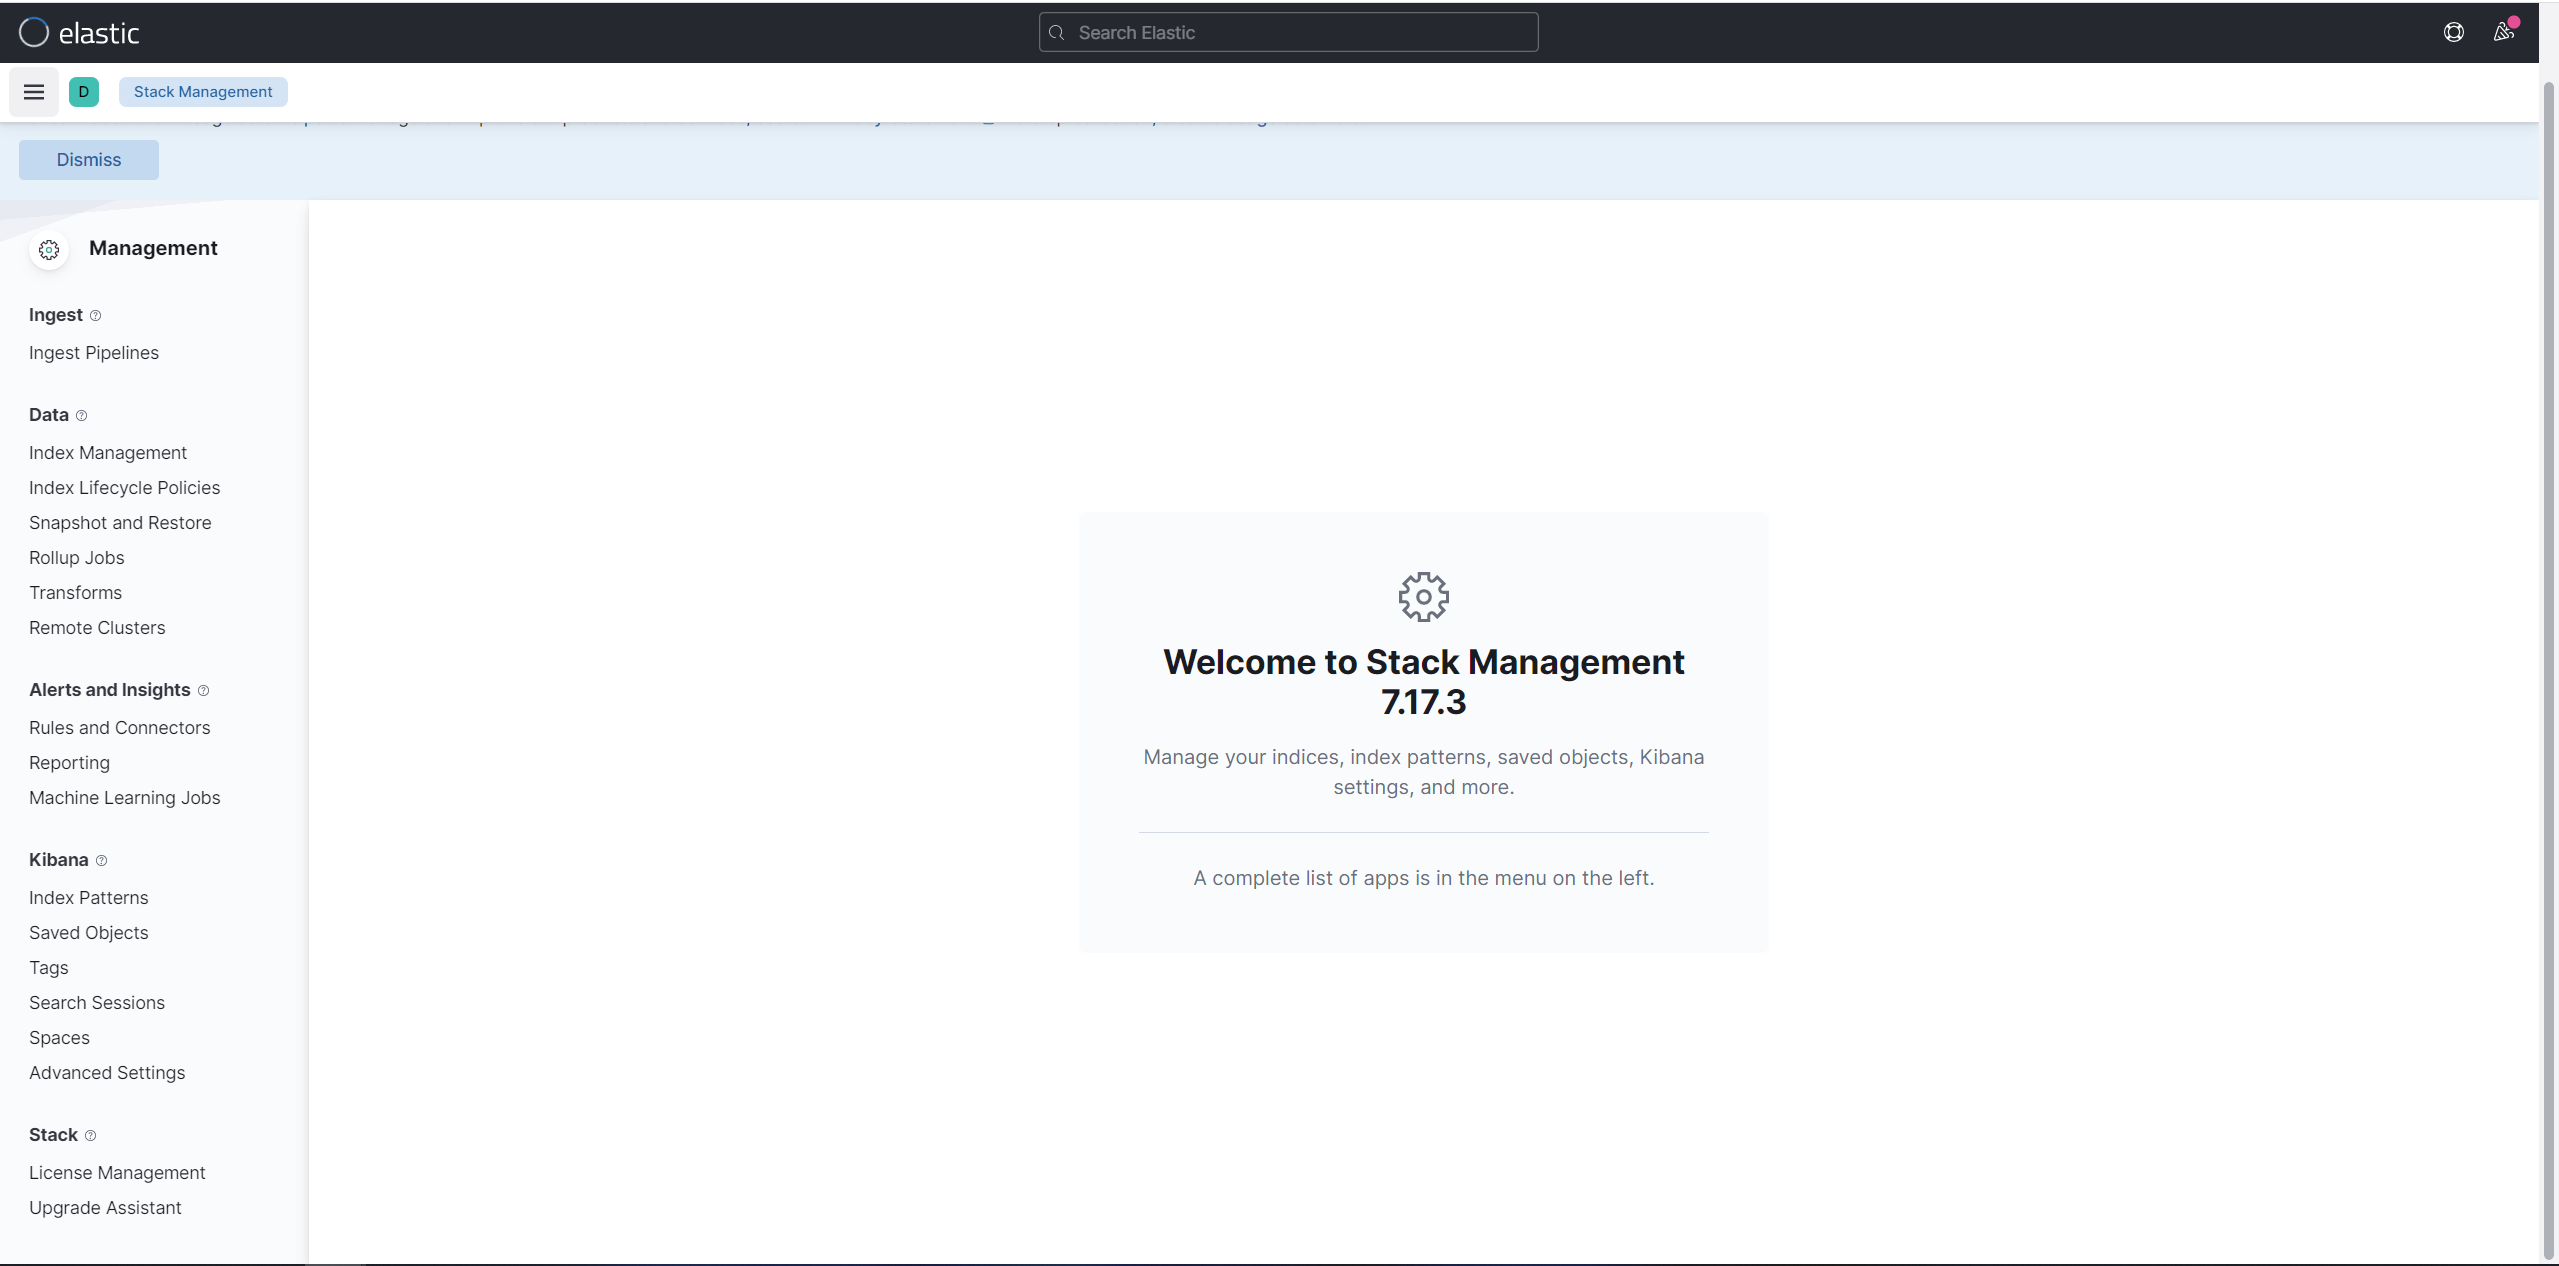
Navigate to Stack Management under Kibana in Management: (menu > Management > Stack Management)
-
Navigate to Index Patterns under Kibana: (Kibana > Index Pattern)
-
Click the "Create Index Pattern" button.
-
Set Values and Click "Create Index Pattern".
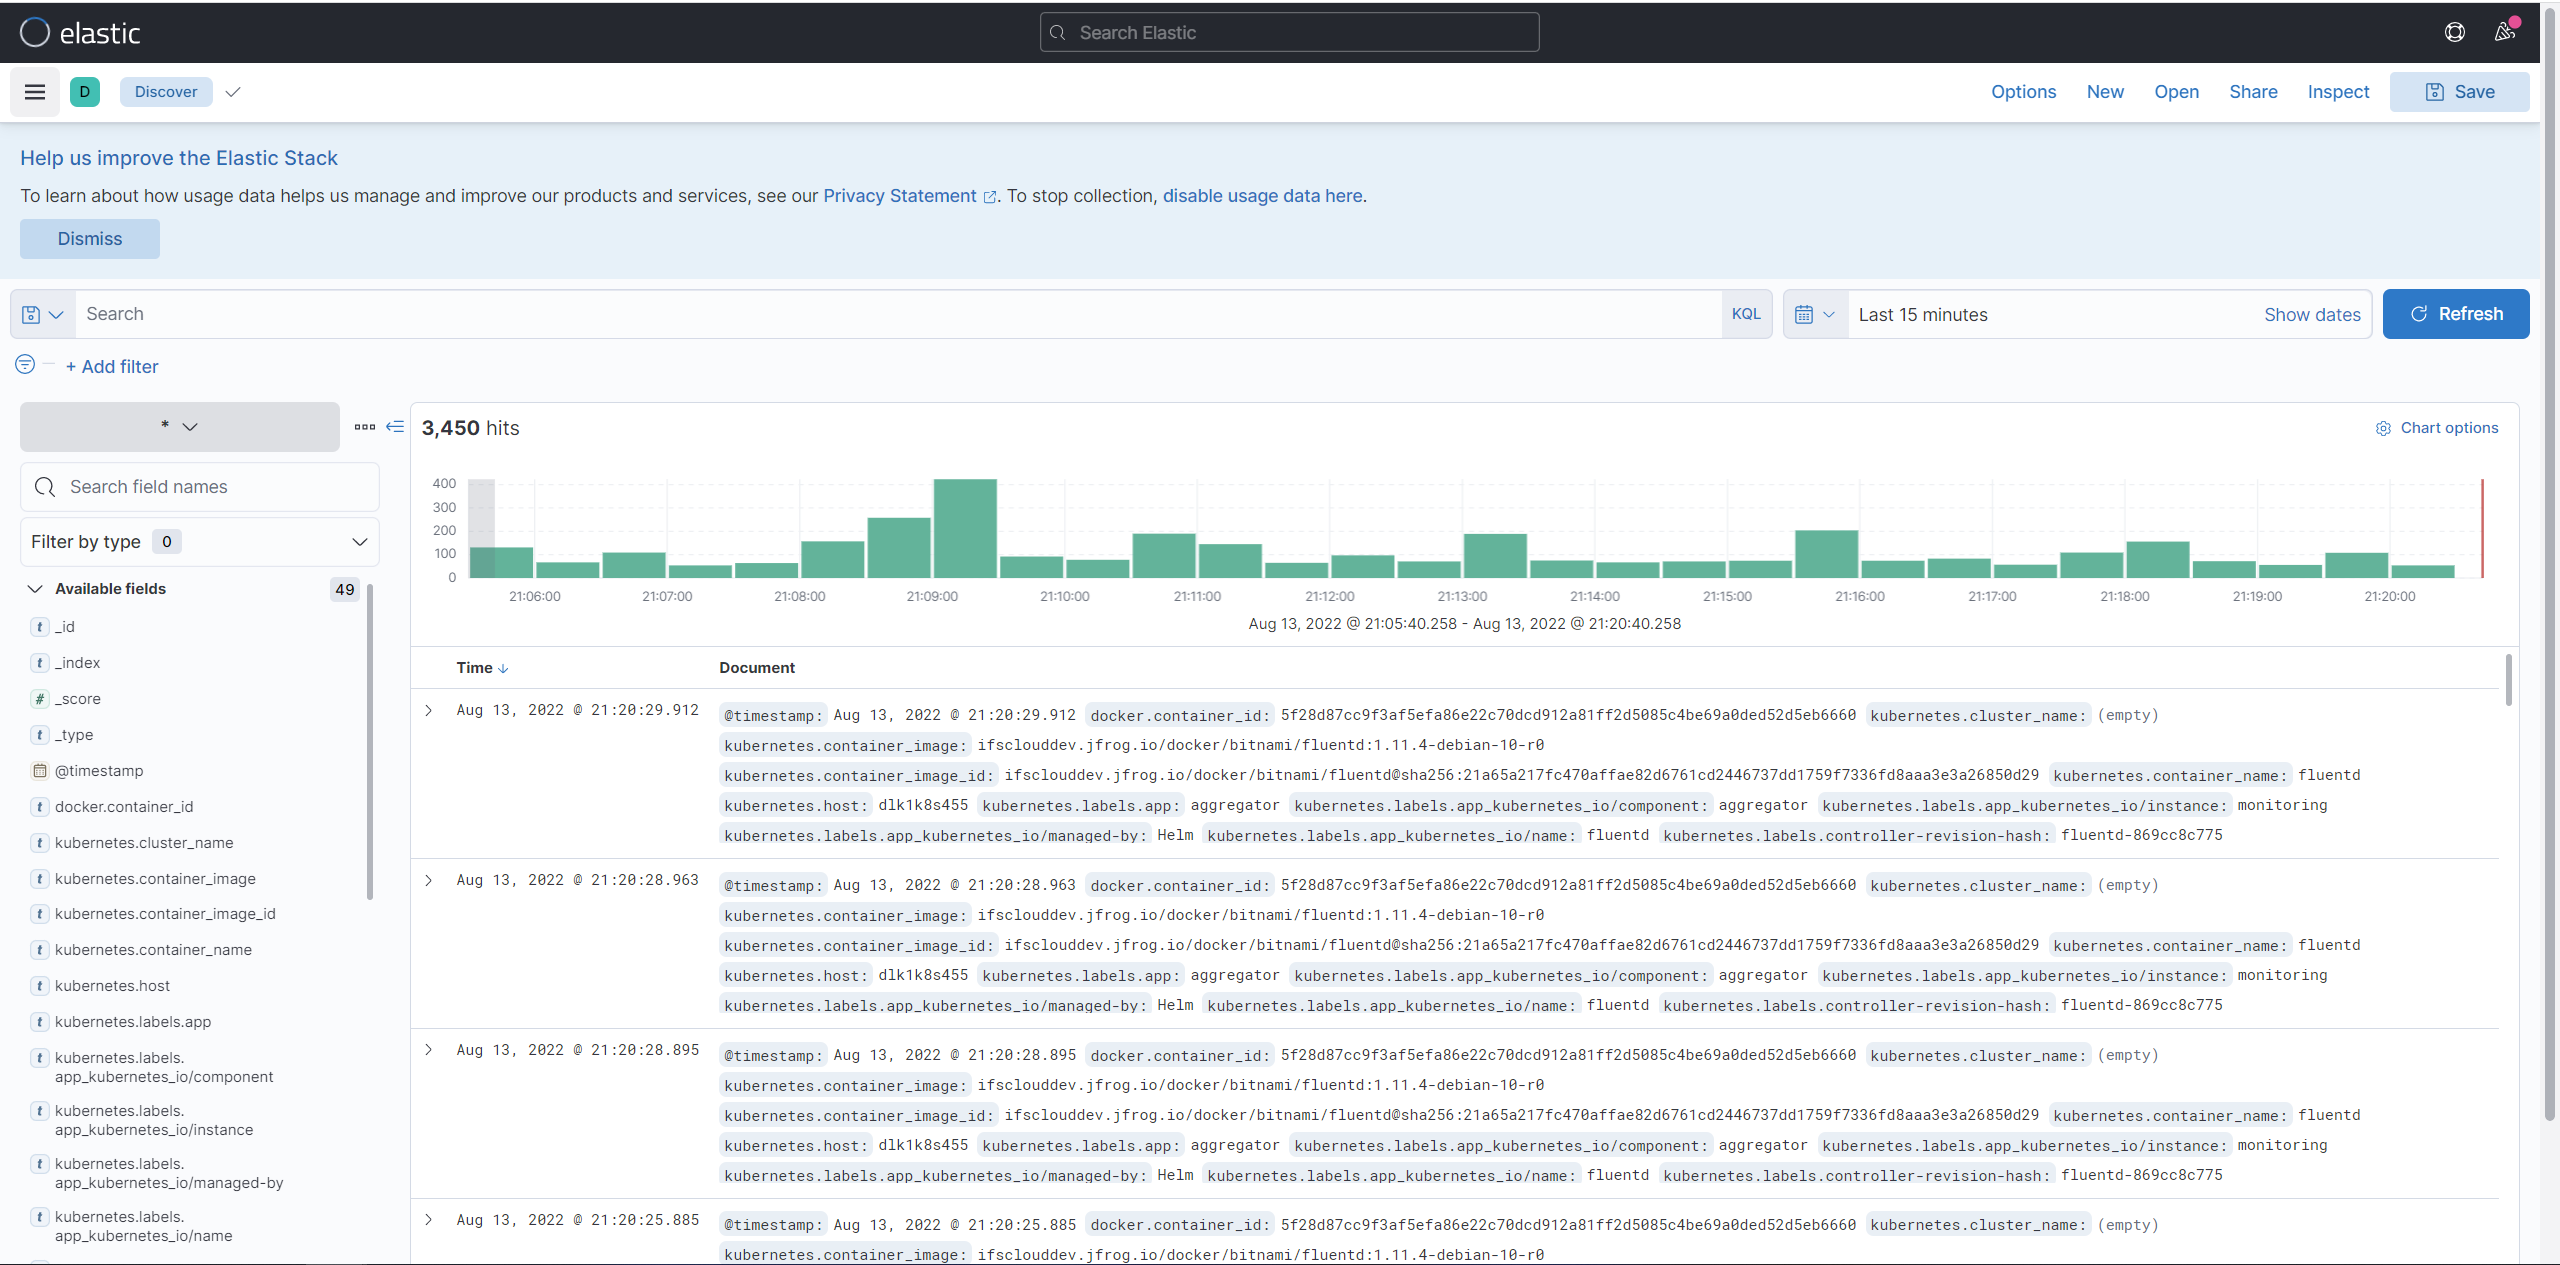
How to Discover Kibana Logs
-
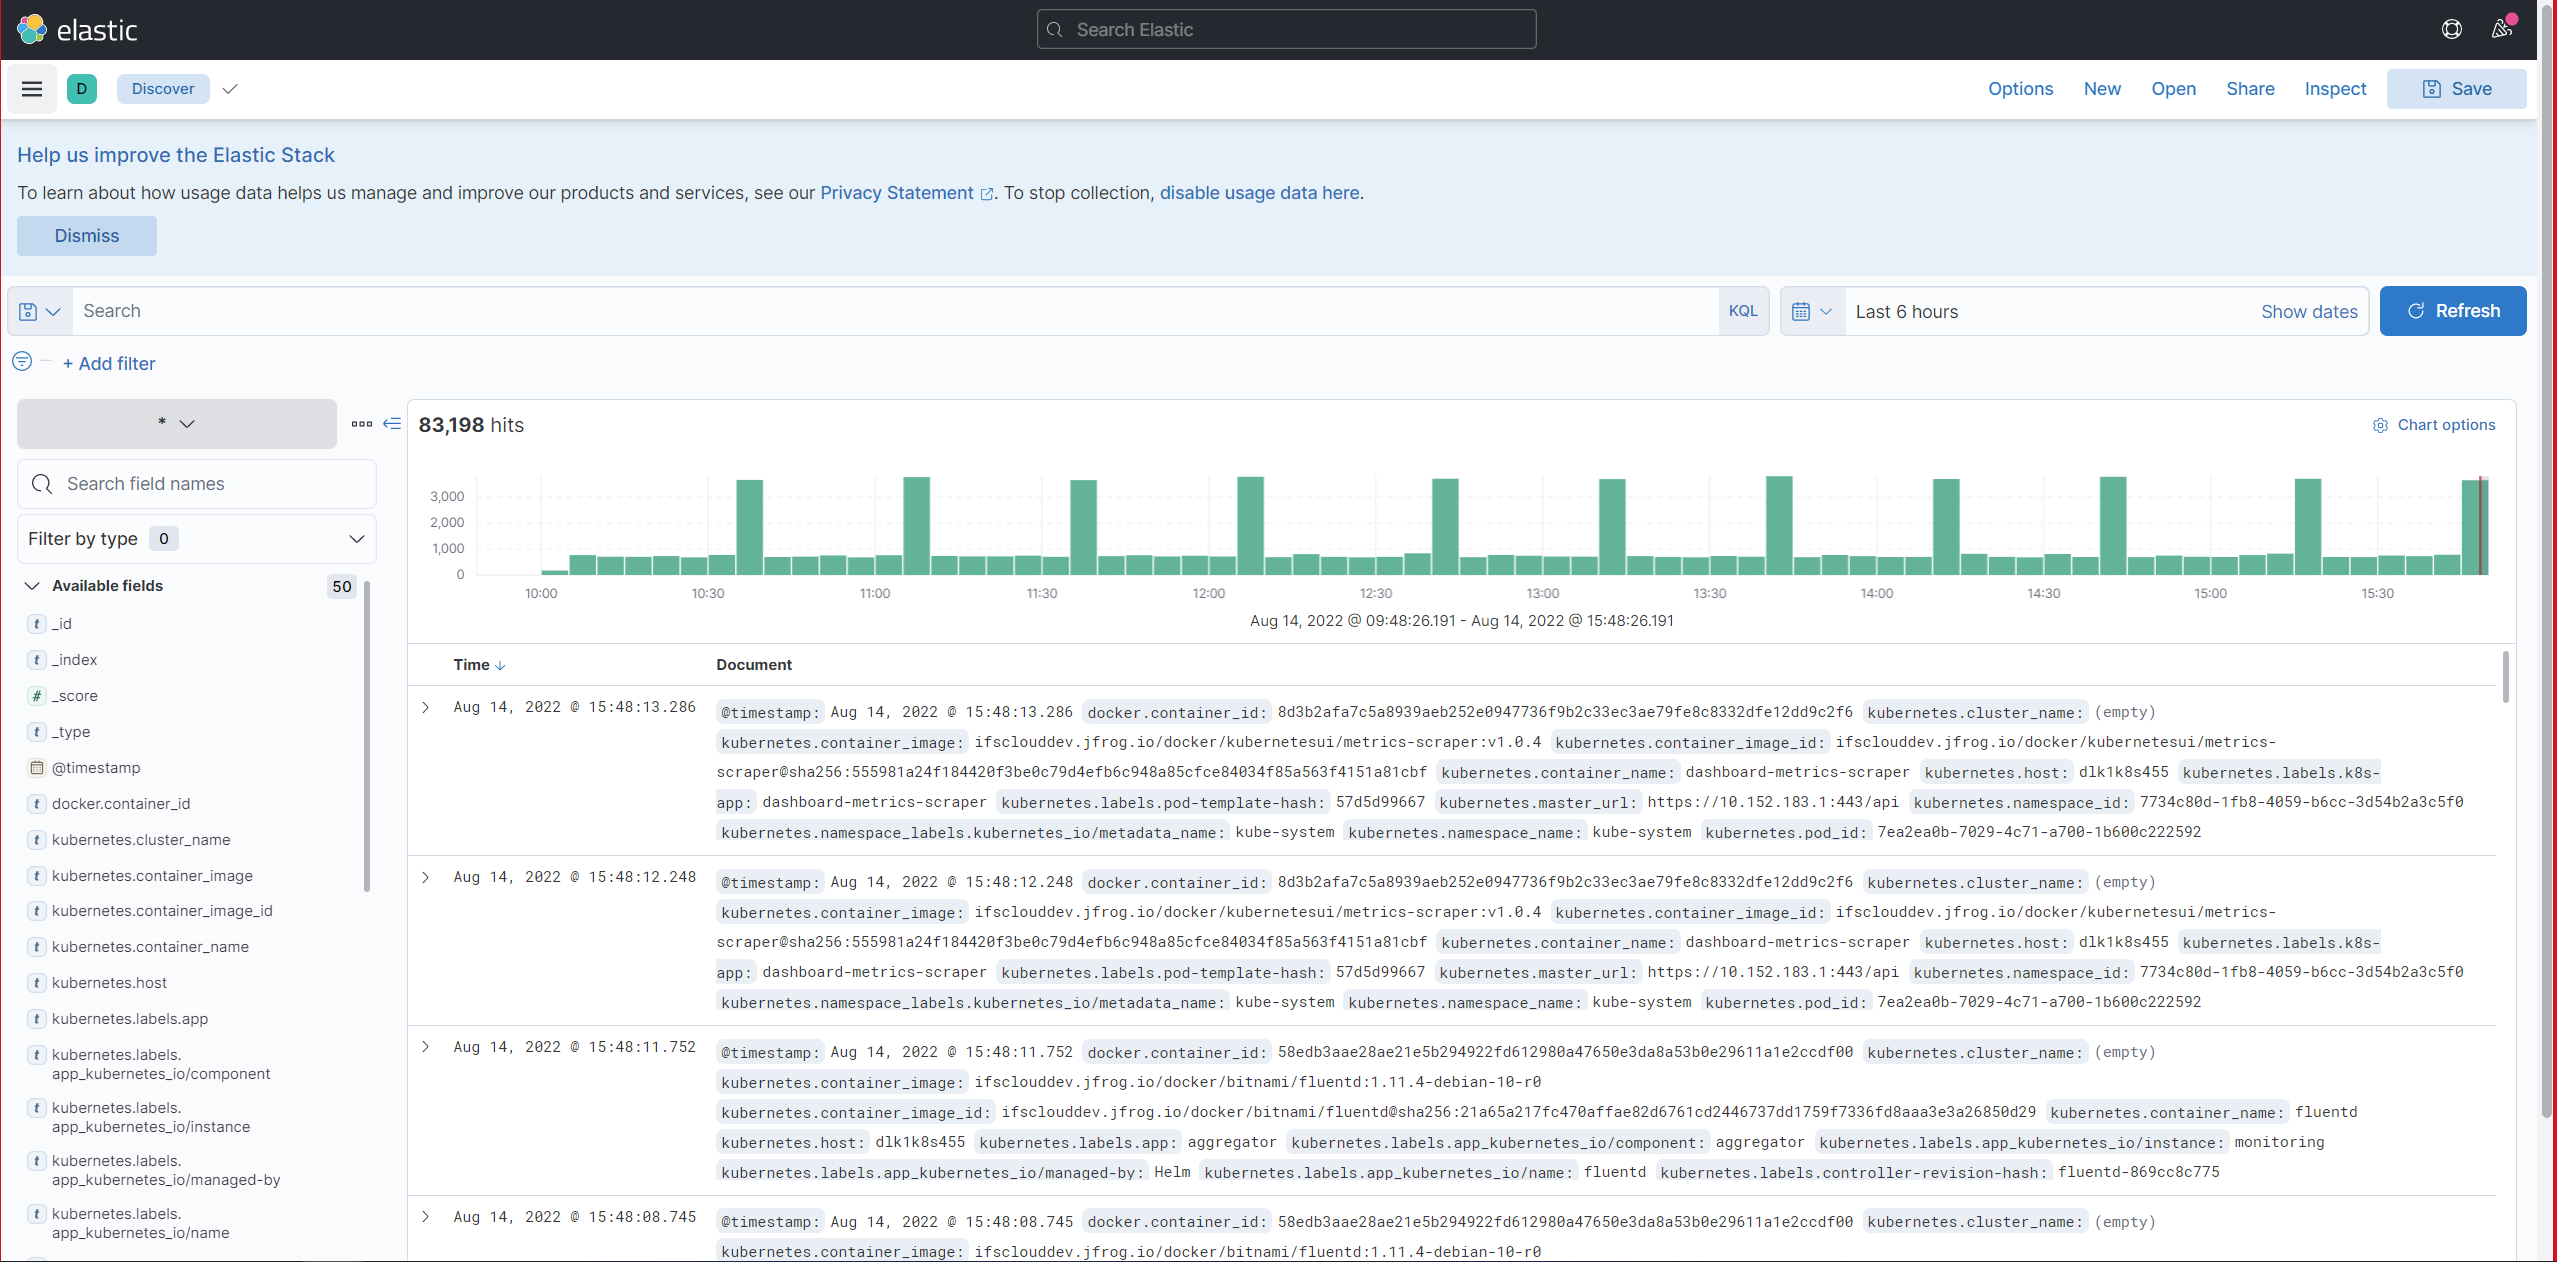
Navigate to Discover from the main menu.
-
View Records.
How to Import Kibana Dashboards
-
Kibana Dashboard Templates are available inside Windows Management Server. (File location: ifsroot\infrastructure\Kibana Dashboards)
-
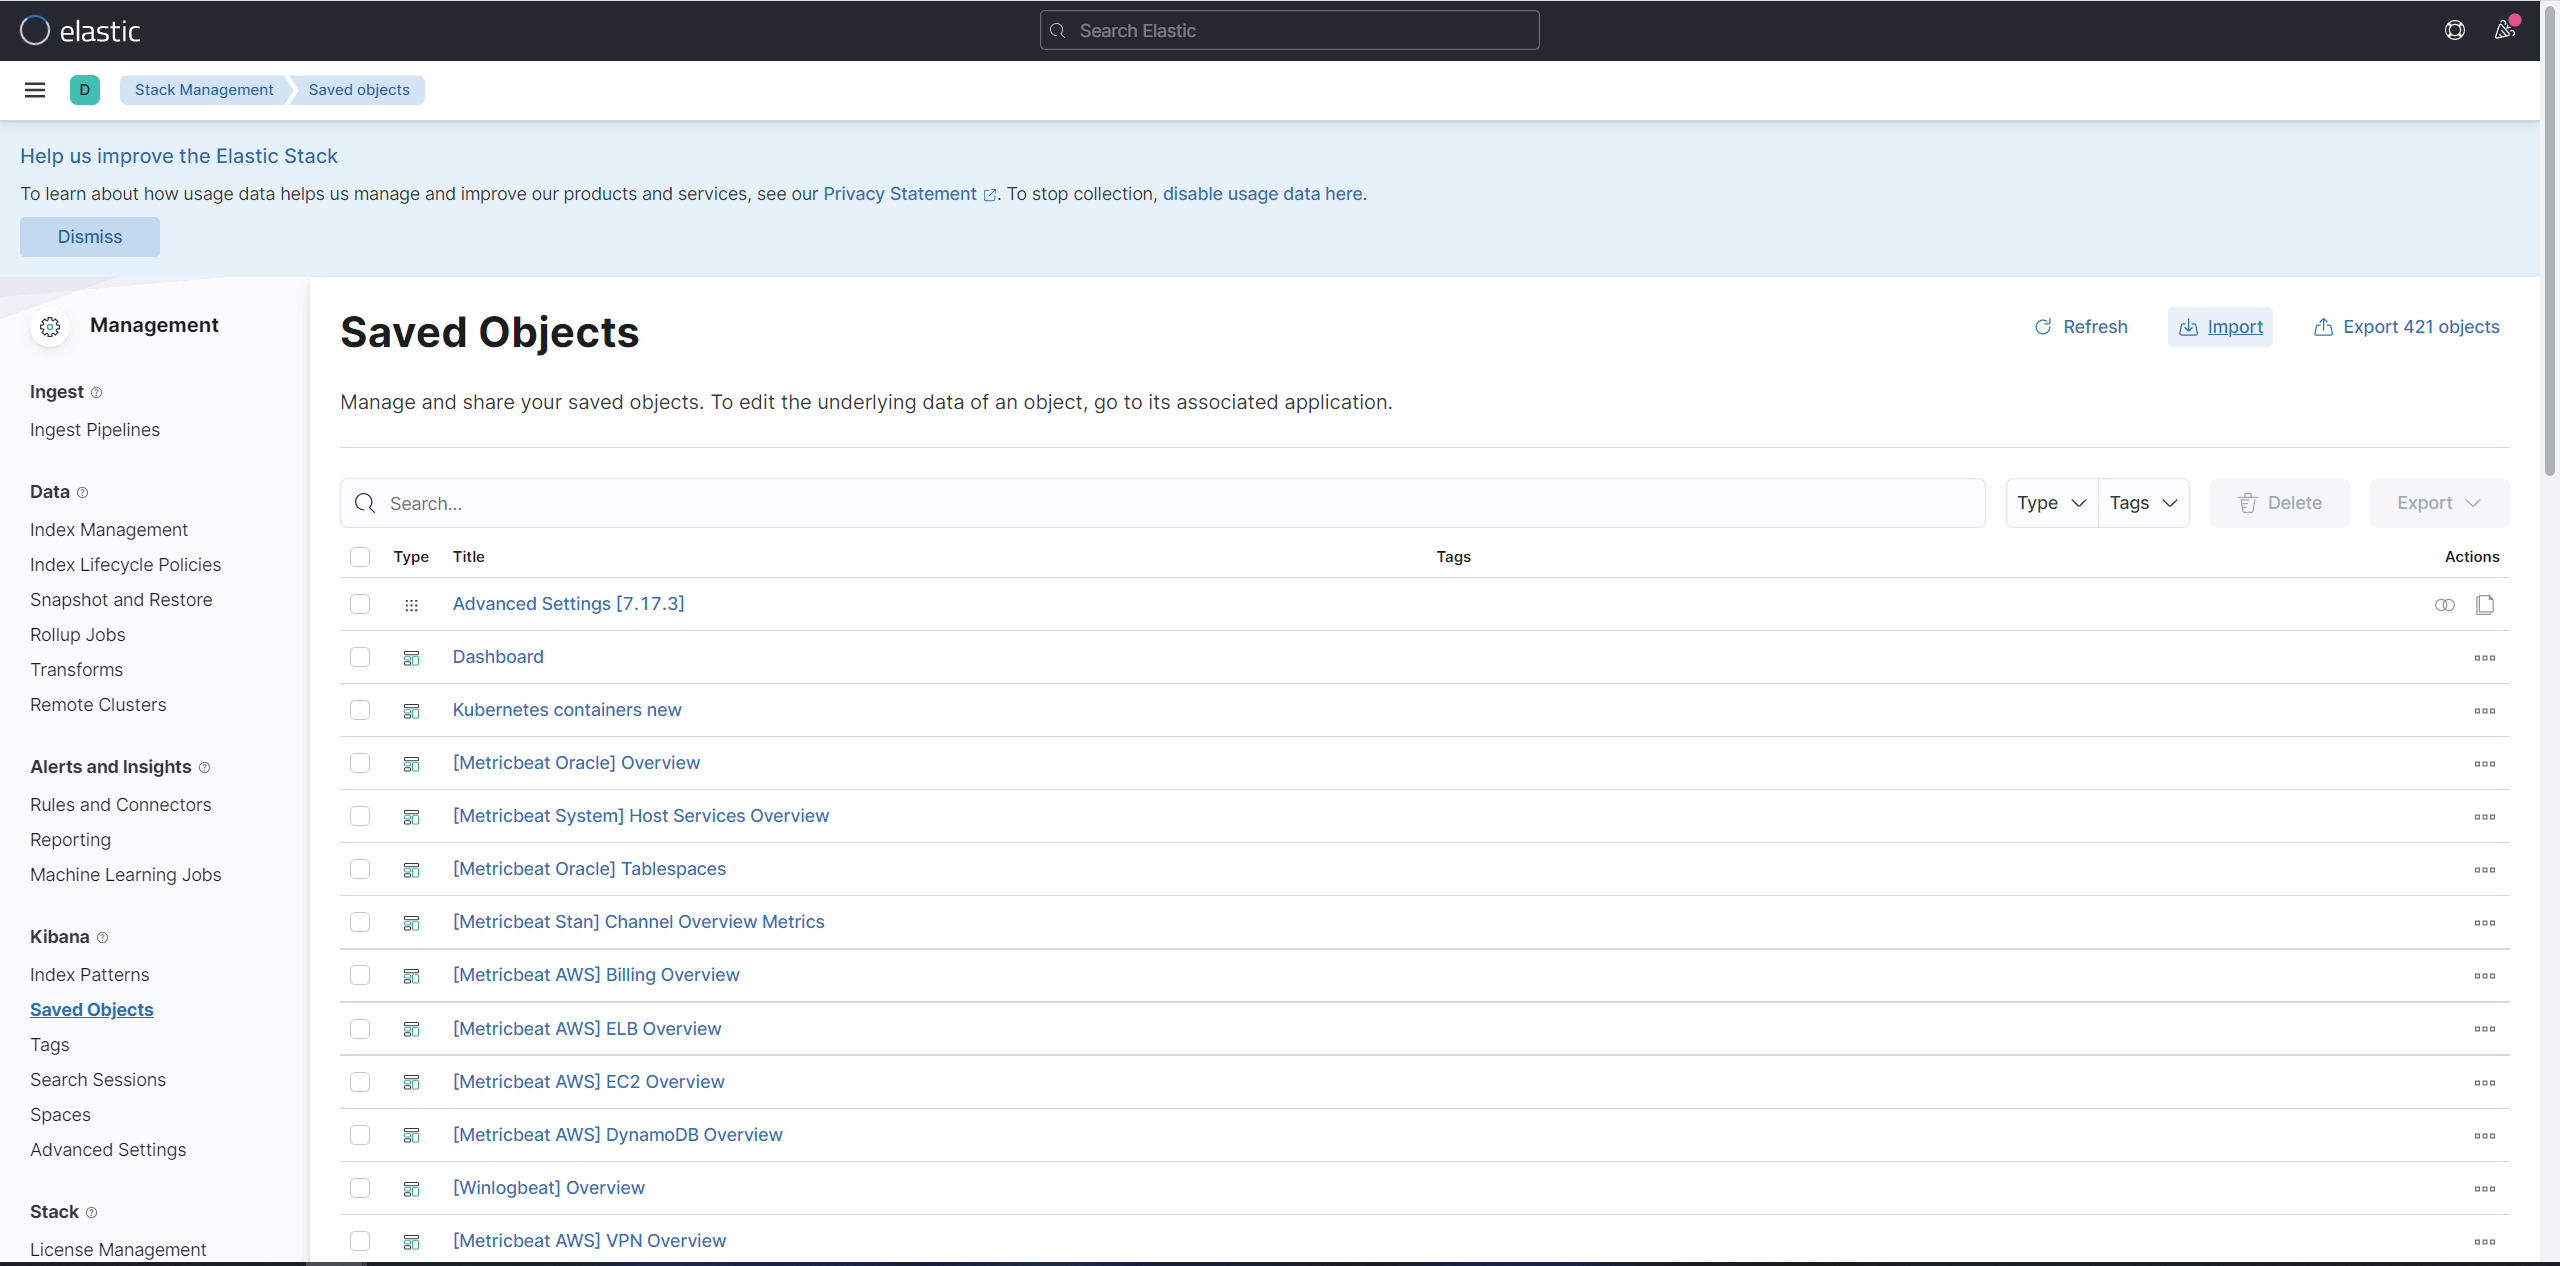
Navigate to menu > Management > Stack Management

-
Select Saved Objects to import Dashboard.
-
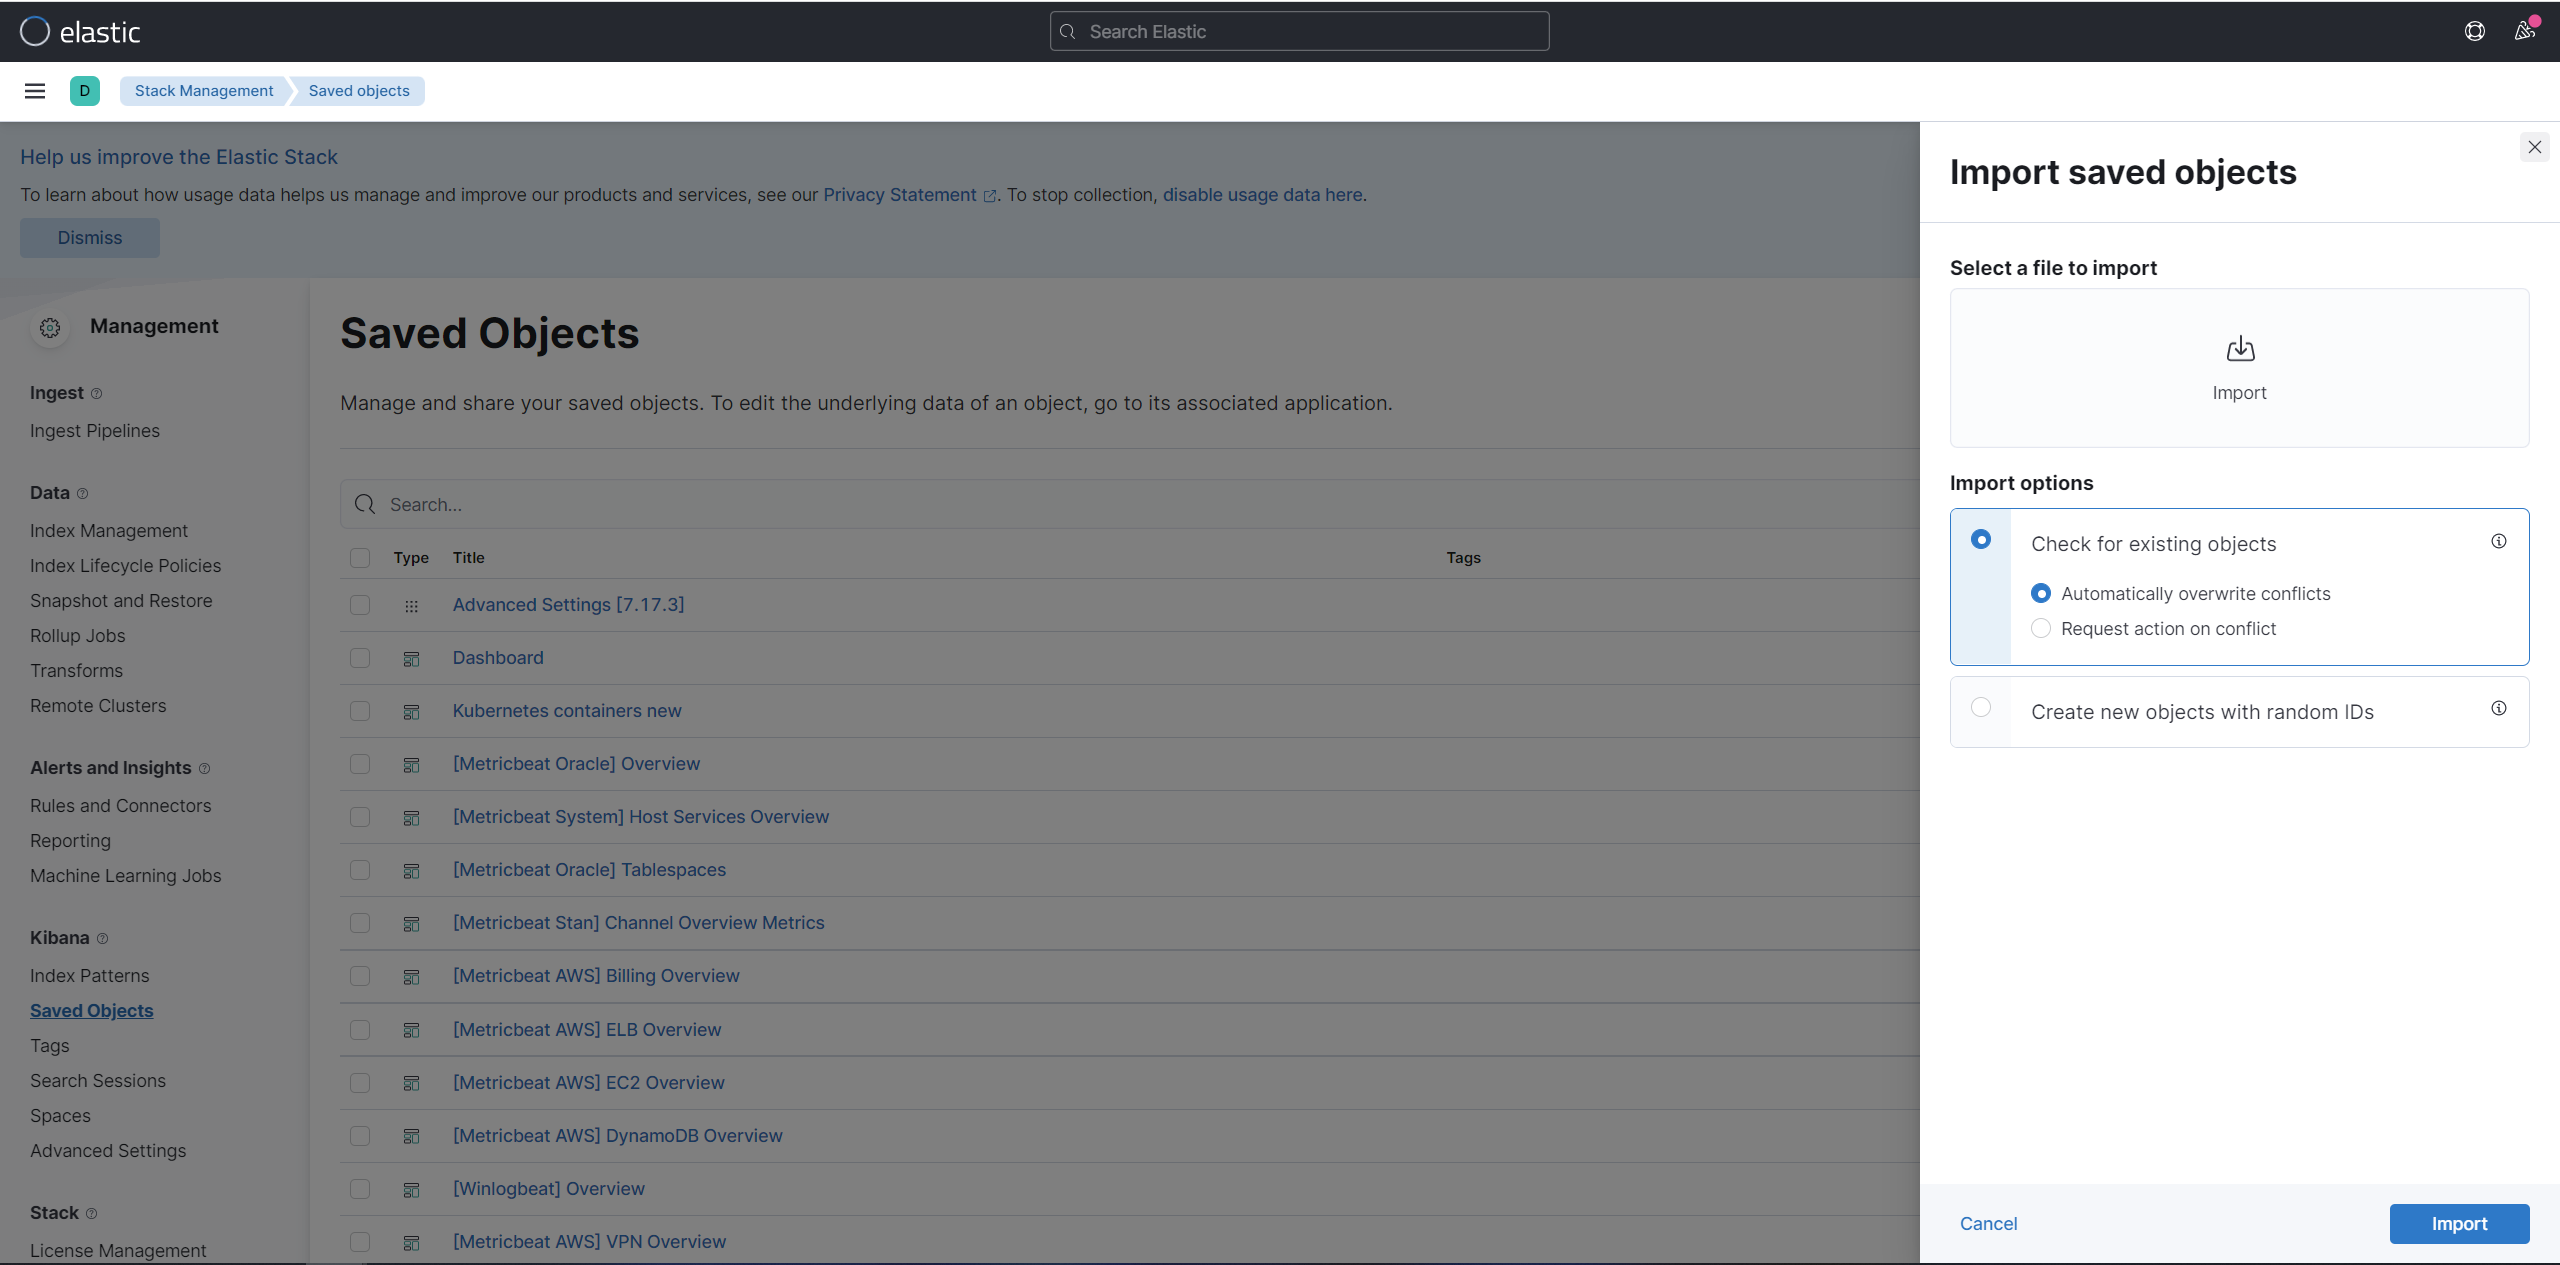
Click the Import button to open the file upload window.
-
Drag and drop .ndjson/.json file into the import section.
How to View Dashboards
-
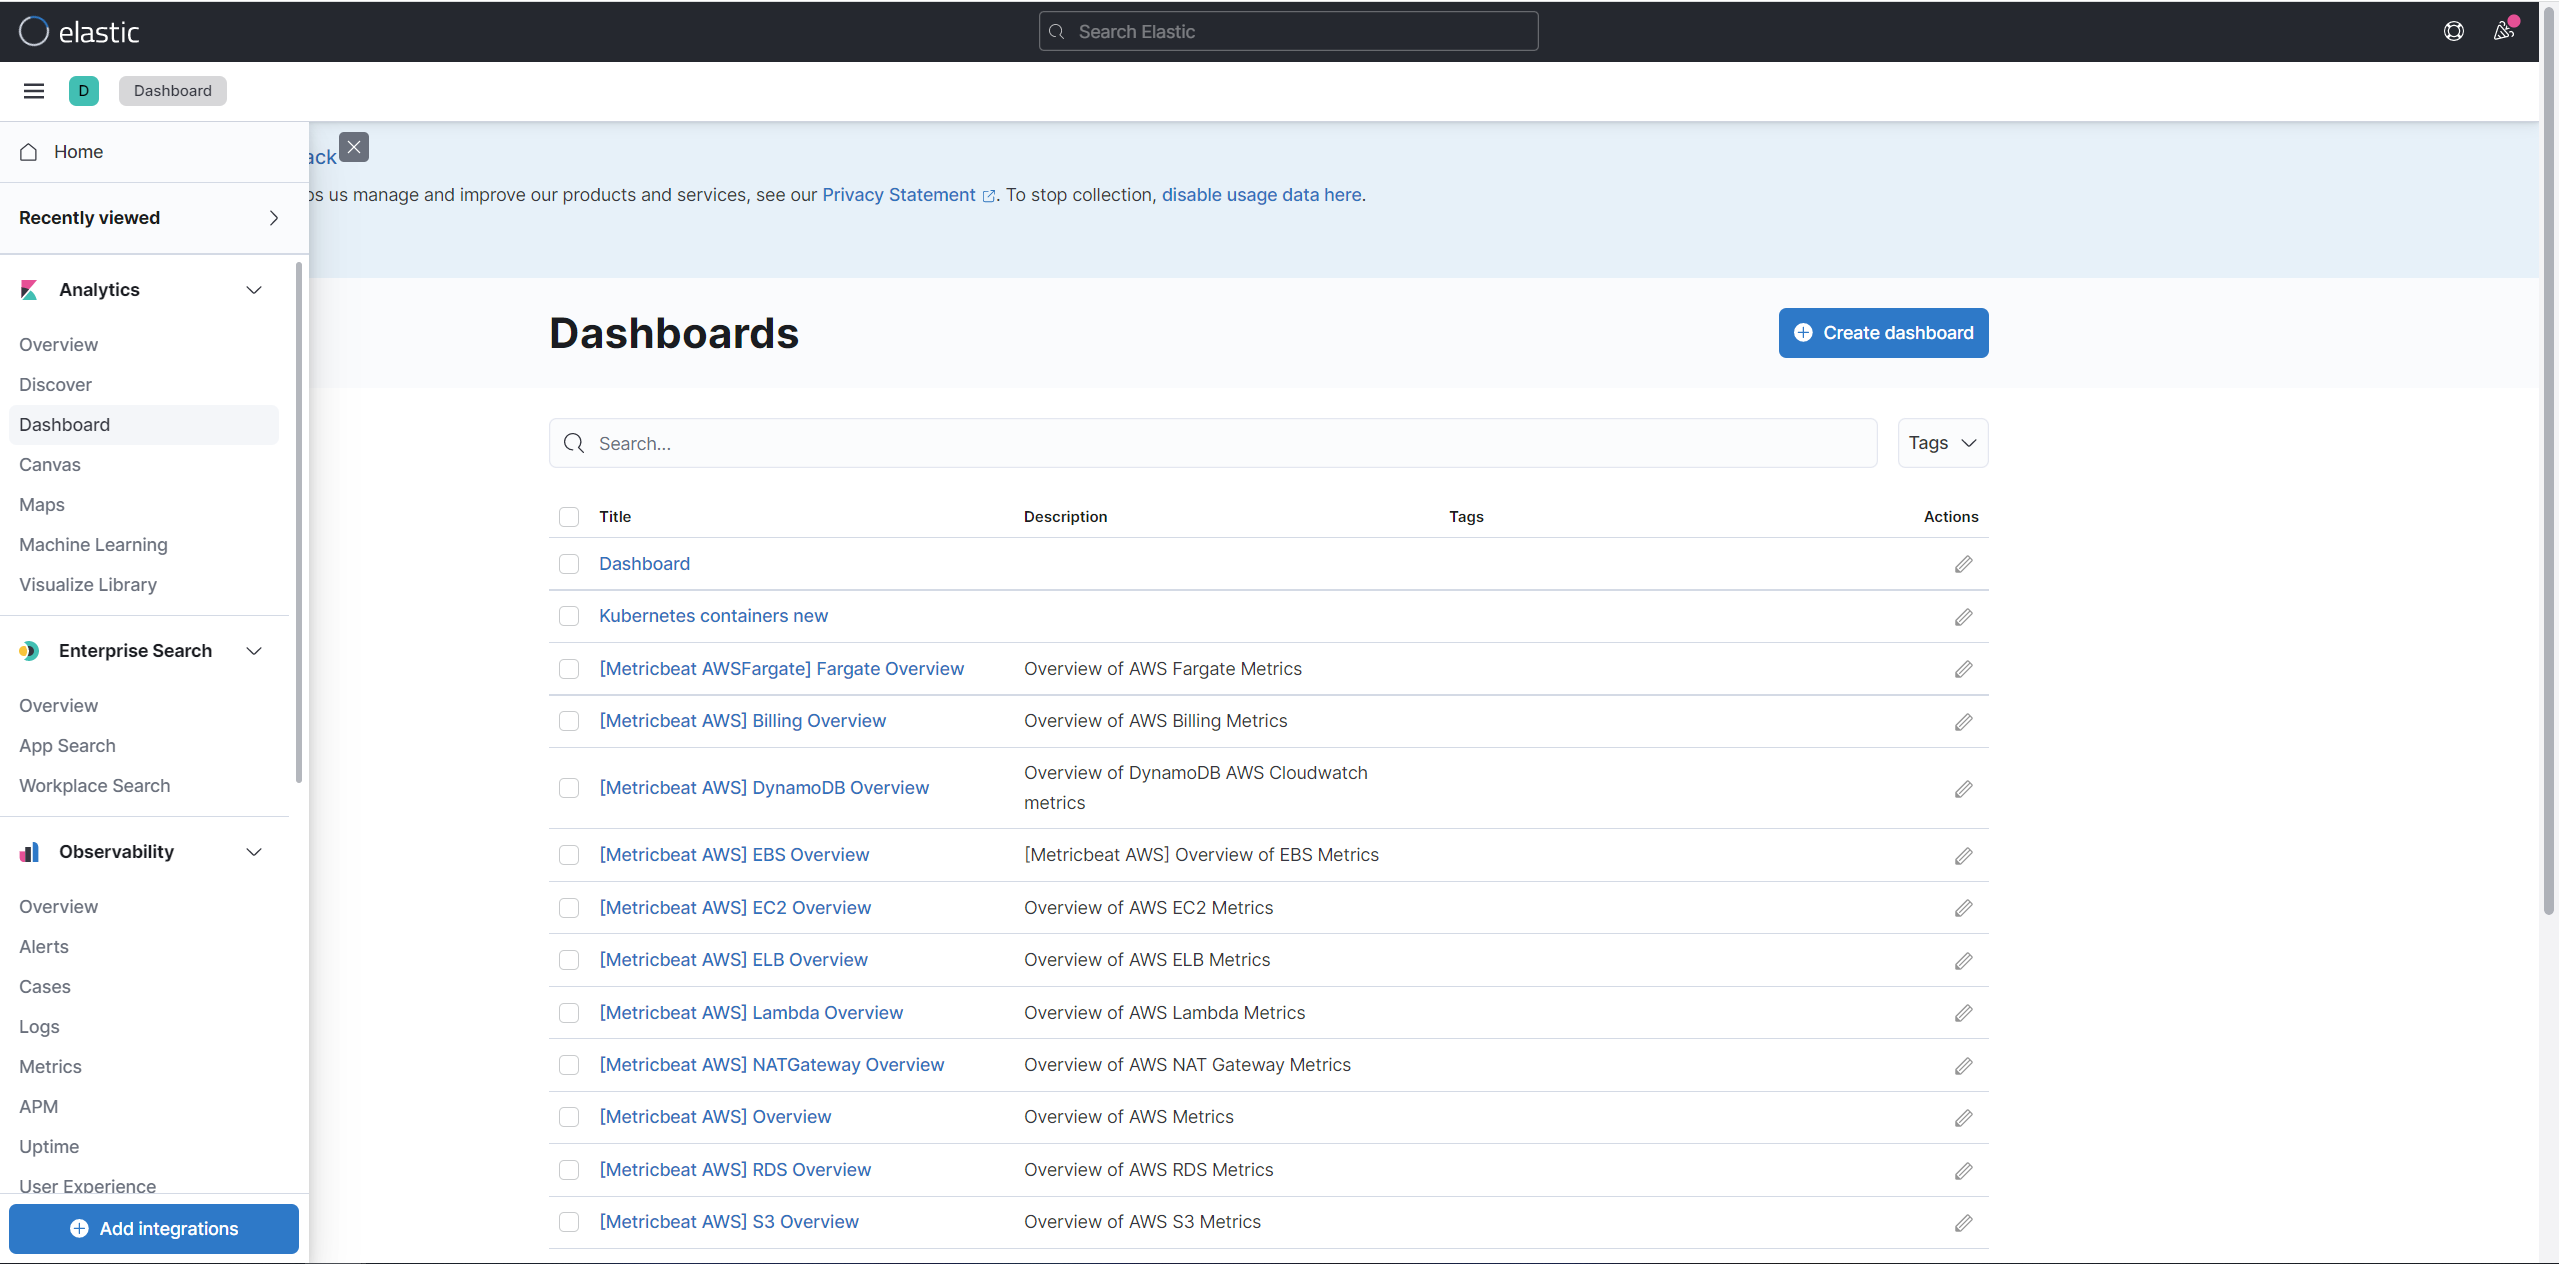
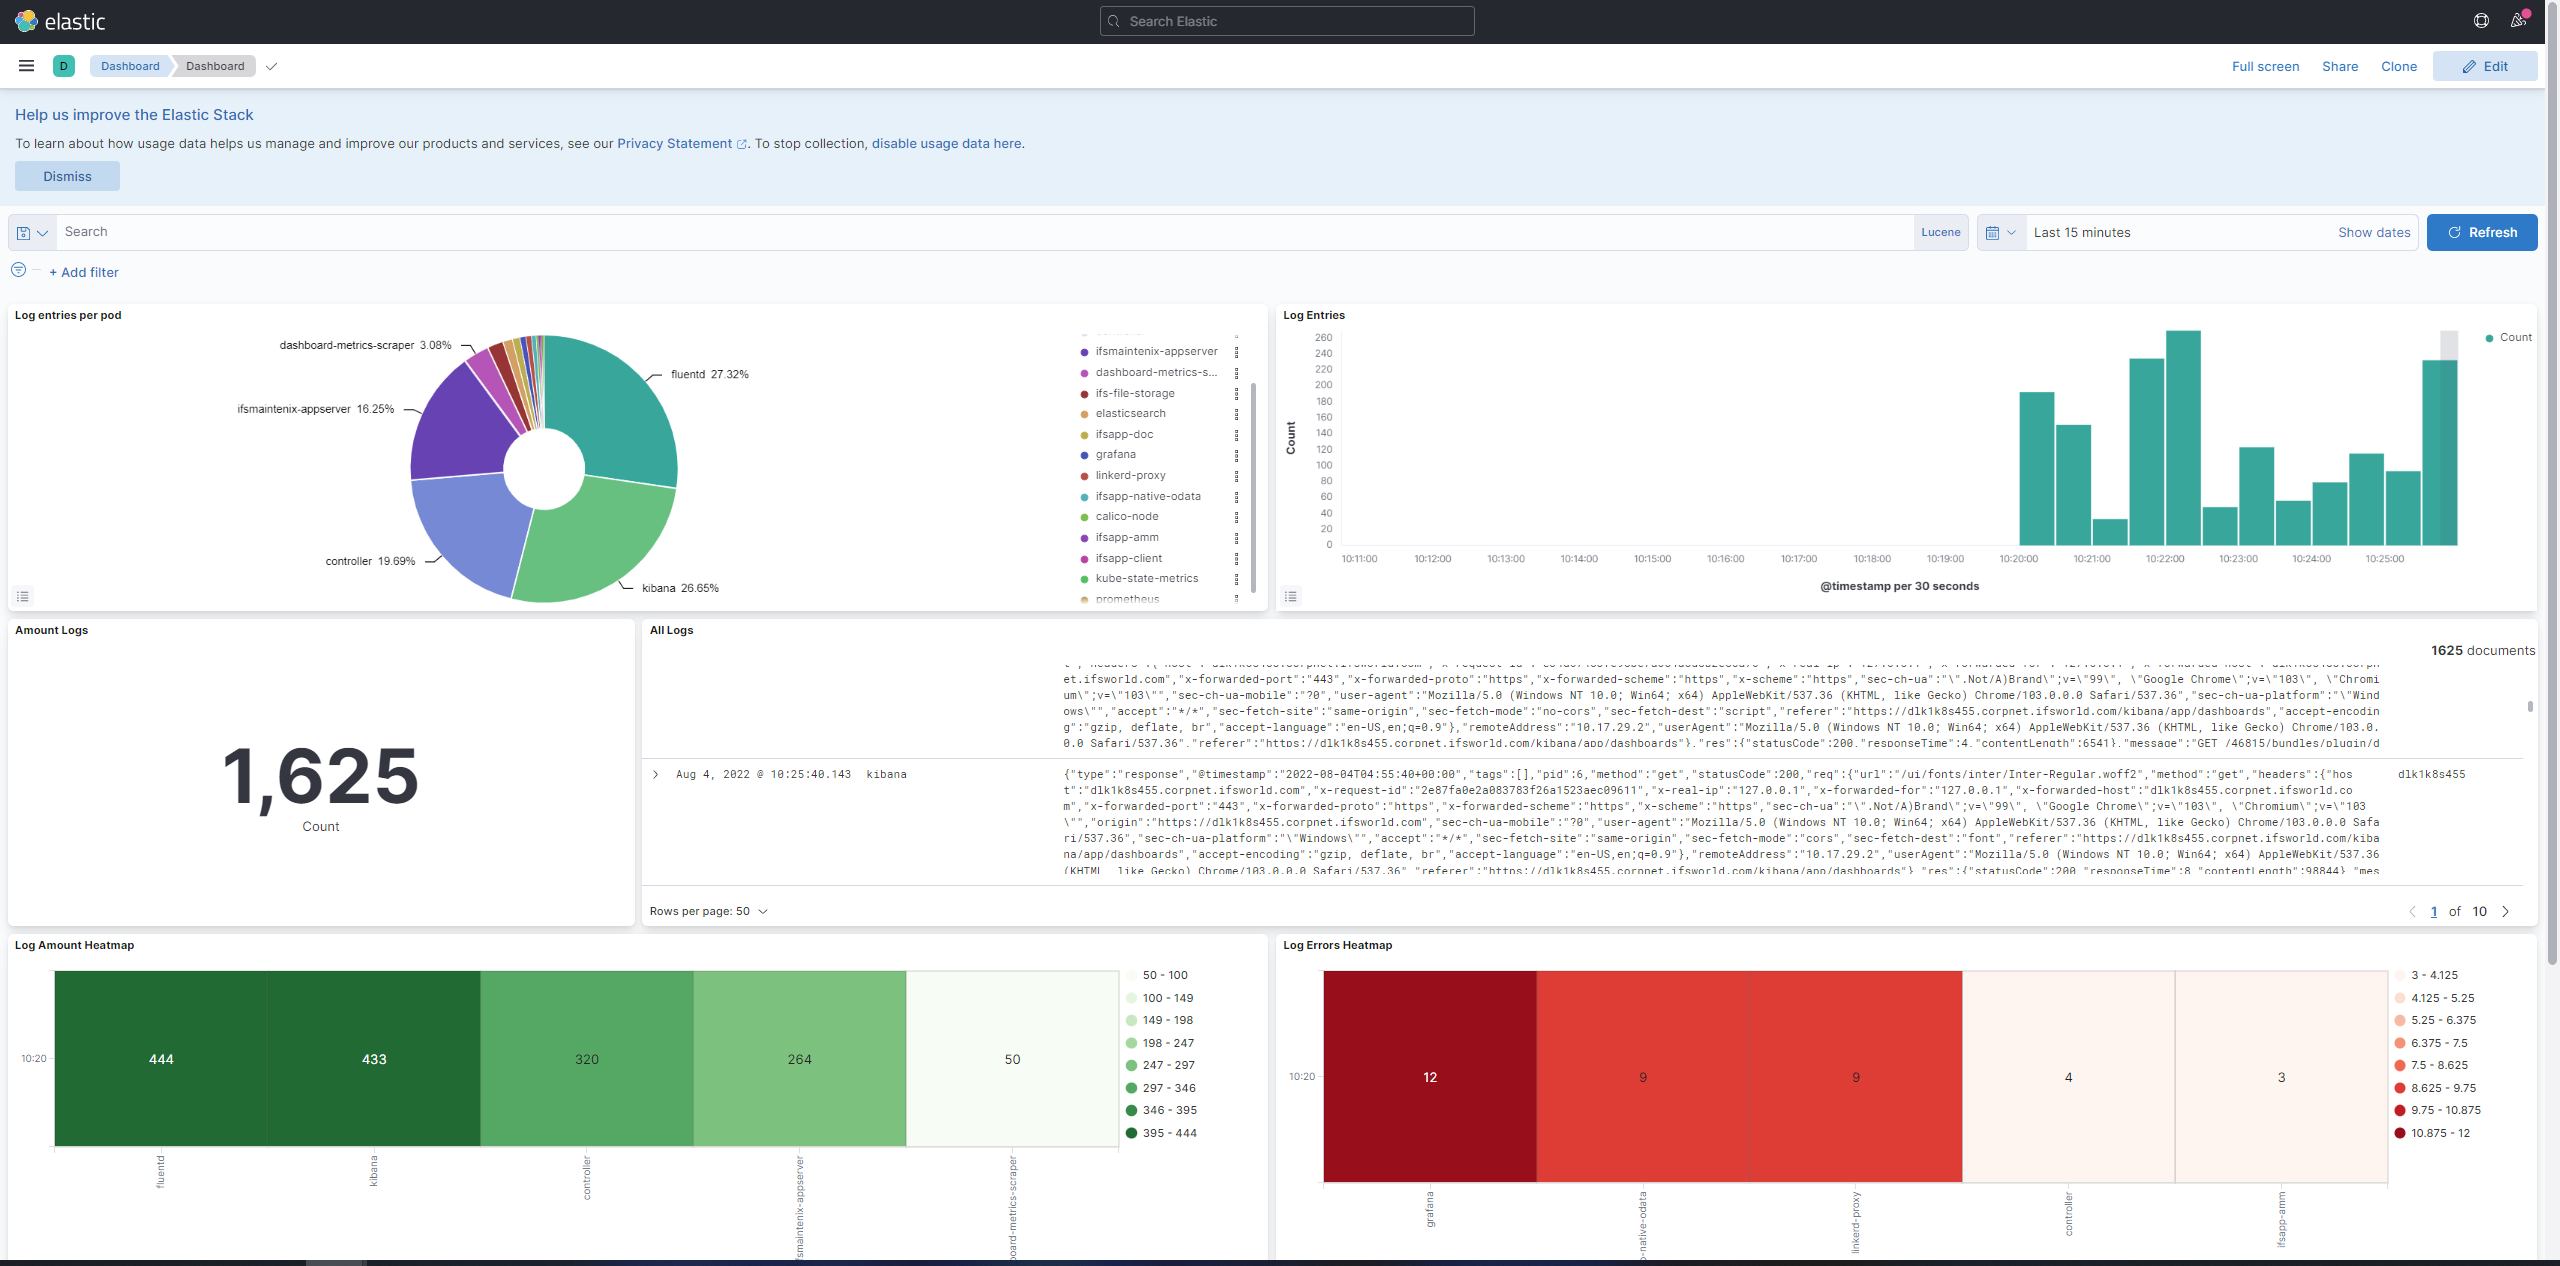
The user can check the saved dashboard by navigating to menu > Dashboard
-
Select Dashboard.
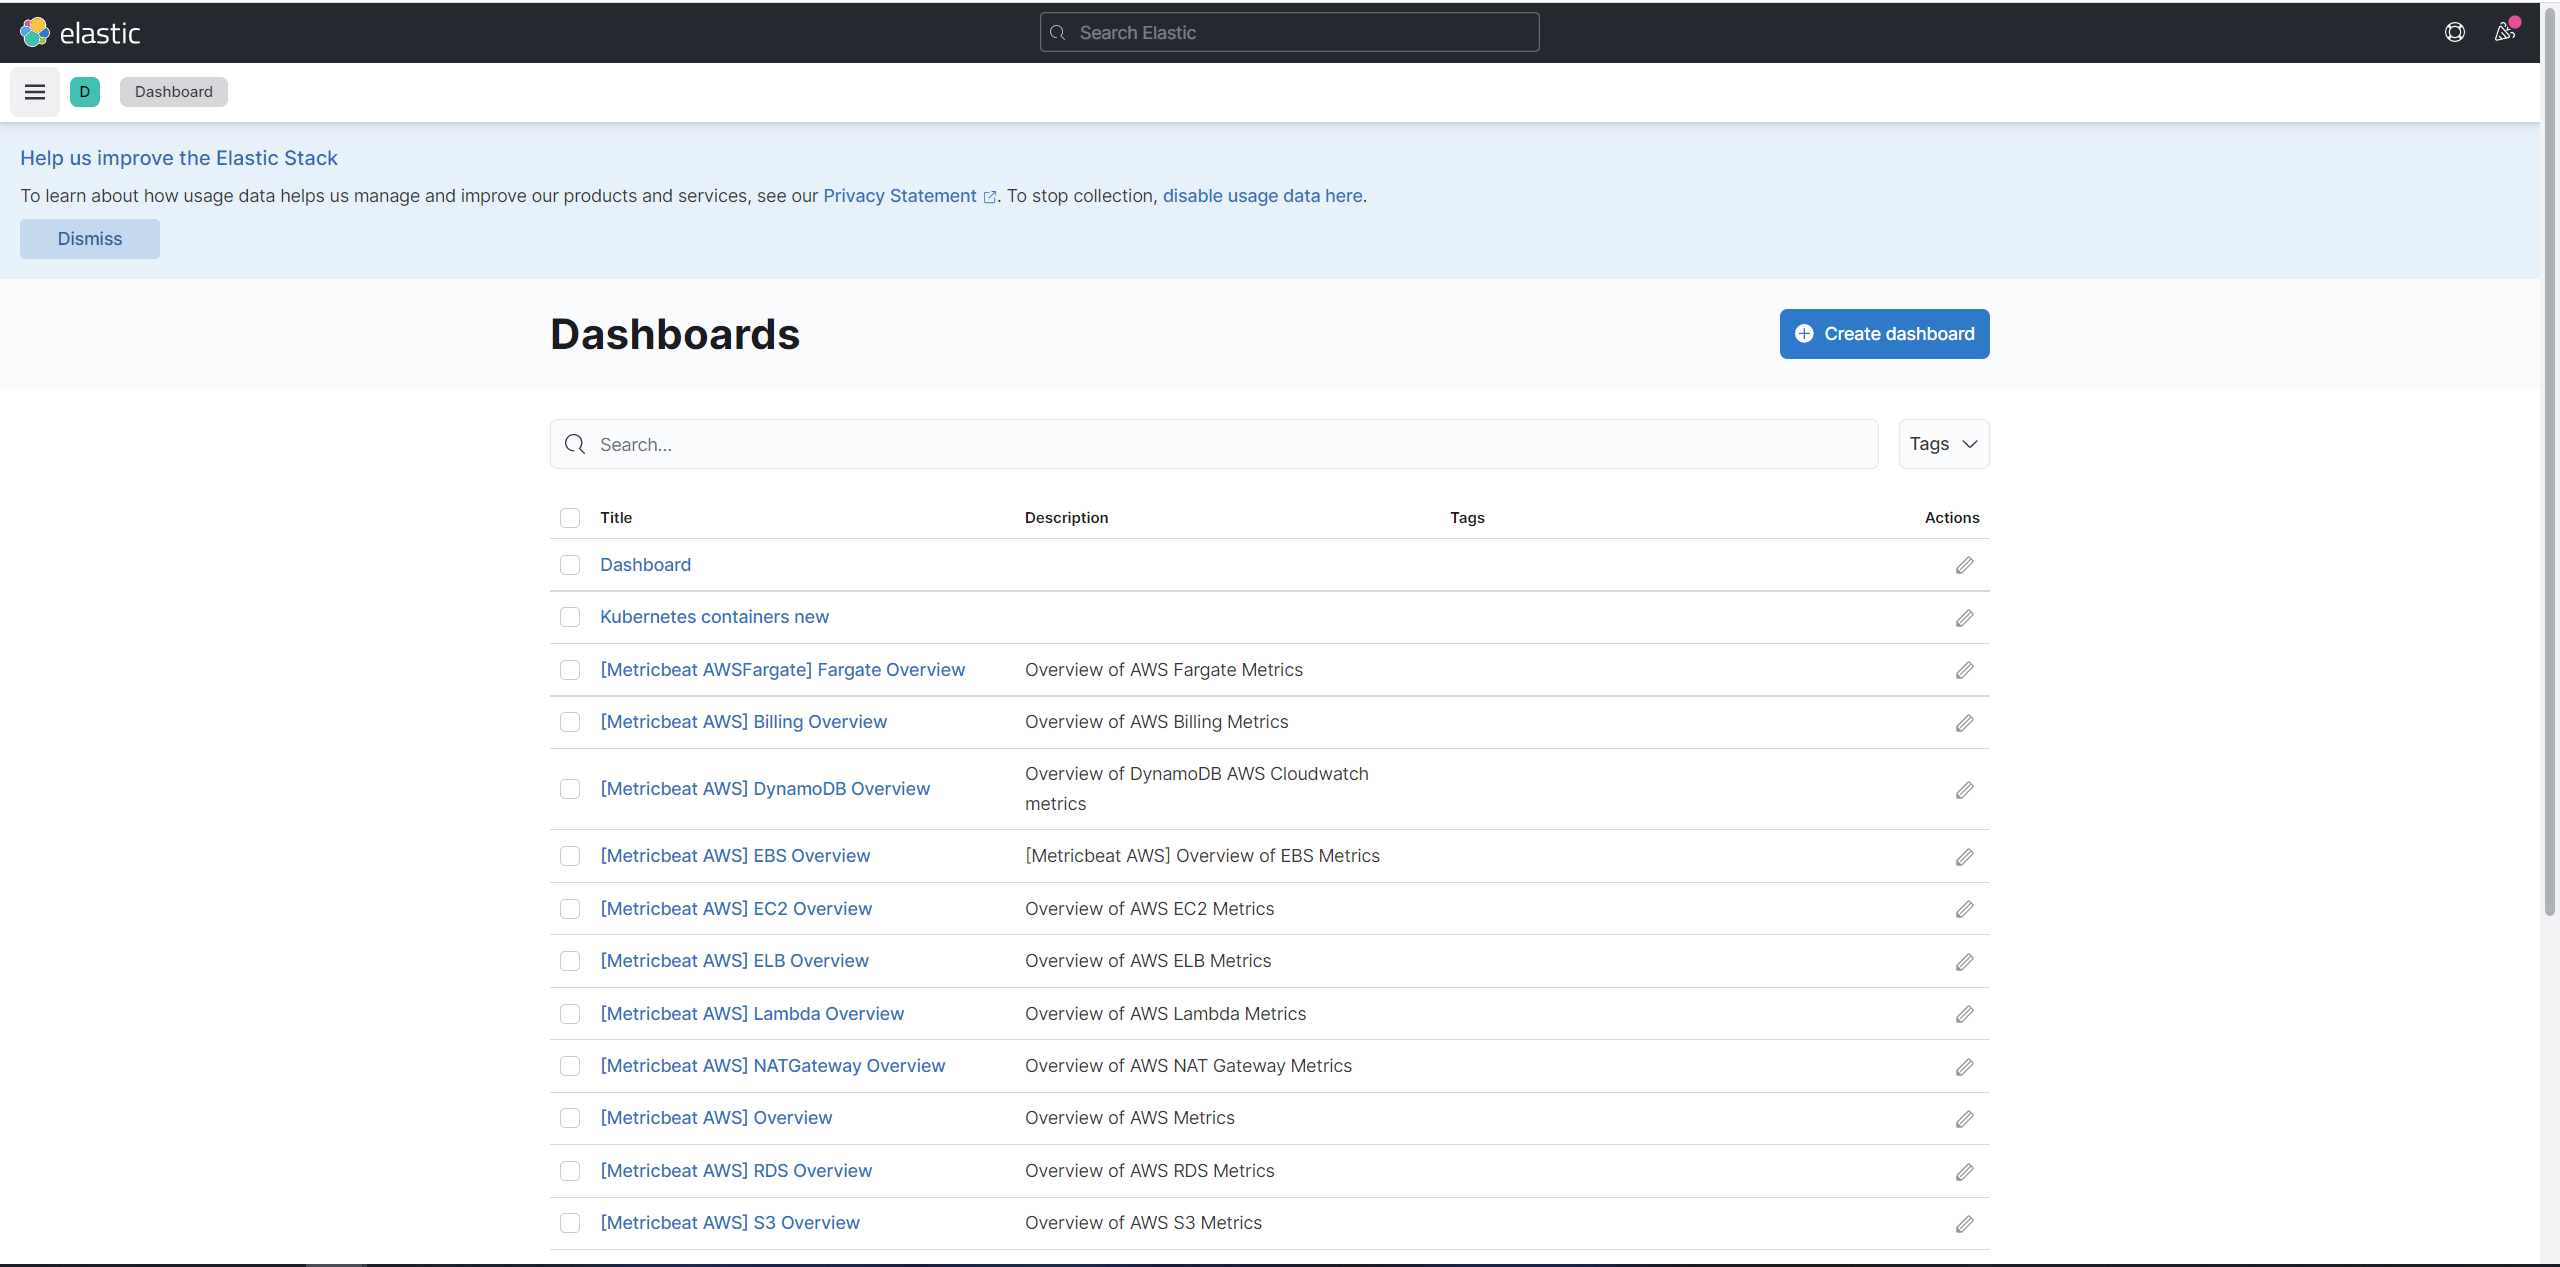
-
View the Selected Dashboard.
How to Query Container Logs using KQL
-
Click on Discover in the main menu.
-
Add the following Kibana Query into the search filter text box.
e.g. kubernetes.container_name: "ifsapp-client"
