Metrics Monitoring - Kube-Prometheus Stack
-
The Kube-Prometheus stack is a collection of Kubernetes manifests, Grafana dashboards, and Prometheus rules combined with documentation and scripts, that provide easy-to-operate, end-to-end Kubernetes cluster monitoring with Prometheus, using the Prometheus Operator.
-
Grafana allows users to query, visualize, and understand user metrics regardless of where they are stored. Grafana also enables creating, exploring, and sharing appealing dashboards with users, fostering a data-driven culture.
NOTE: The data retention size and period of Prometheus are respectively 7GB and 16 days.
Content:
-
How to Access Grafana Dashboard
-
How to View Grafana default Dashboards
-
How to Import Grafana Dashboards
Grafana Versions
Grafana from 22R2 GA to 22R2 SU7
Accessing Grafana Dashboards
1. Browse the Grafana Dashboard of IFS Remote Solution. [Log in to Grafana]
- e.g. Browse to https://Linuxhost/grafana
2. Authentication
-
Enter the username and password to log in to dashboards.
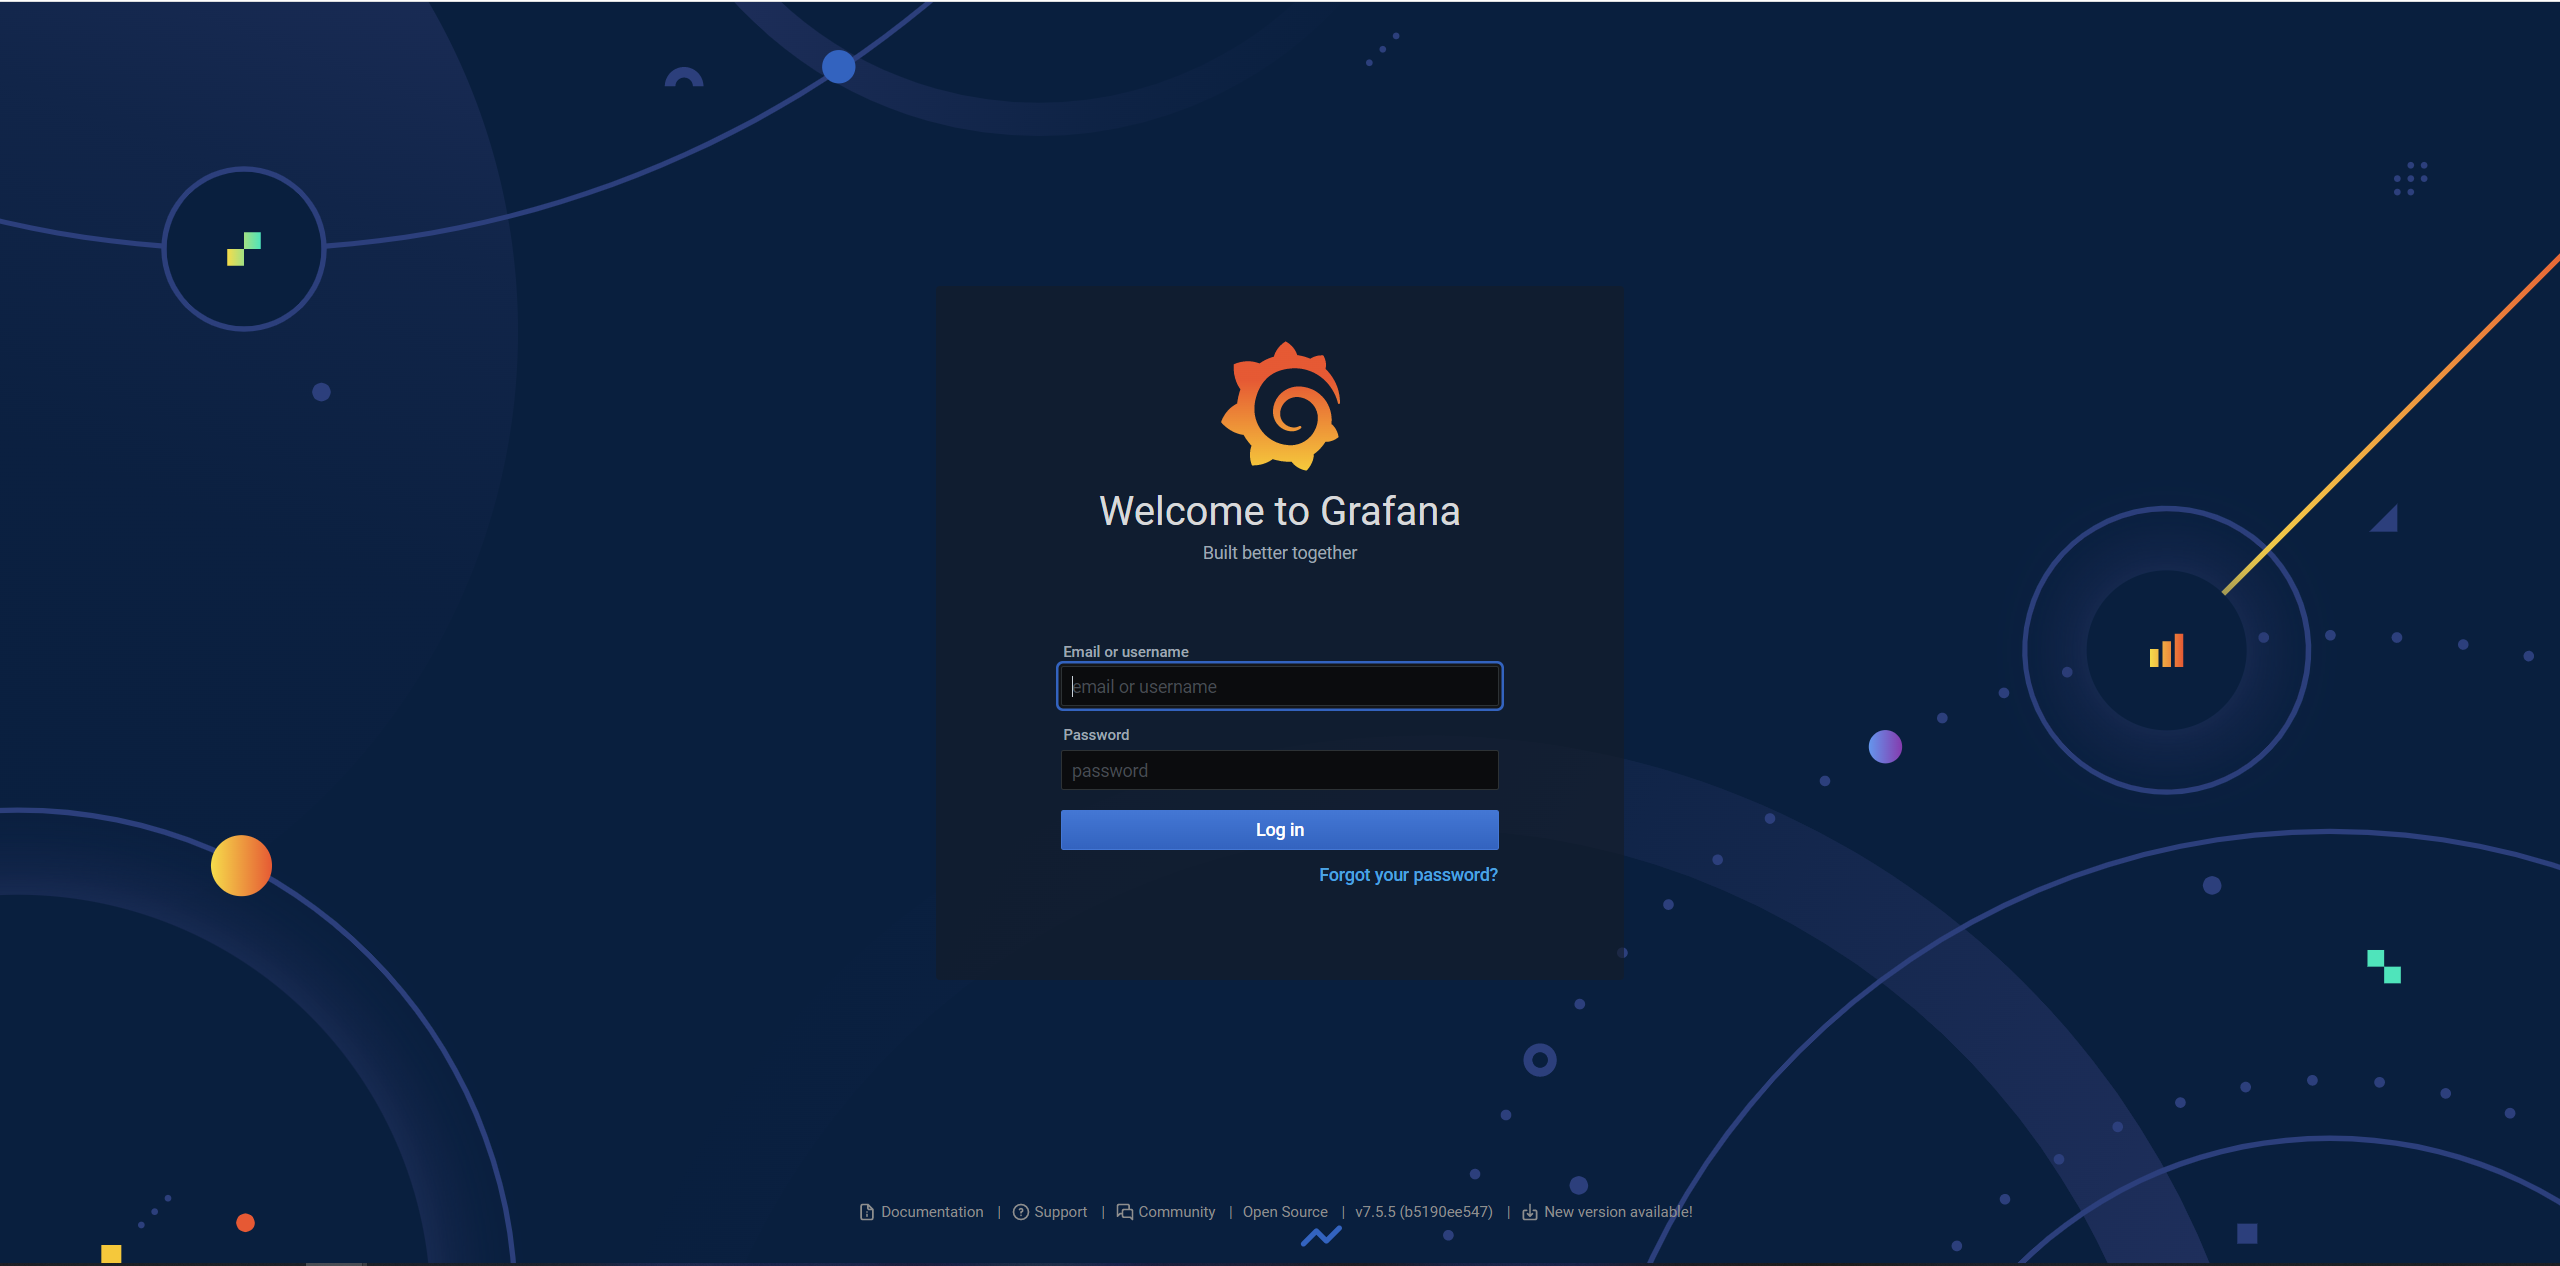
-
Extract the username and password from the IFS-Remote Monitoring file location in your windows machine: ifsroot > config > secrets > grafana_creds file
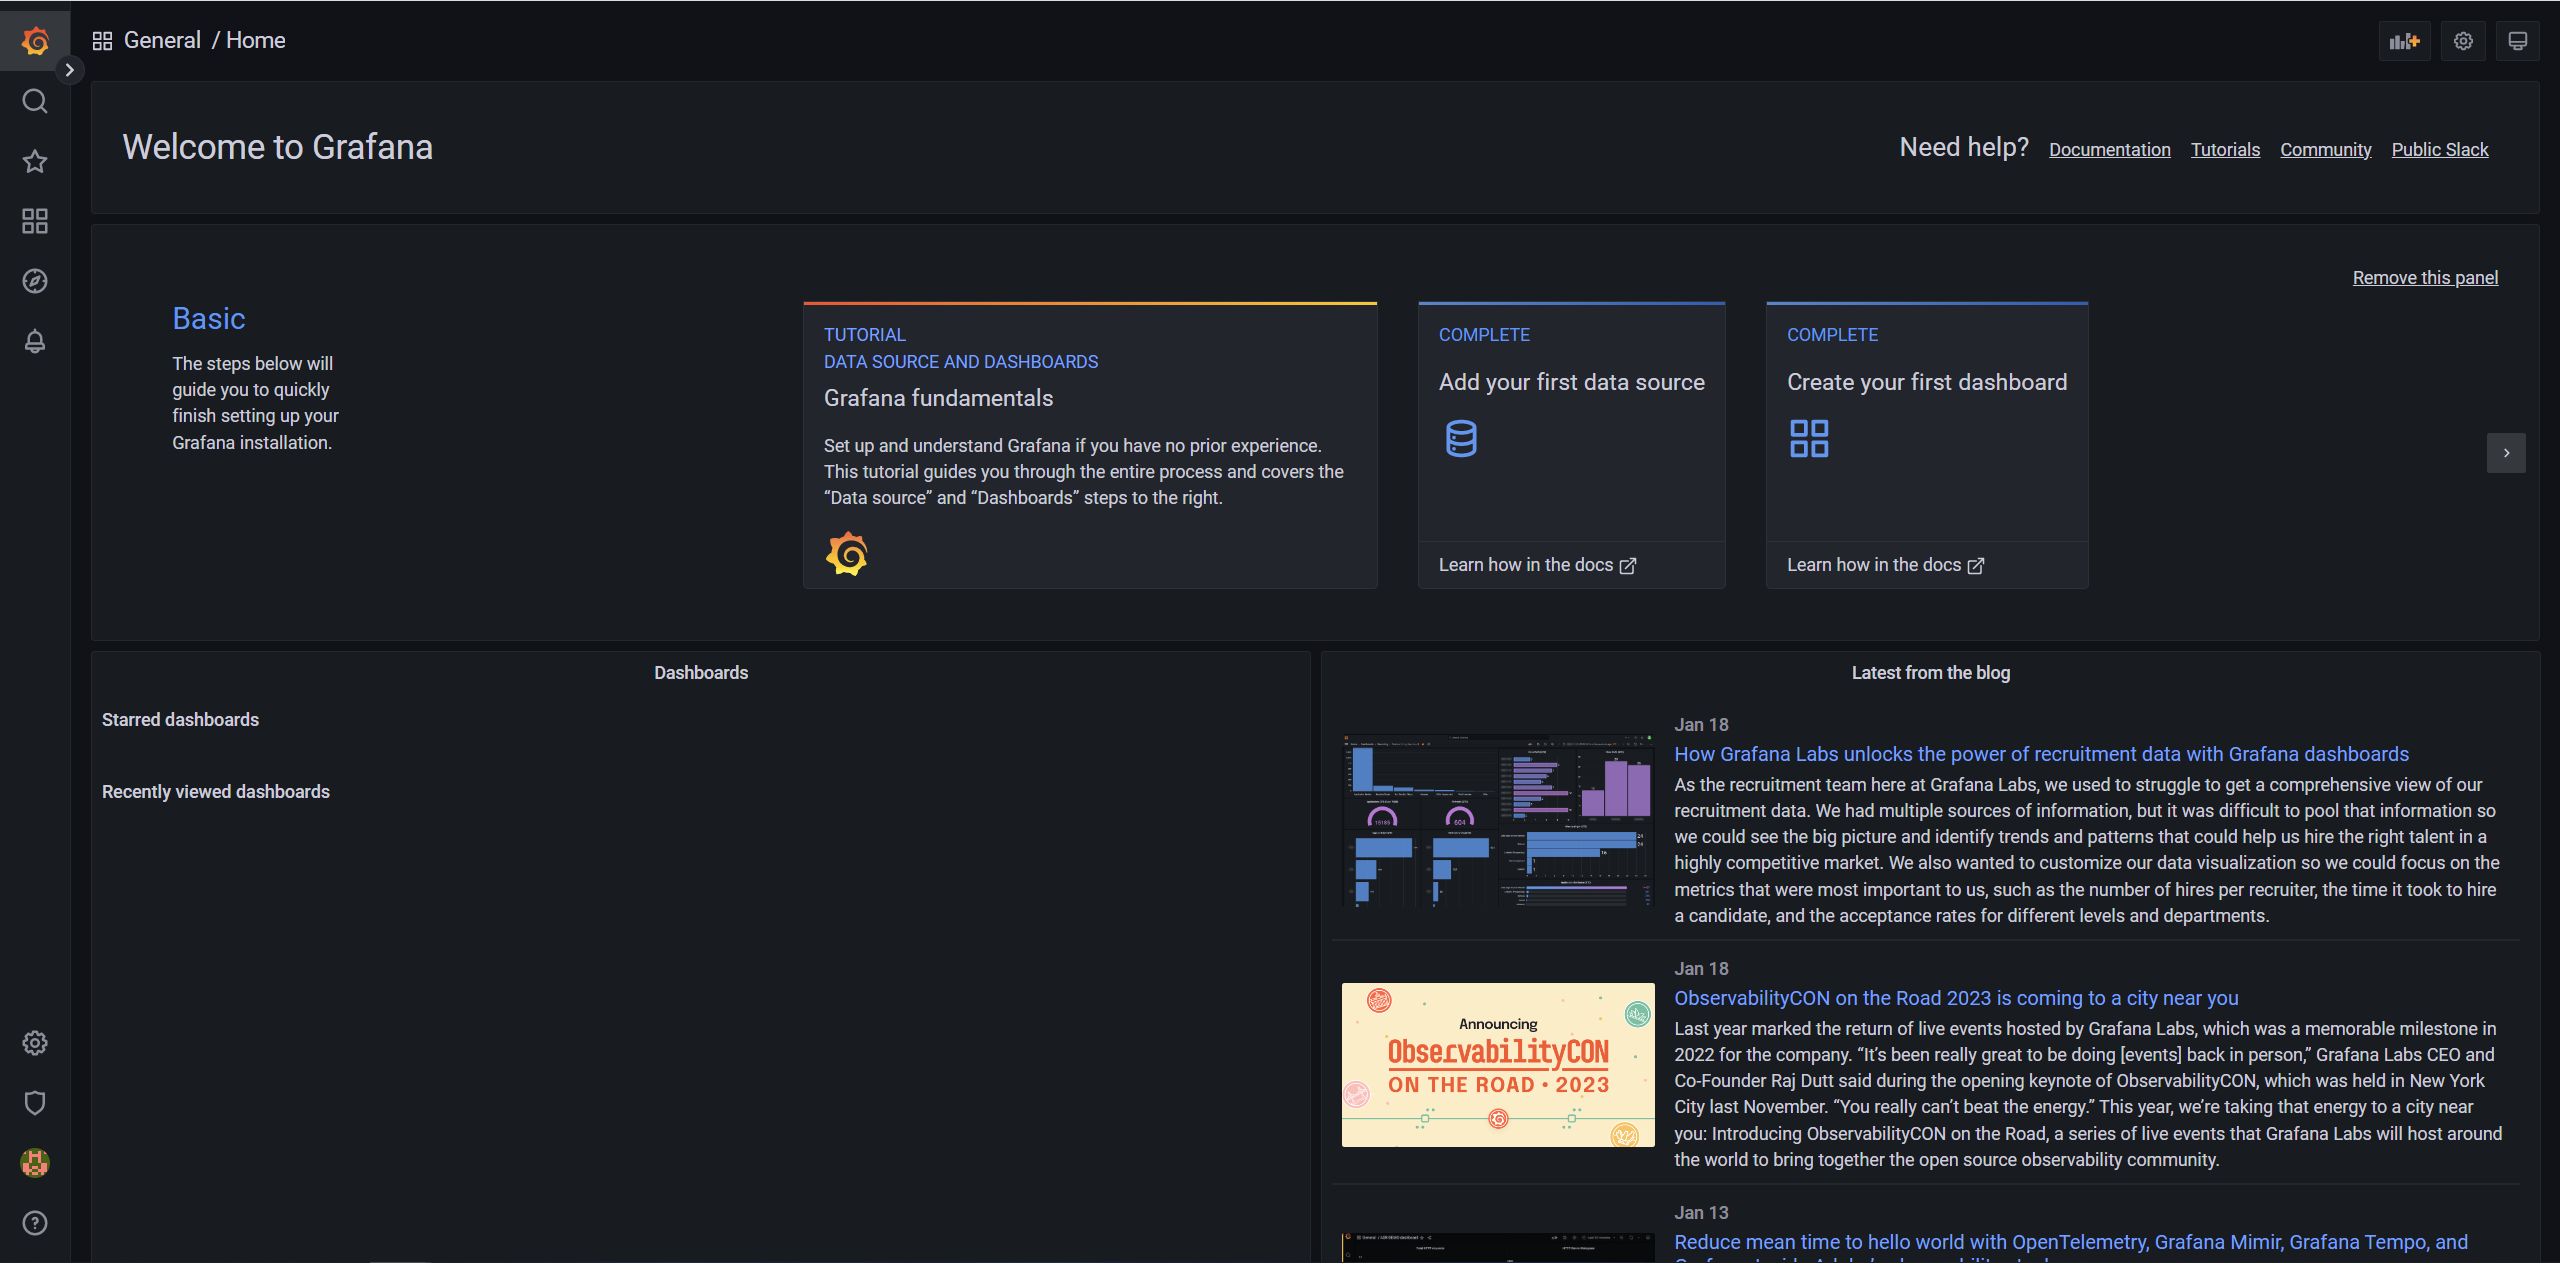
-
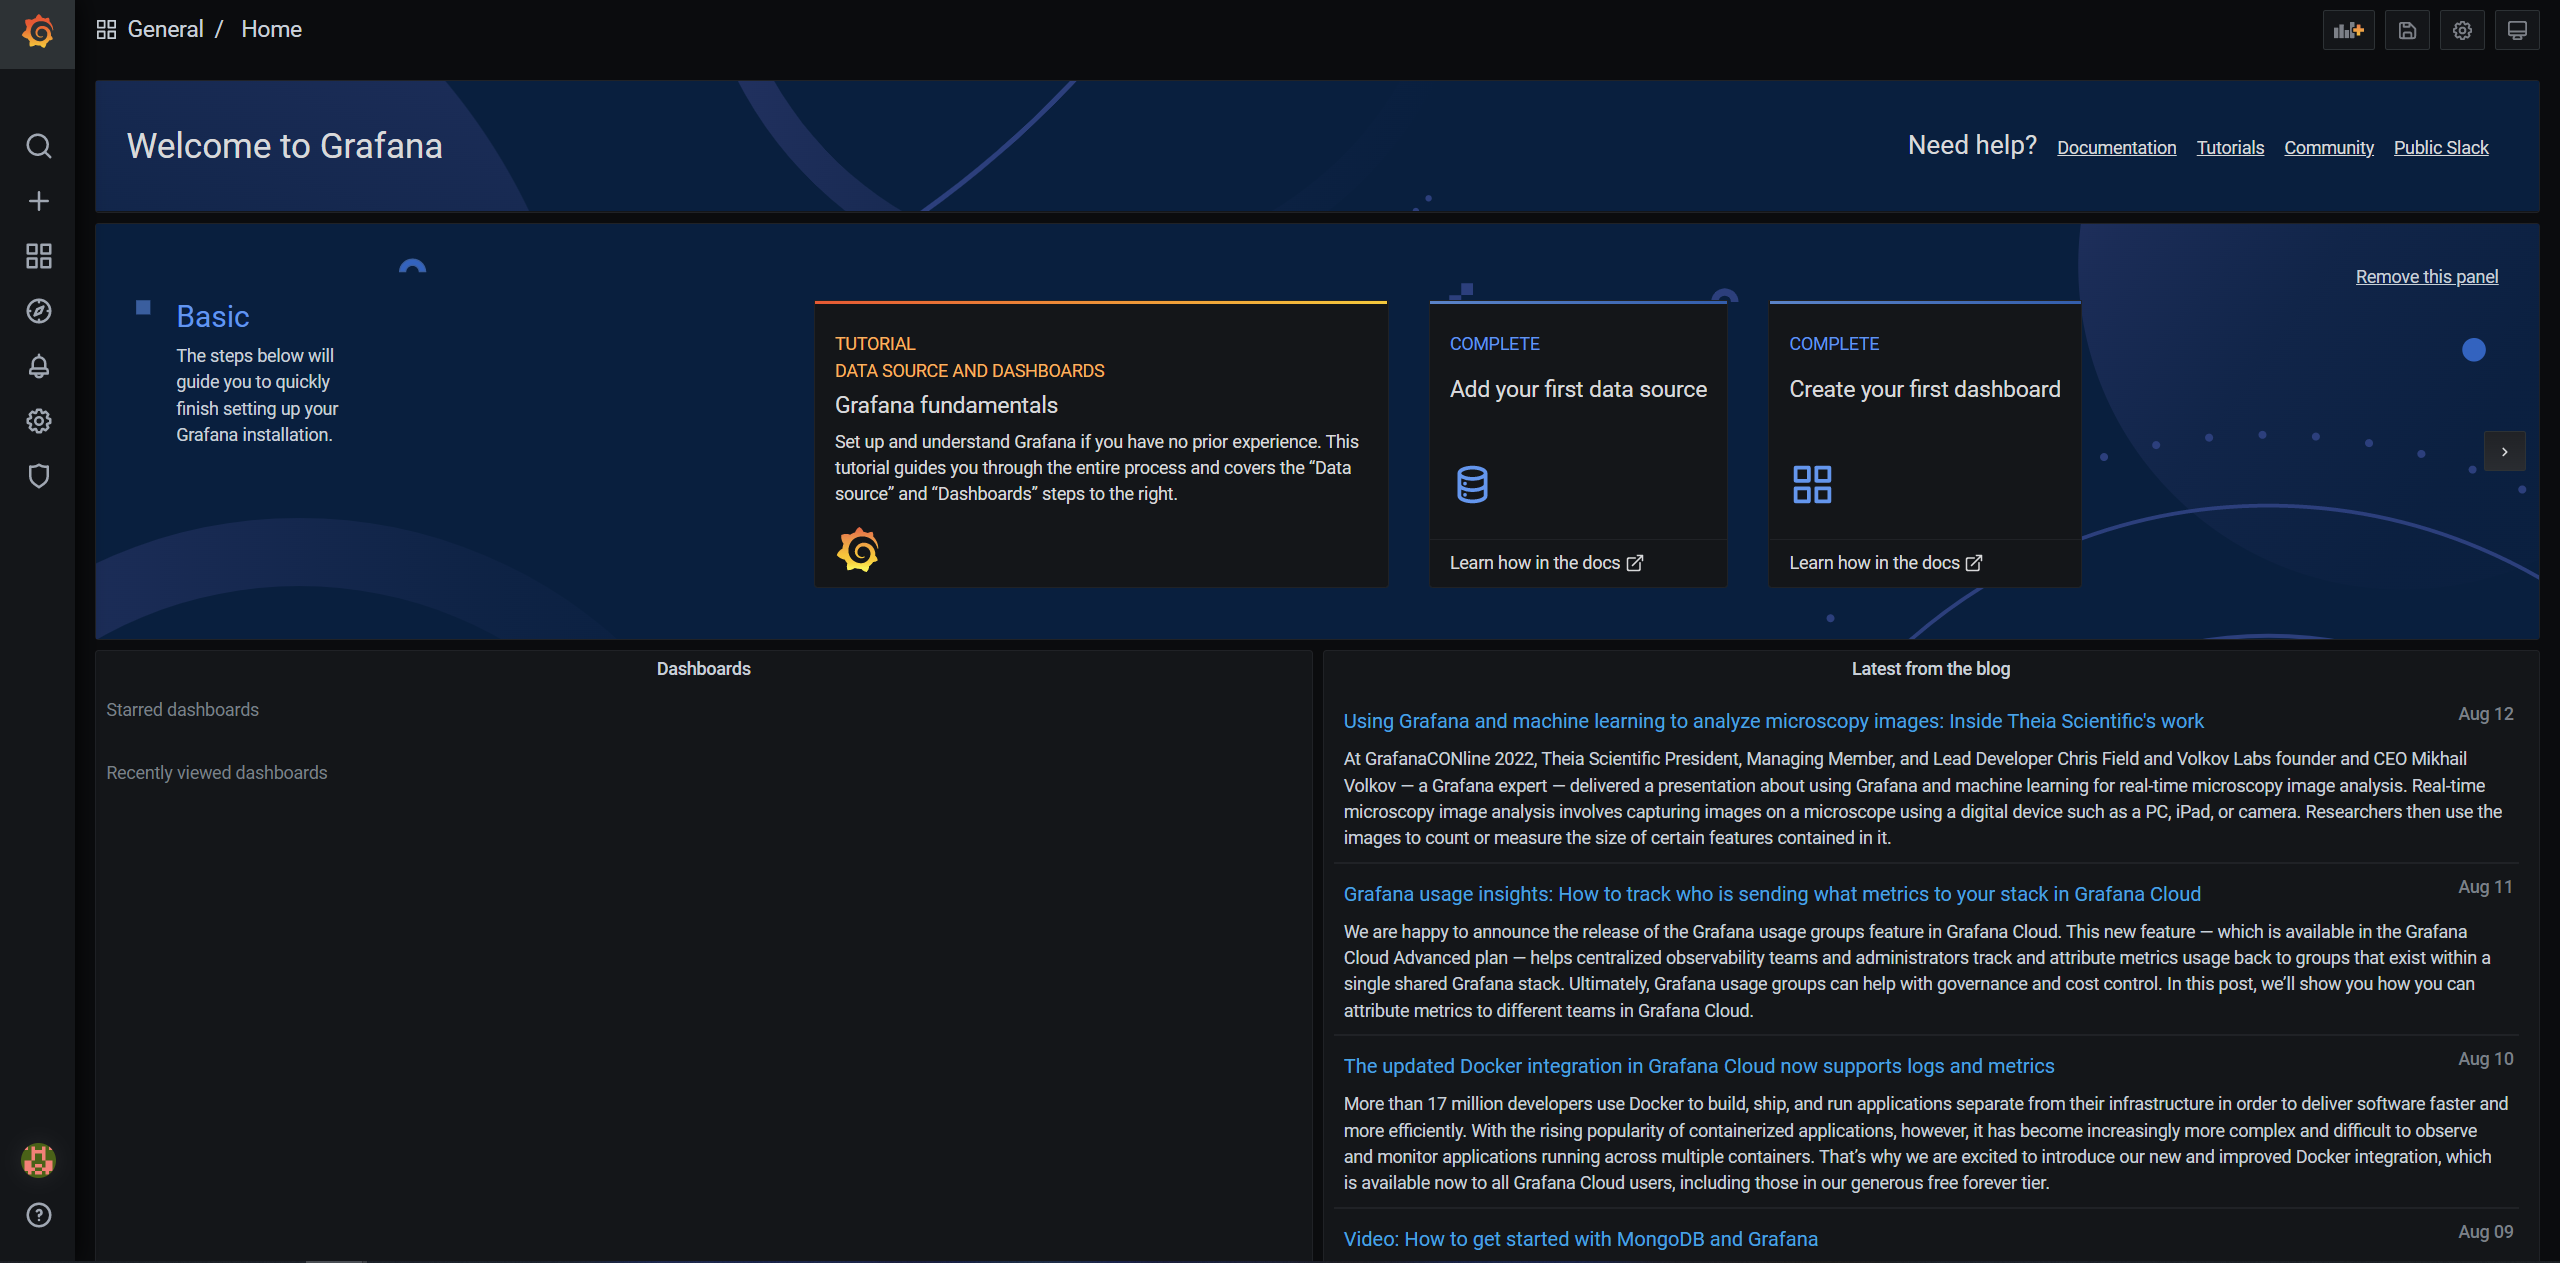
Grafana Home Page.
Viewing Grafana default Dashboards
-
Navigate to Manage from the menu.
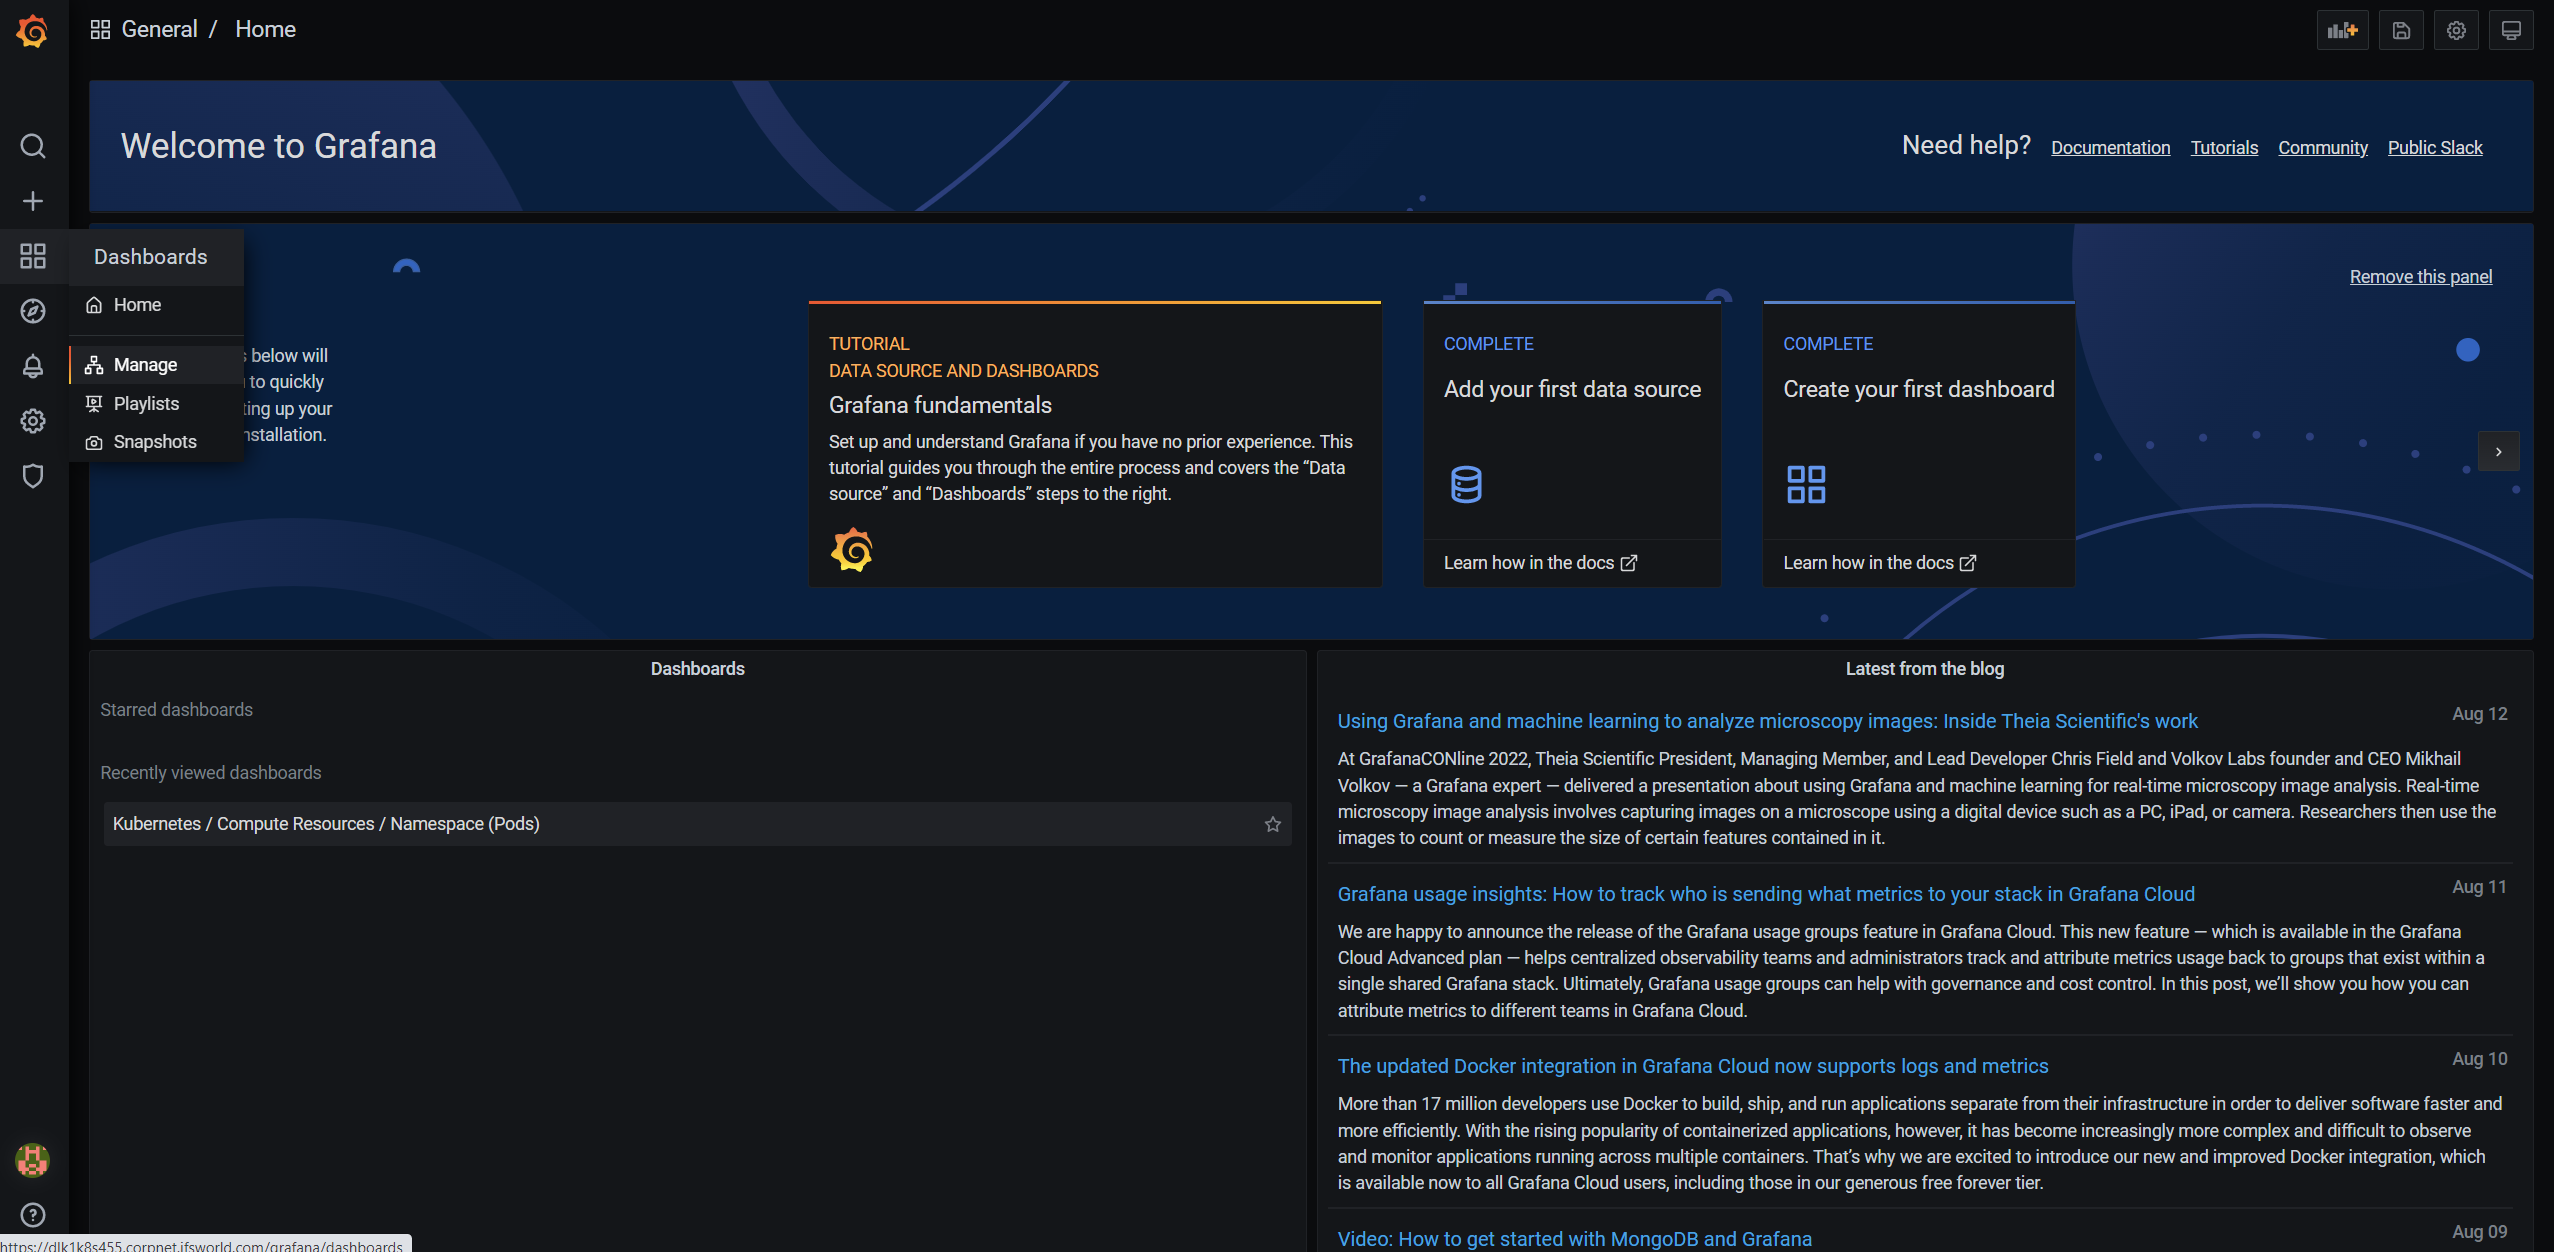
-
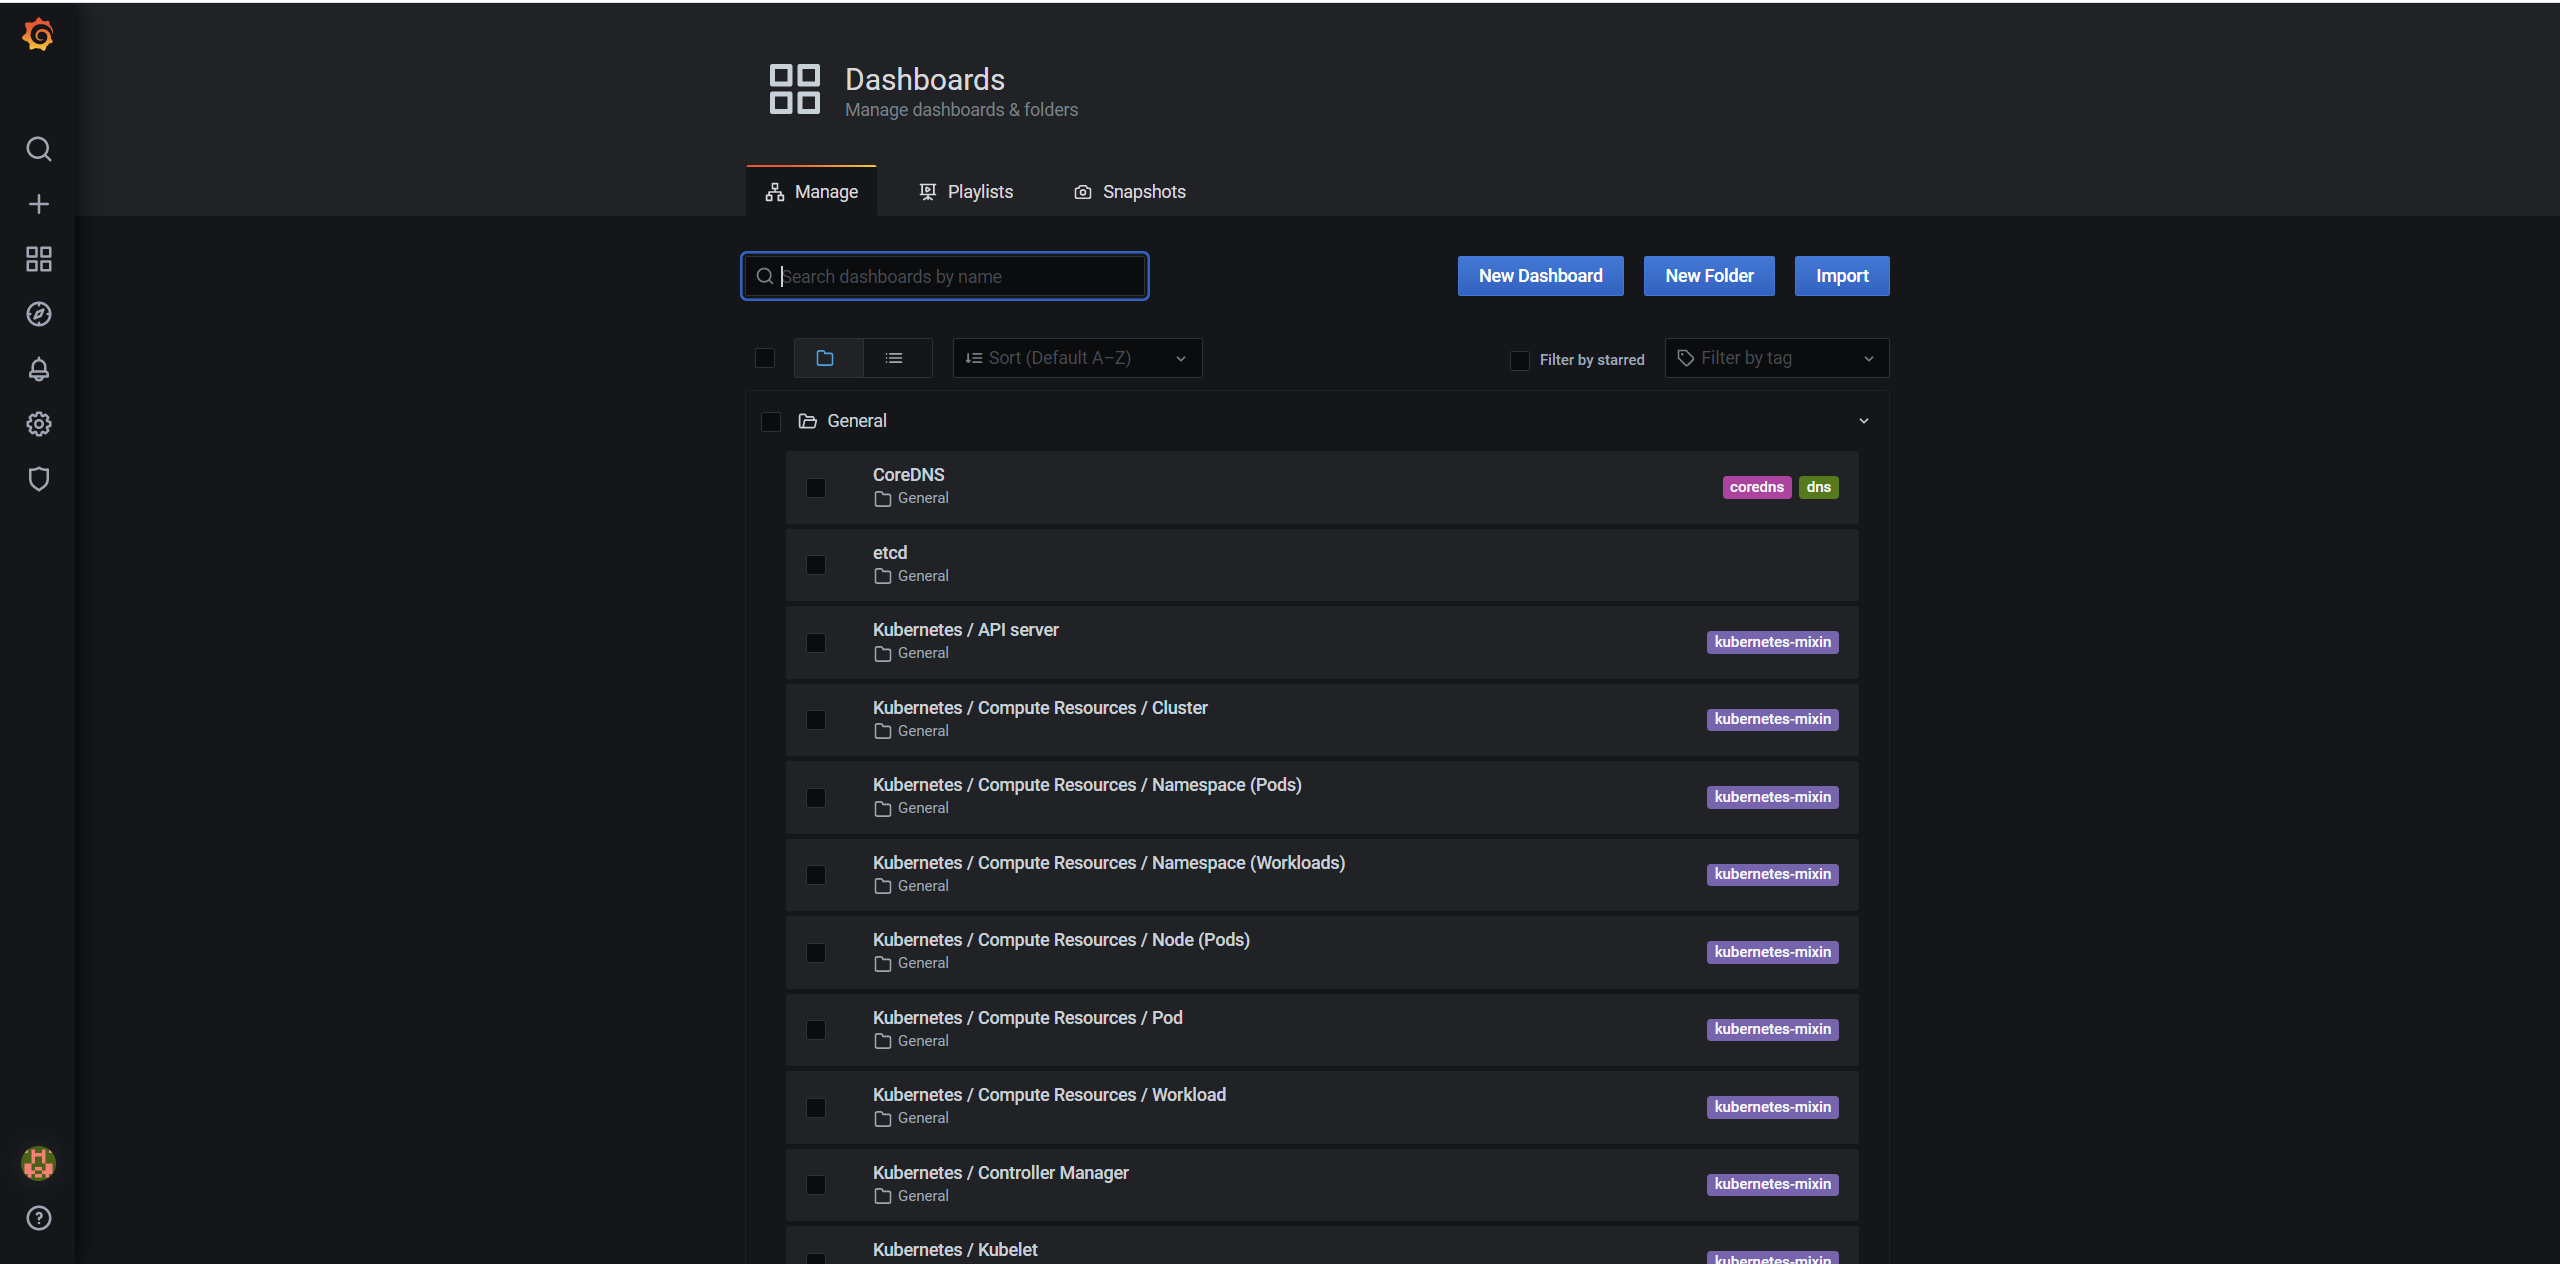
View the Current Dashboard List.
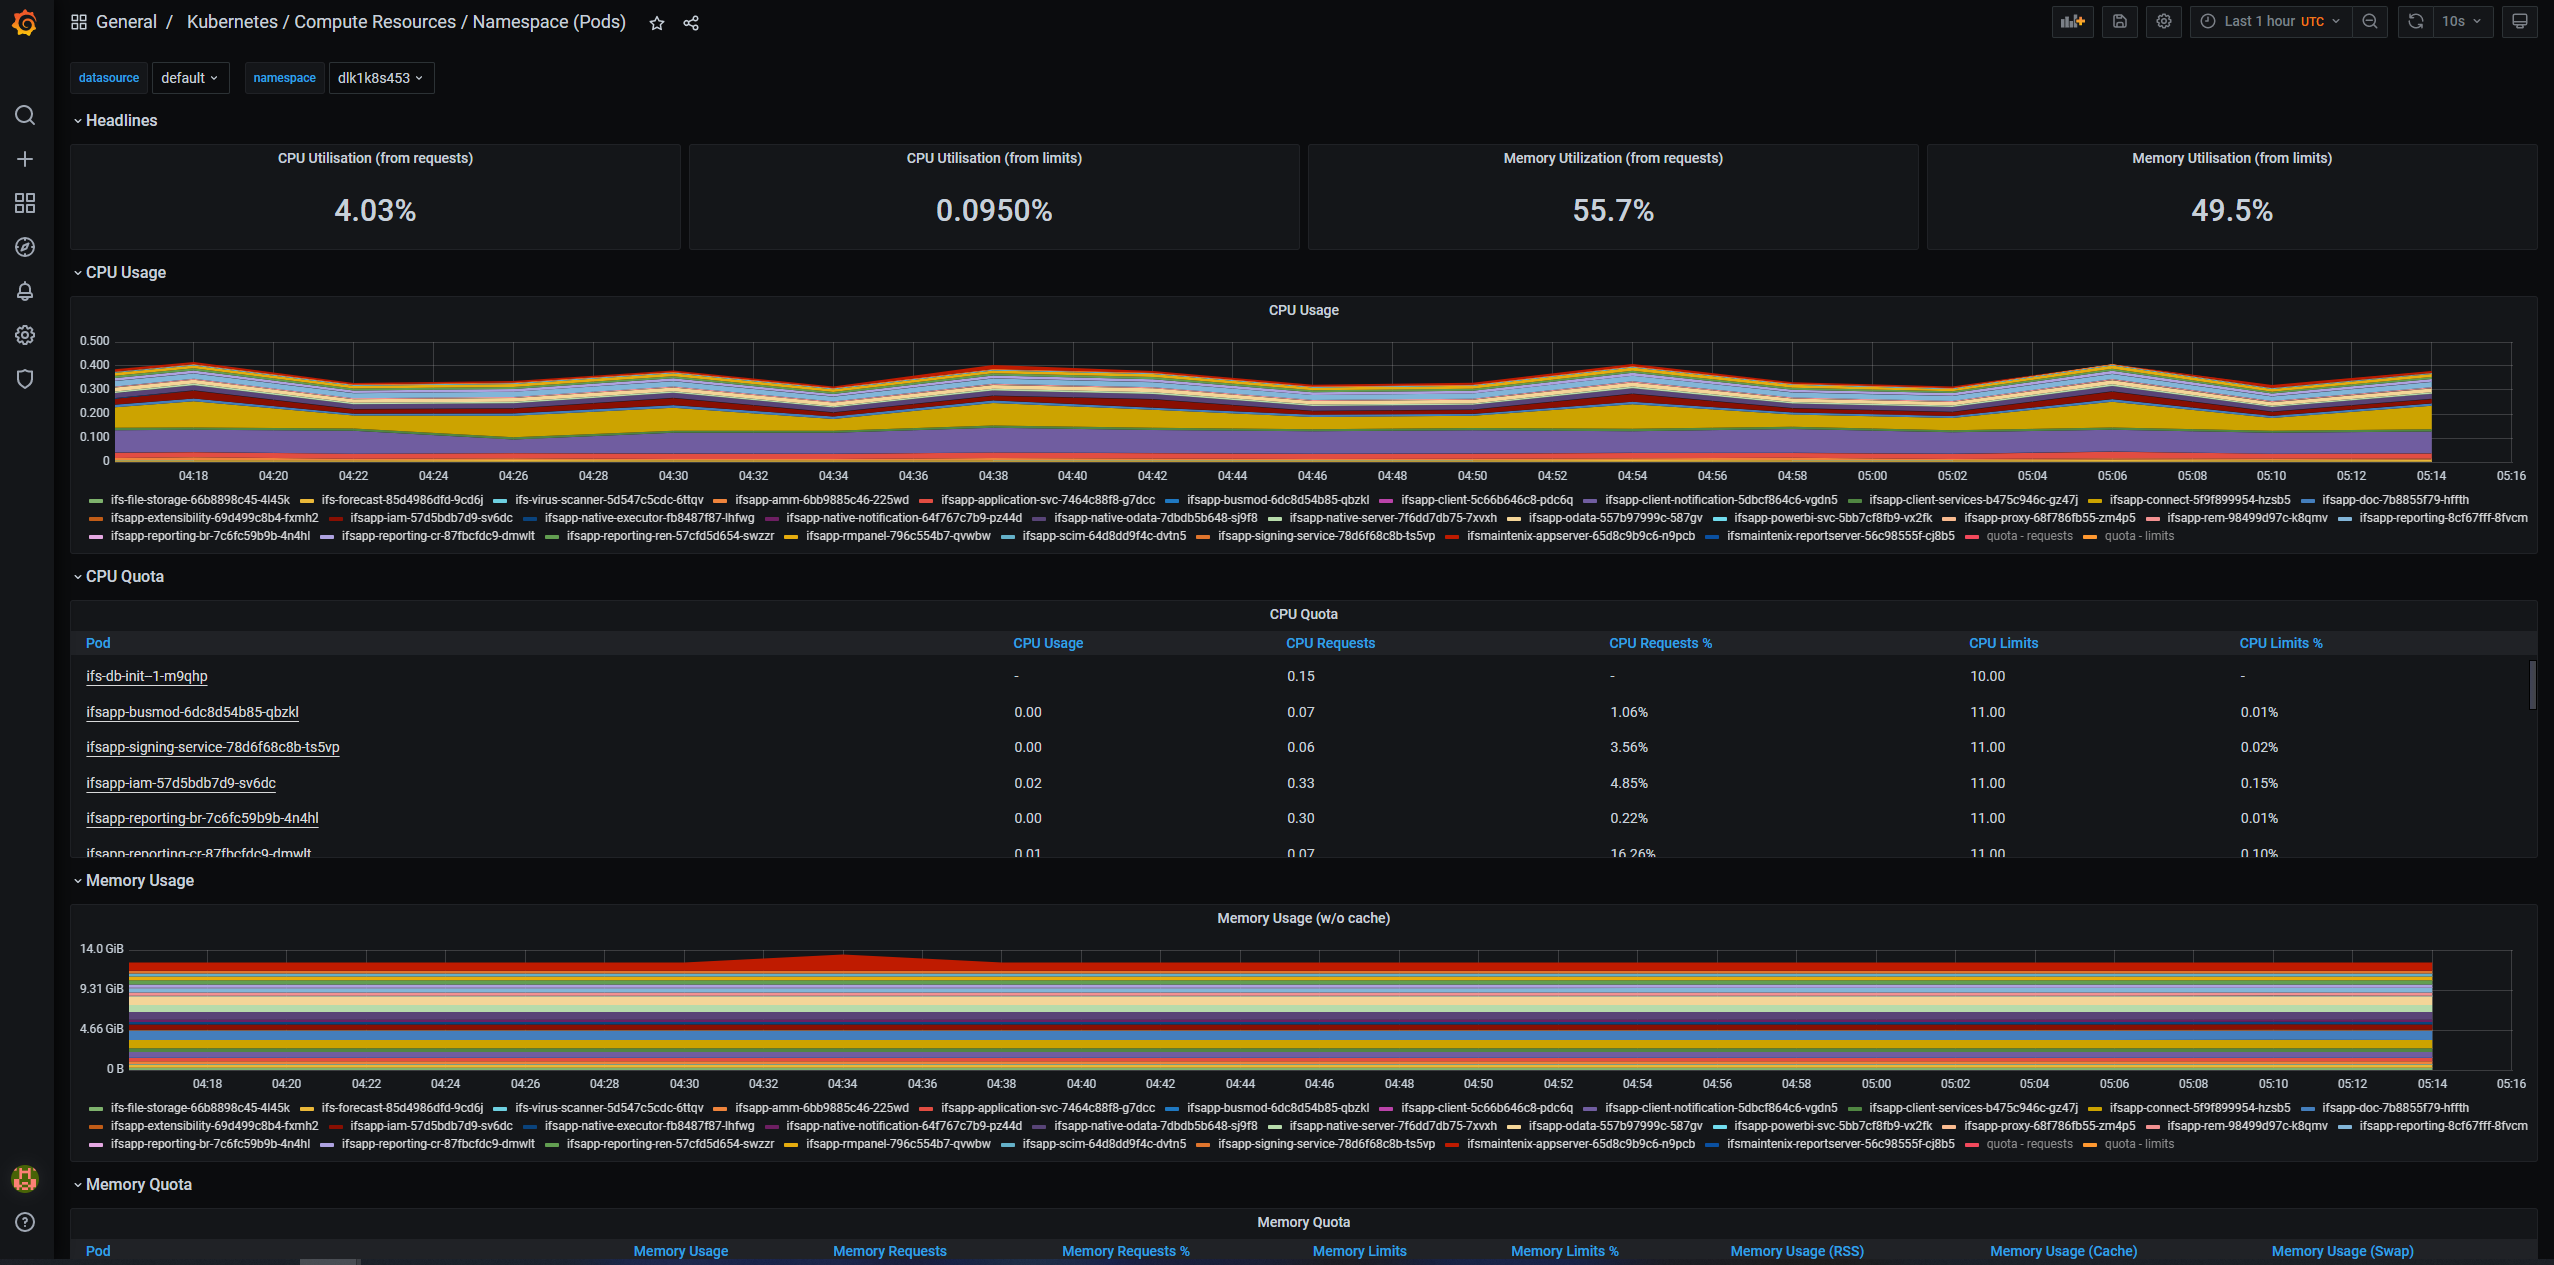
 Use the below dashboards to monitor metrics:
- Kubernetes / Compute Resources / Cluster
- Kubernetes / Compute Resources / Namespace (Pods)
- Kubernetes / Compute Resources / Namespace (Workloads)
- Kubernetes / Compute Resources / Node (Pods)
- Kubernetes / Compute Resources / Pod
- Kubernetes / Compute Resources / Workload
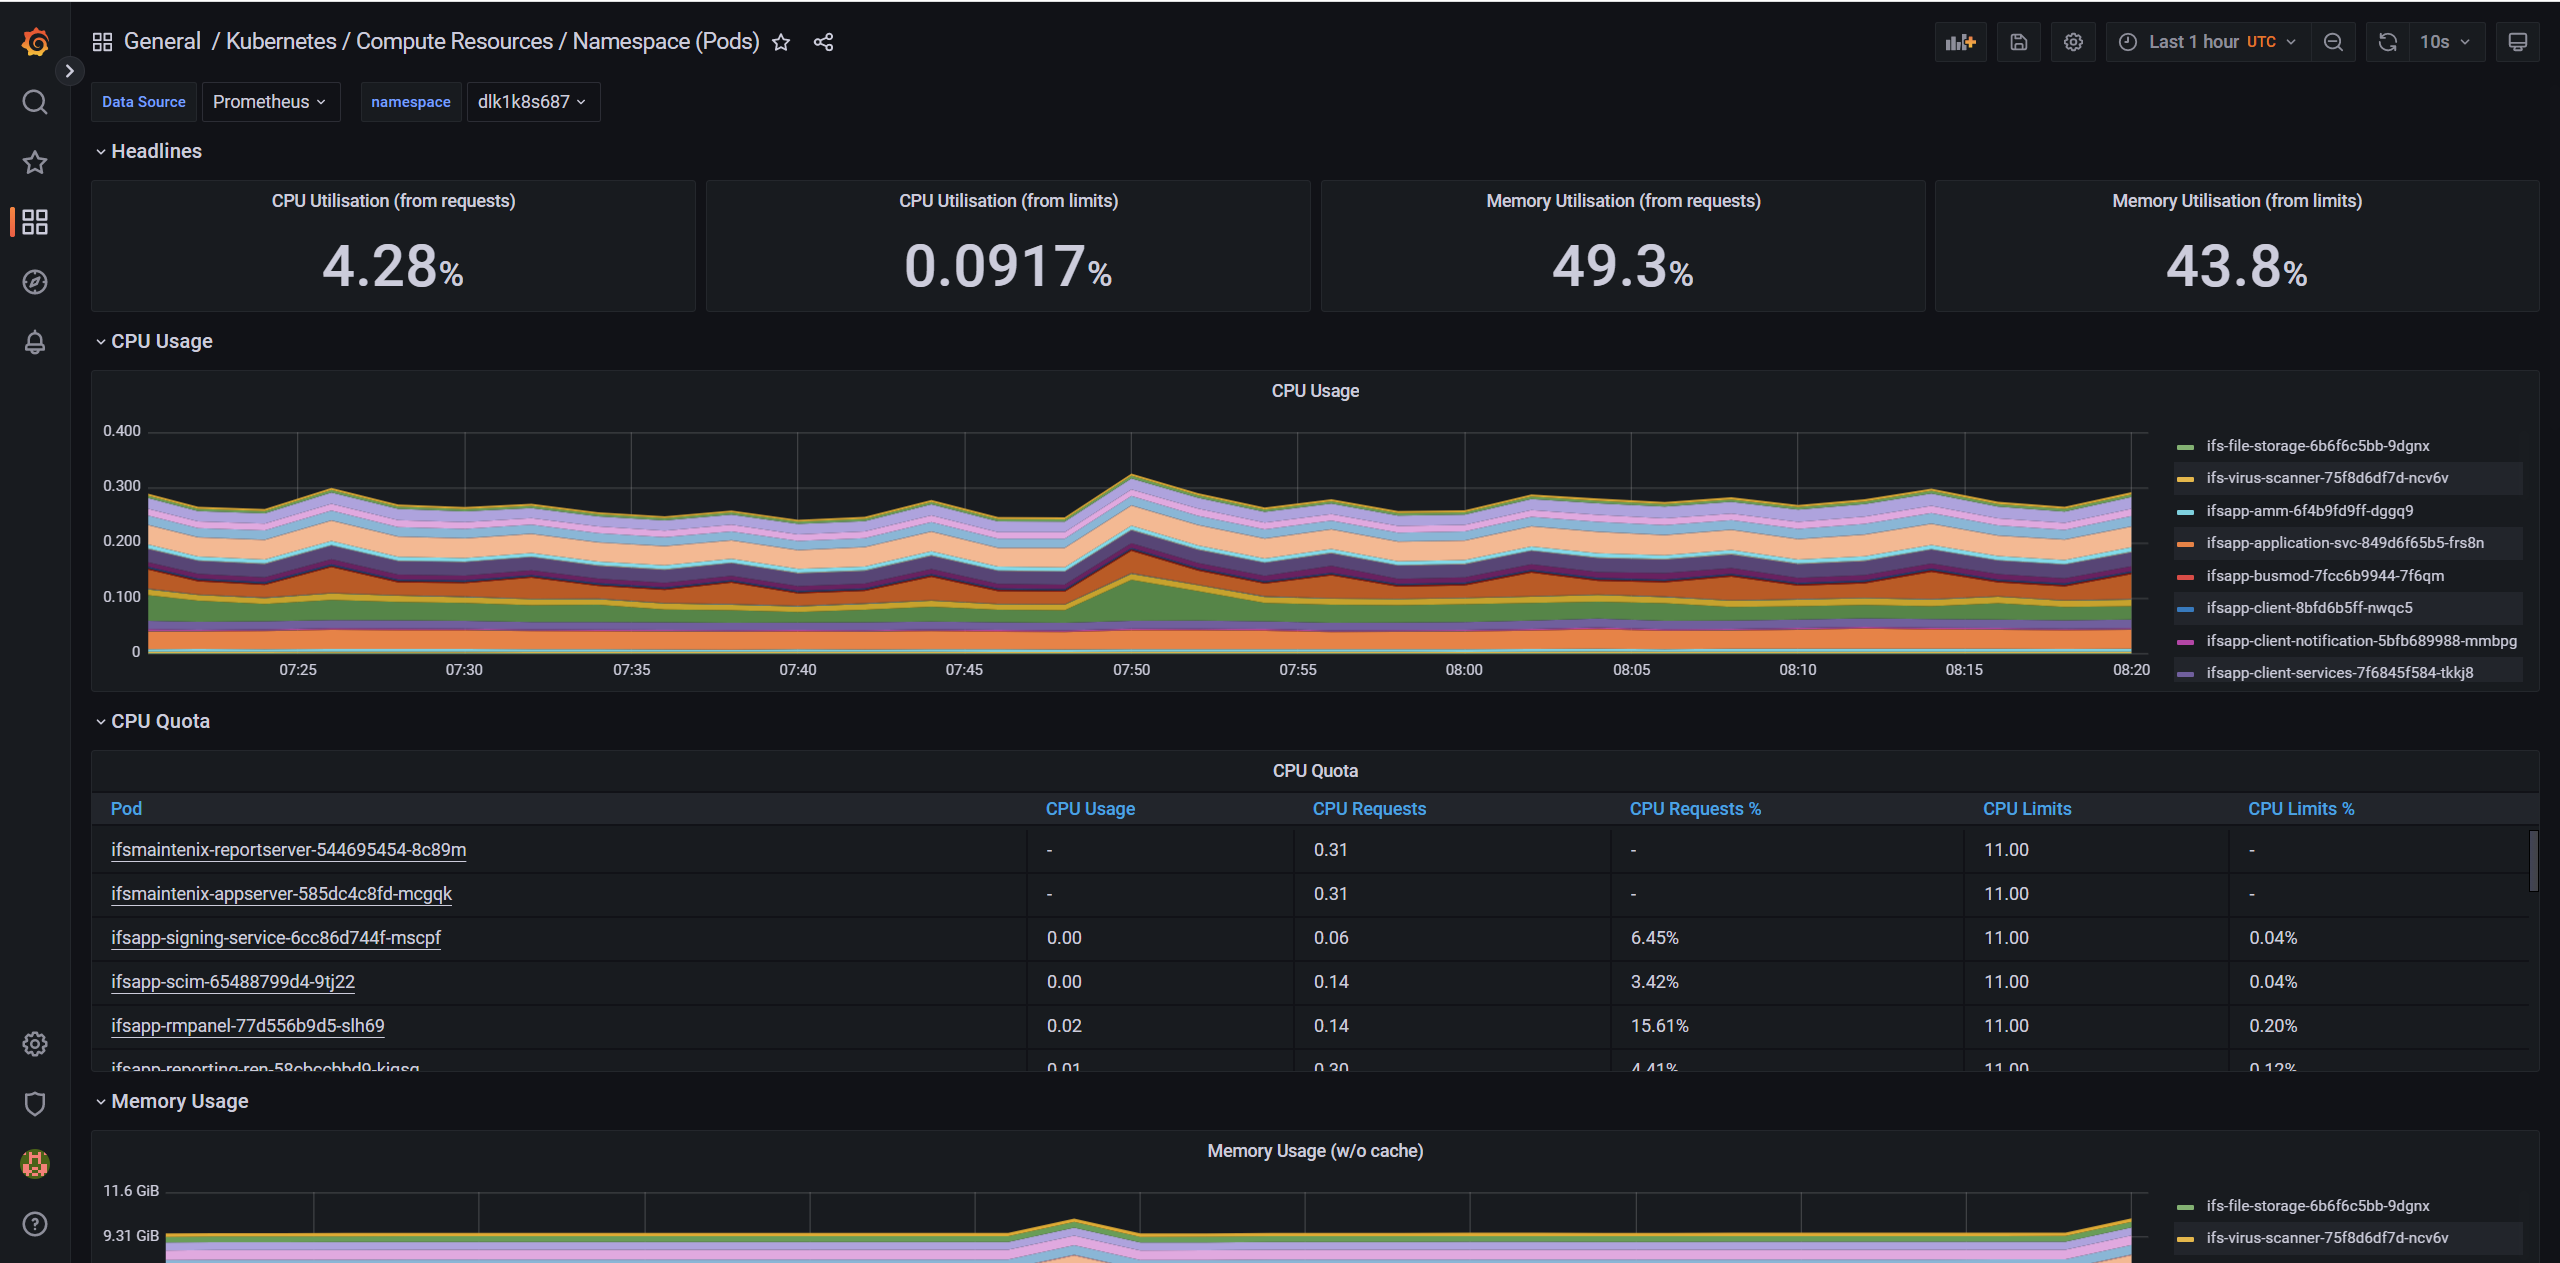
-
The following is the Grafana Dashboard view.
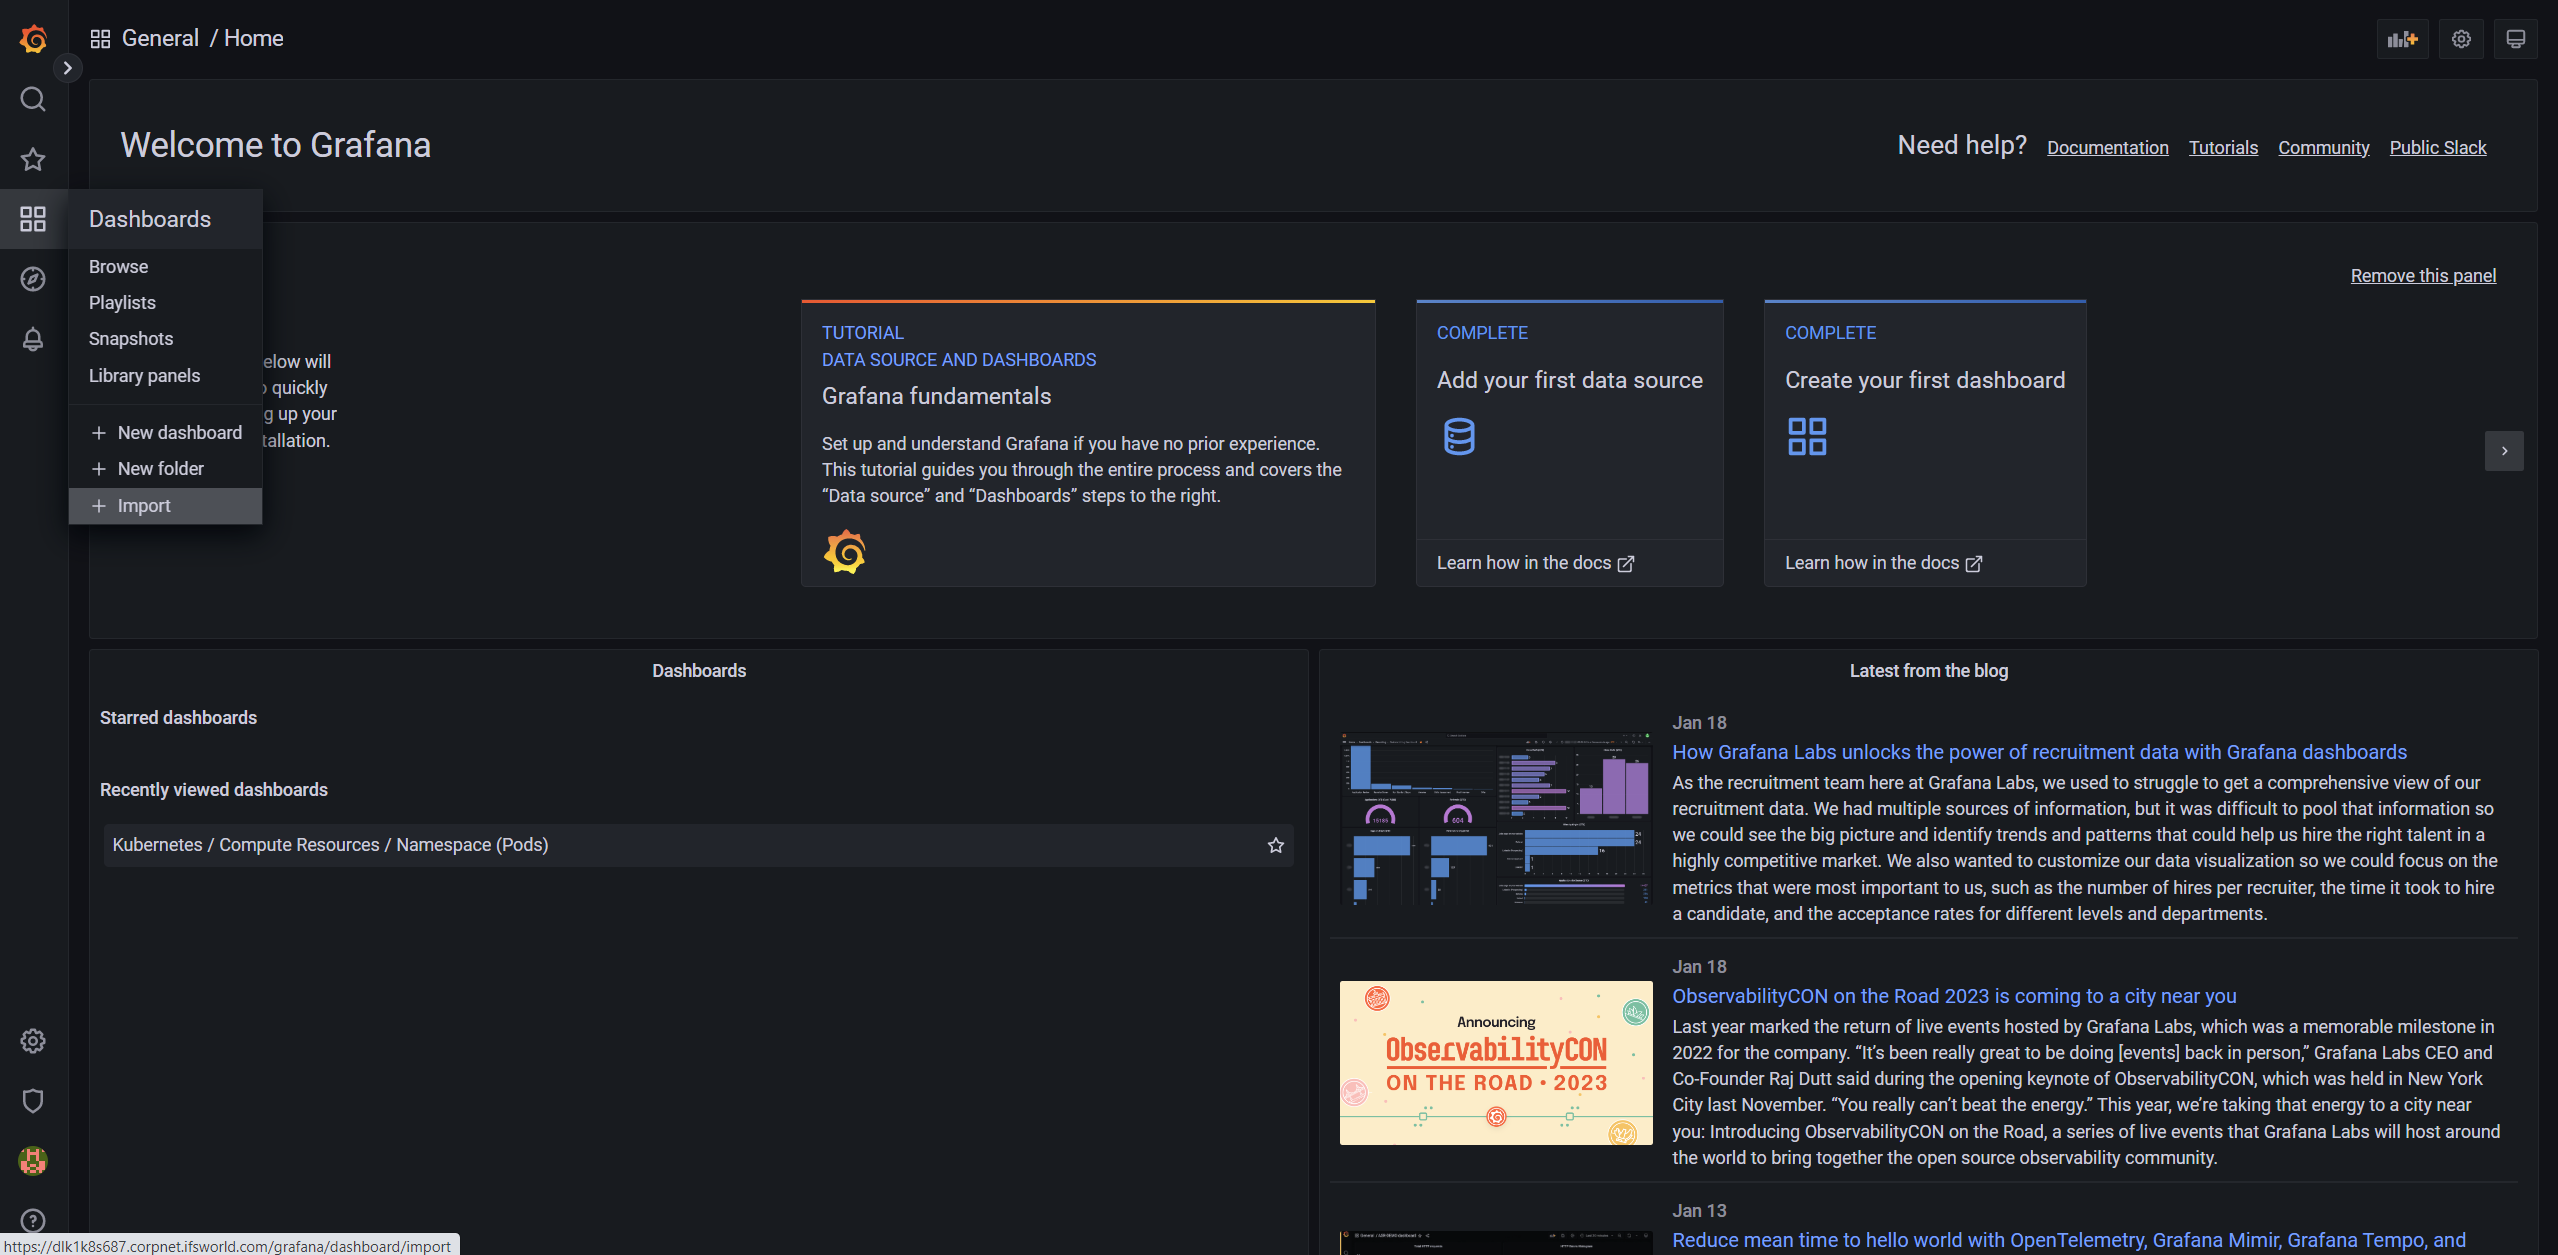
Importing Grafana Dashboards
-
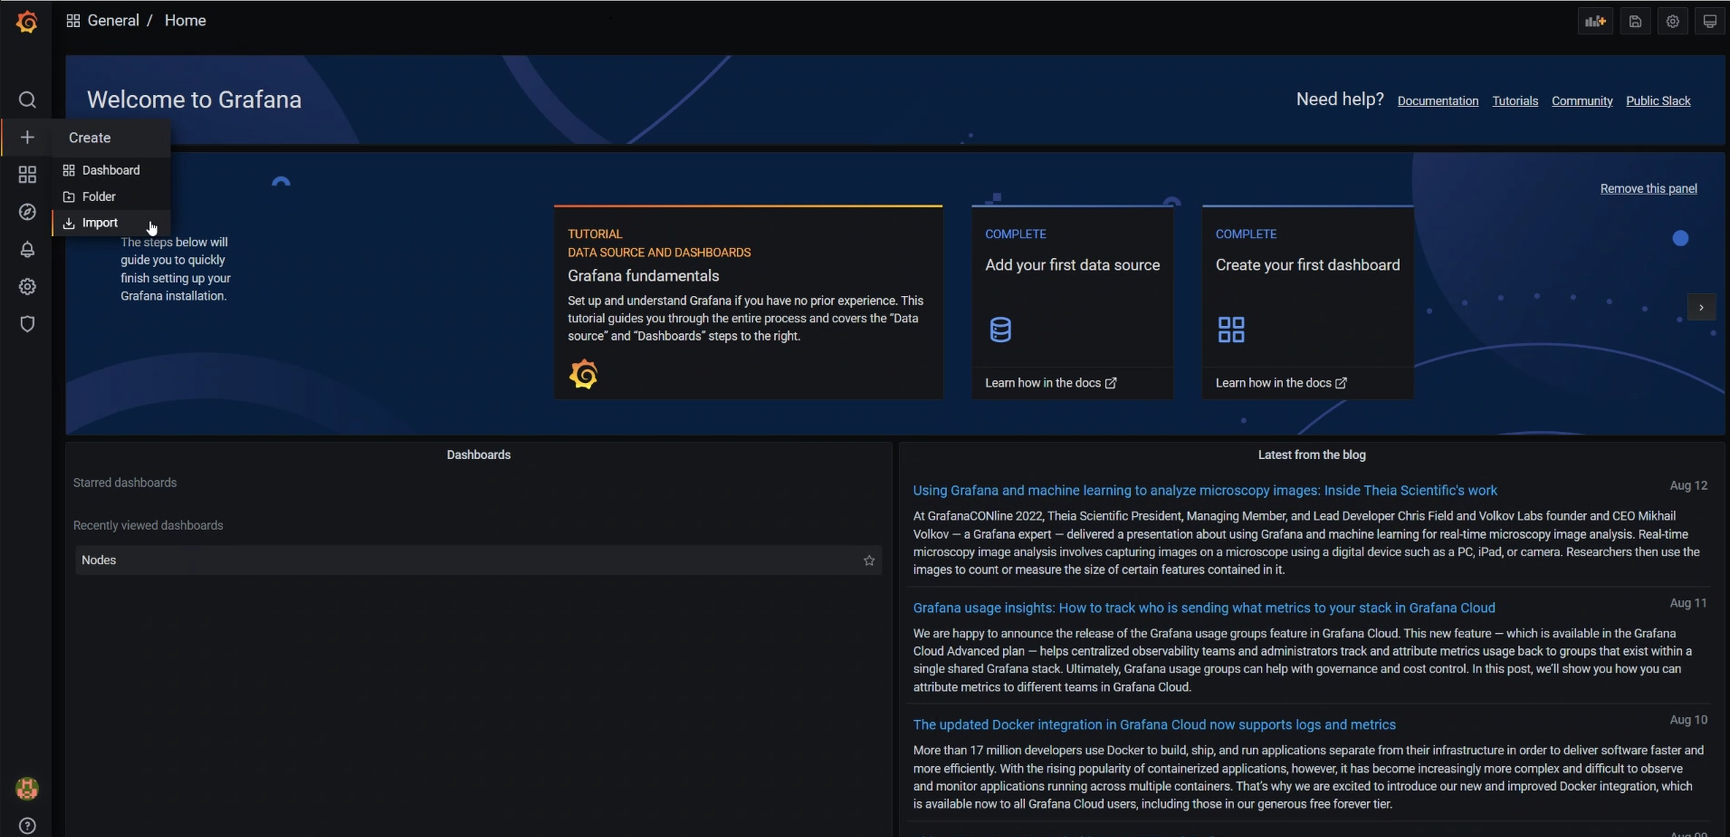
Navigate to the side menu by clicking the plus + icon and Select Import.
-
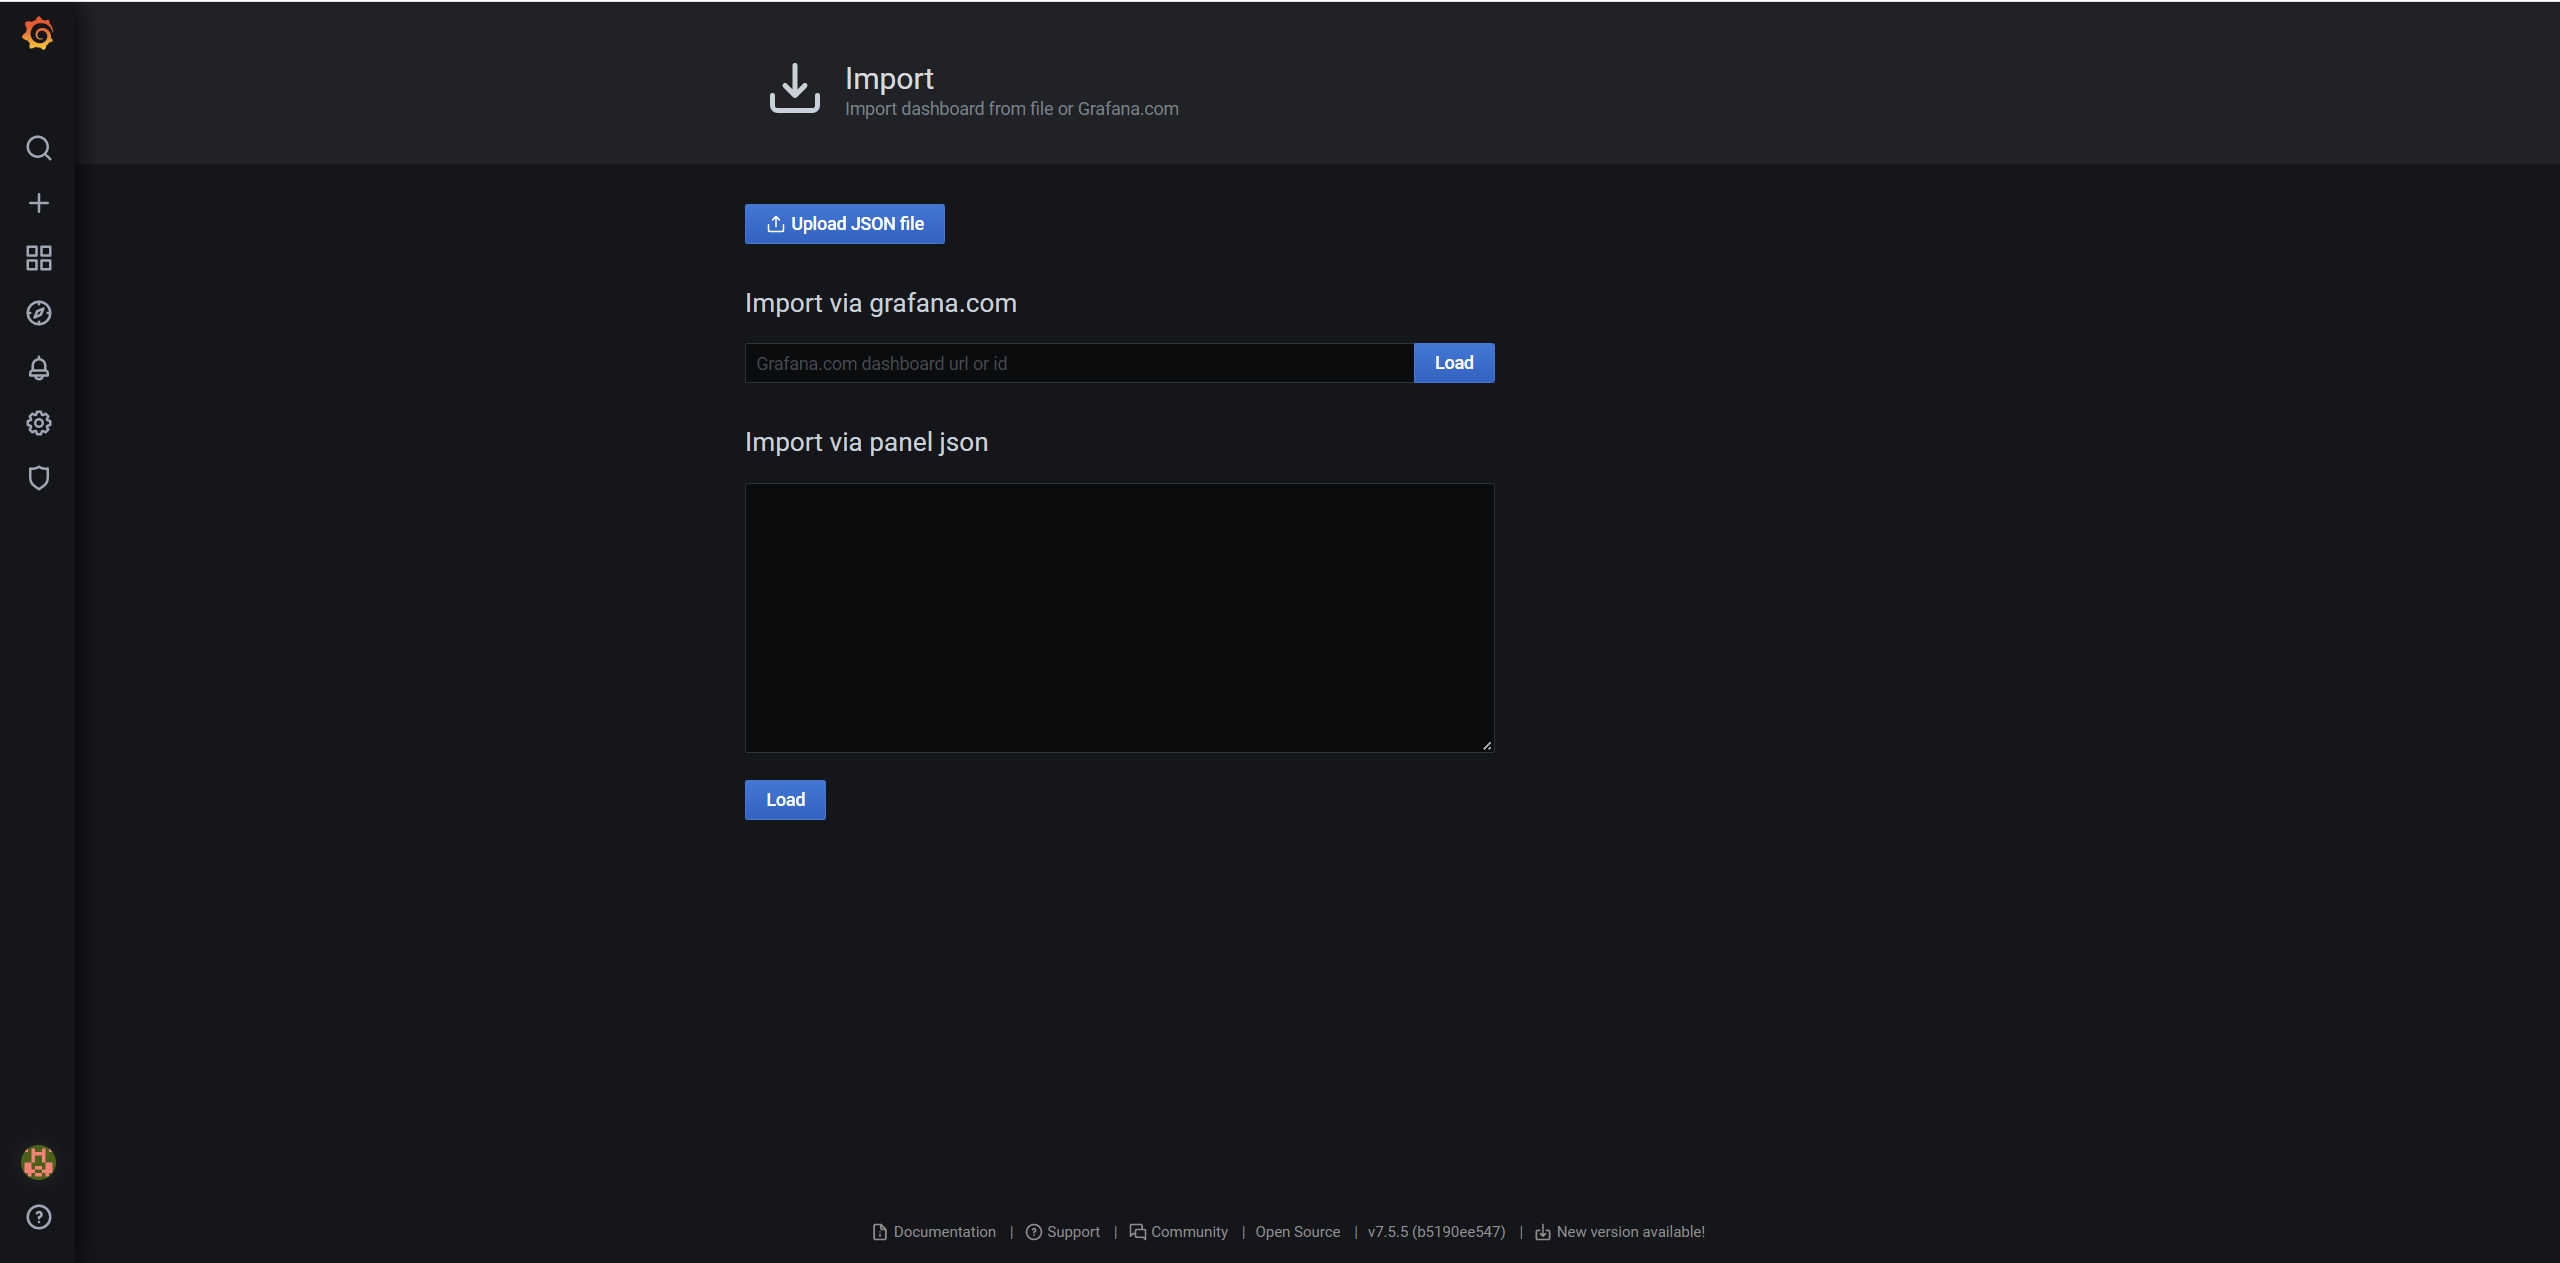
Import your JSON code or the JSON file of the relevant location.
-
Navigate to the manage section to view the imported dashboard.

-
View the imported dashboard here.
Grafana from 22R2 SU7 onward
Accessing Grafana Dashboards
1. Browse the Grafana Dashboard of IFS Remote Solution. [Log in to Grafana]
- e.g. Browse to https://Linuxhost/grafana
2. Authentication
-
Enter the username and password to log in to dashboards.
-
Extract the username and password from the IFS-Remote Monitoring file location in your windows machine: ifsroot > config > secrets > grafana_creds file
-
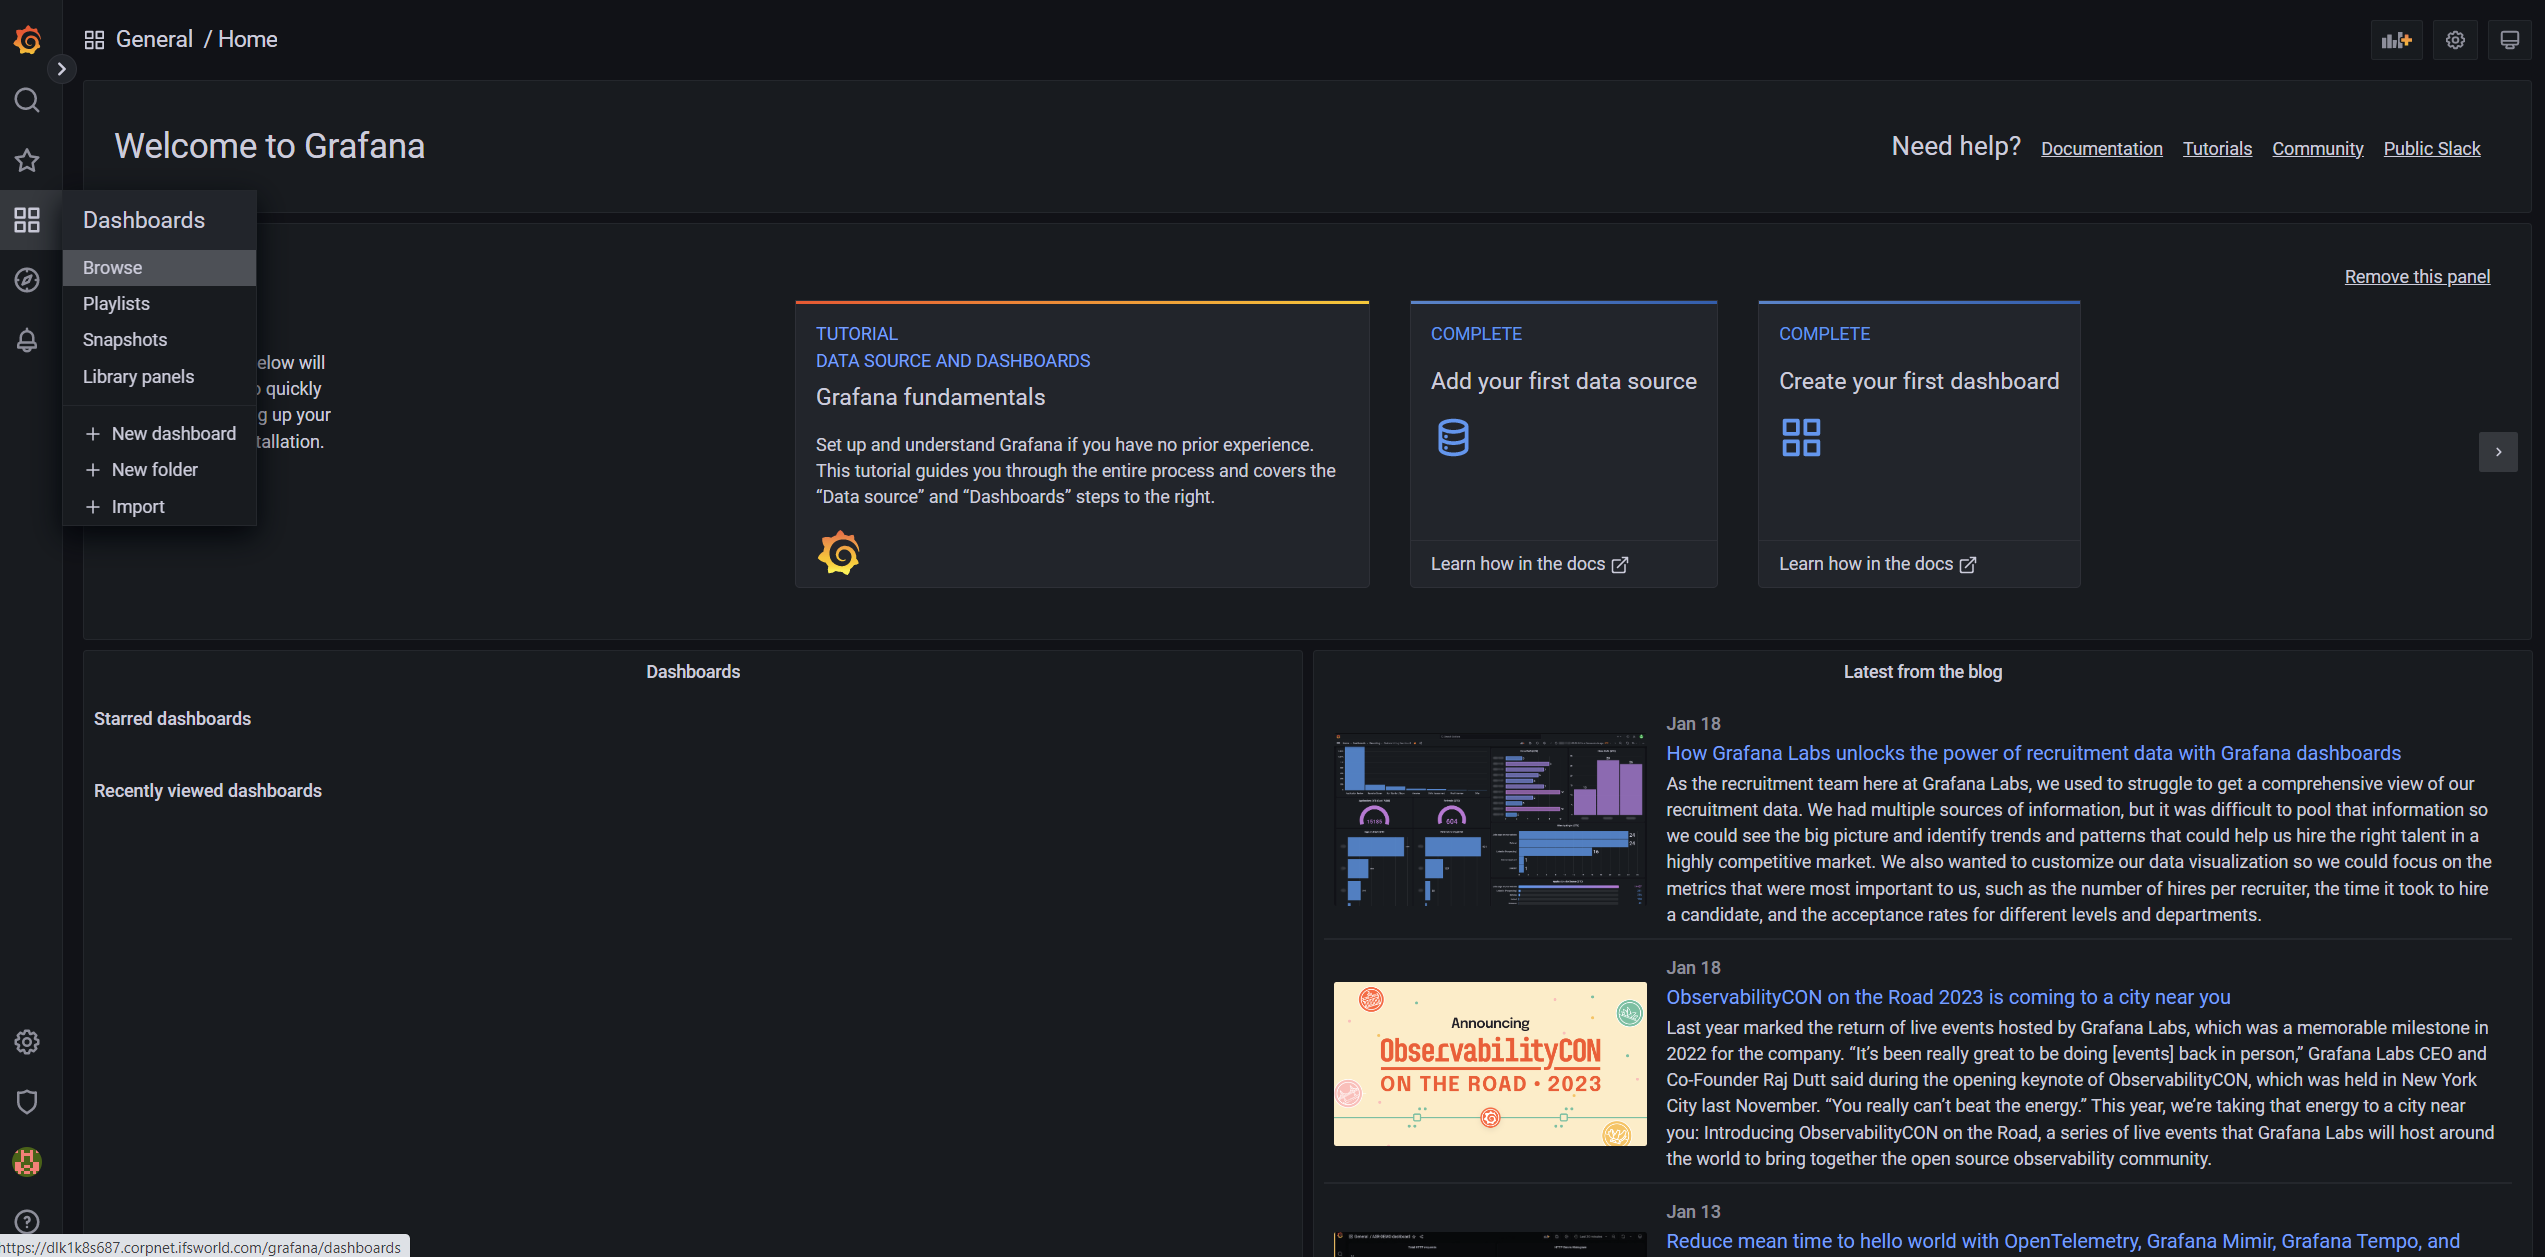
Grafana Home Page.
Viewing Grafana default Dashboards
-
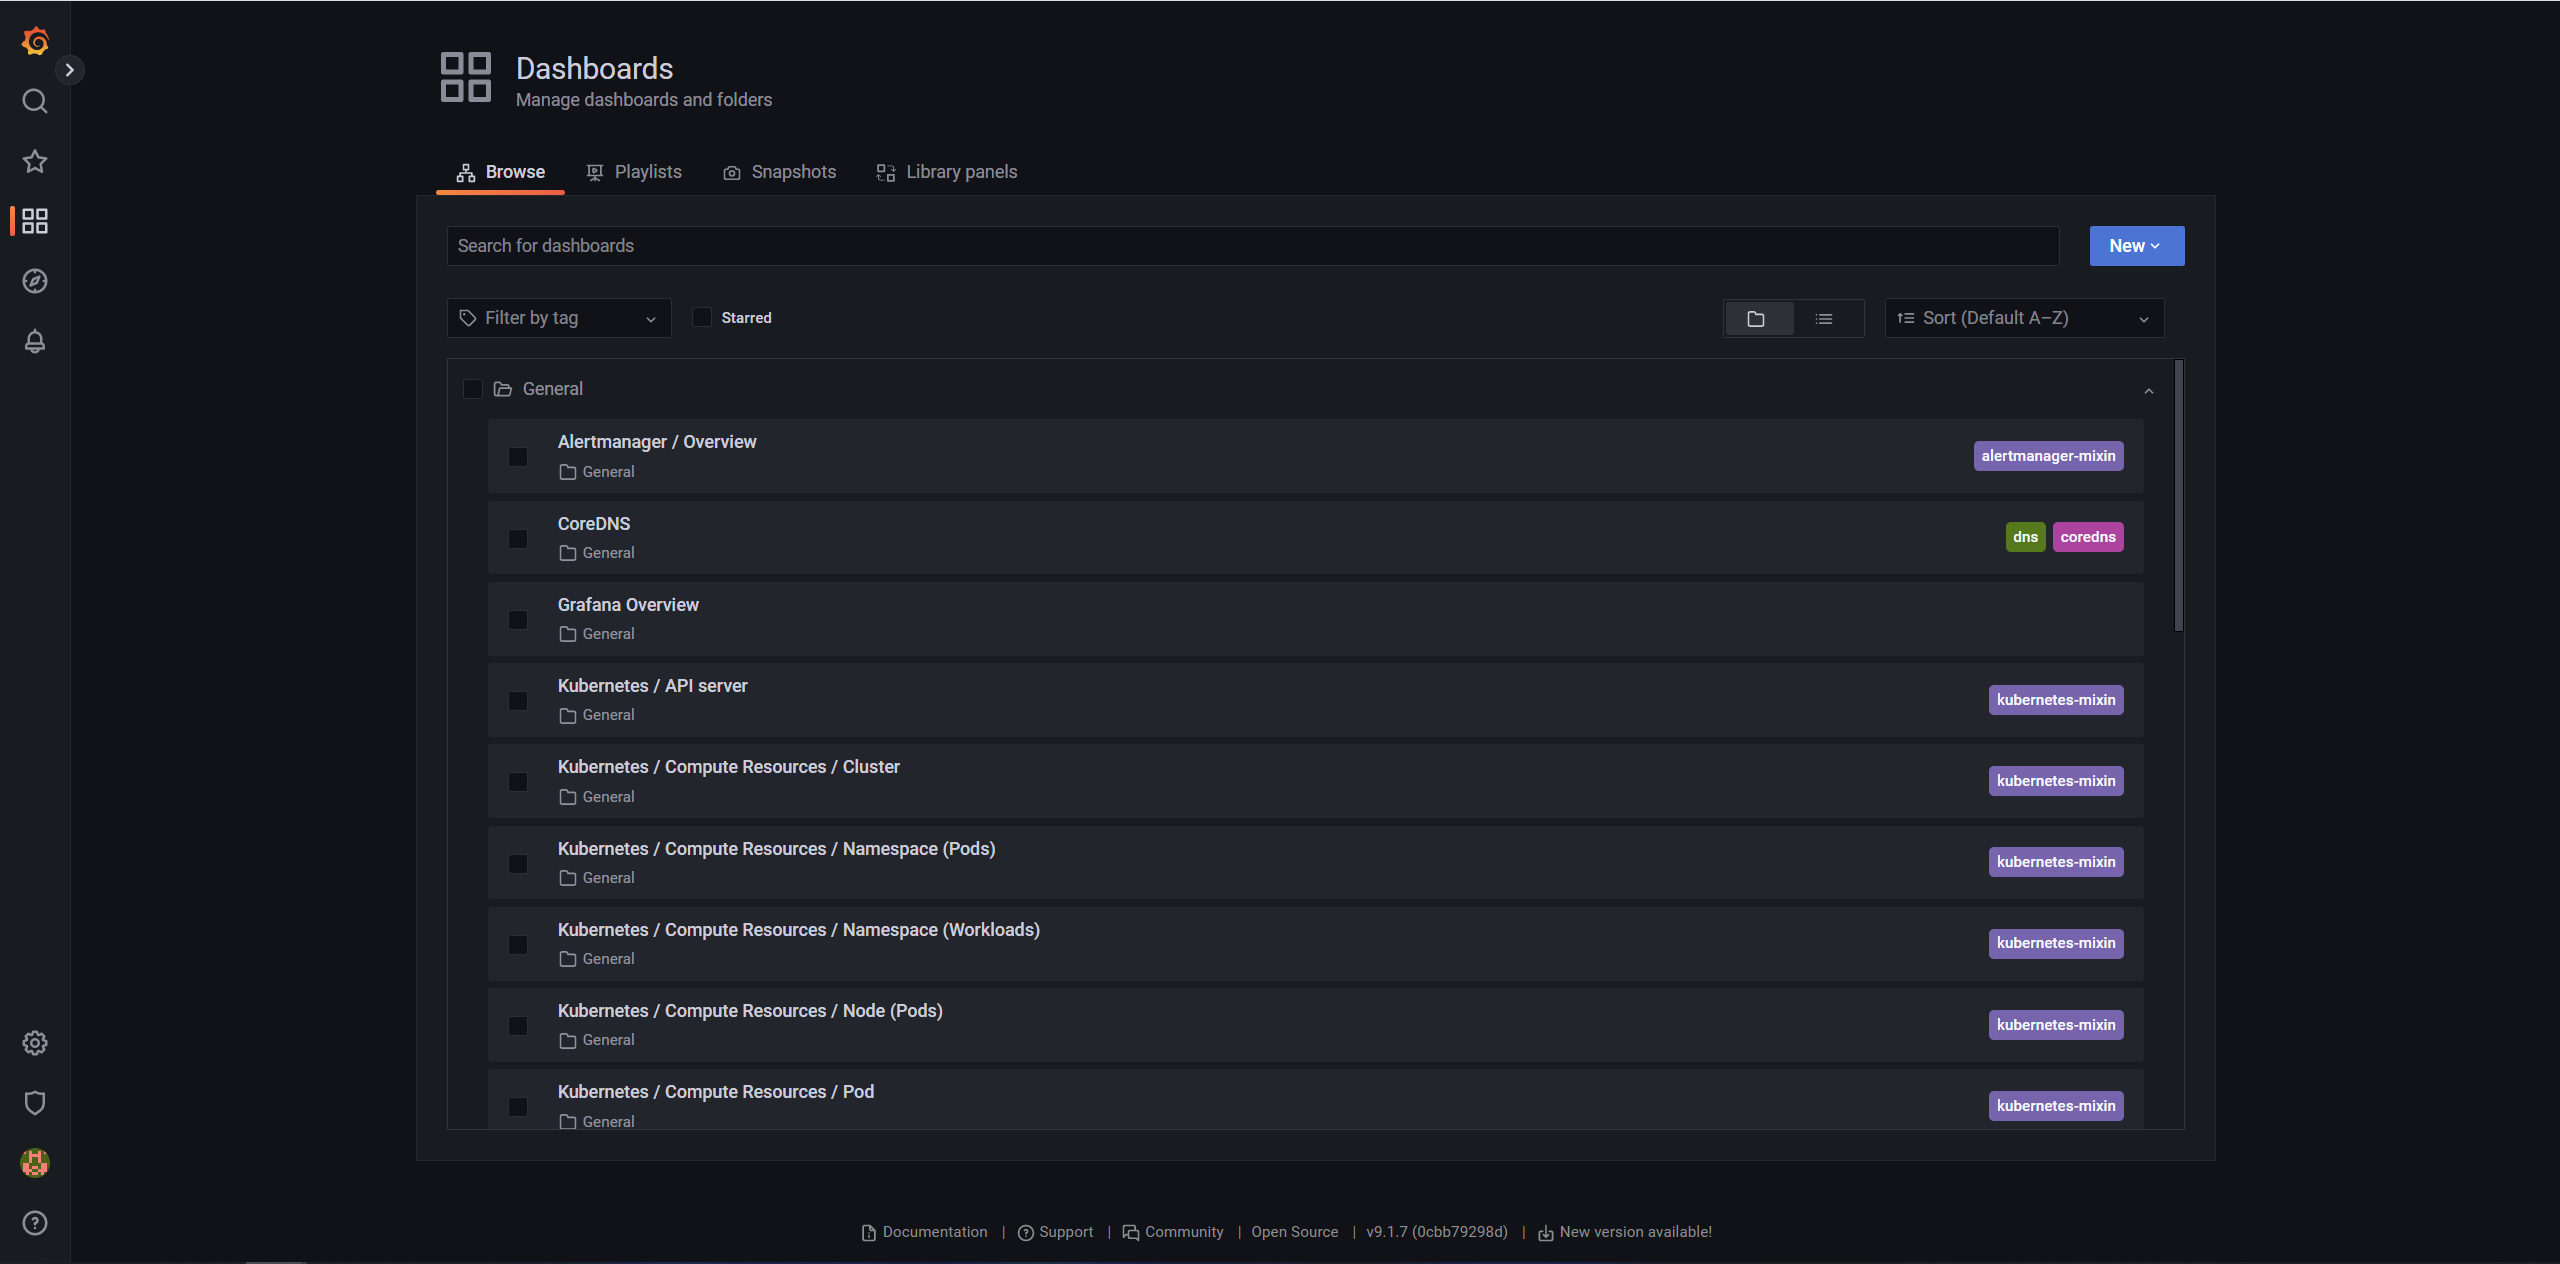
Navigate to Browse from the menu.

-
View the Current Dashboard List. (If the list does not appear, click to open the general folder)
 Use the below dashboards to monitor metrics:
- Kubernetes / Compute Resources / Cluster
- Kubernetes / Compute Resources / Namespace (Pods)
- Kubernetes / Compute Resources / Namespace (Workloads)
- Kubernetes / Compute Resources / Node (Pods)
- Kubernetes / Compute Resources / Pod
- Kubernetes / Compute Resources / Workload
-
The following is the Grafana Dashboard view.
Downloading IFS Grafana Dashboards
- Navigate to infrastructure/grafana-dashboard folder from the root folder location of windows management server.
- Find more information on basic Grafana dashboards here: Metrics Monitoring Dashboards
Importing Grafana Dashboards
-
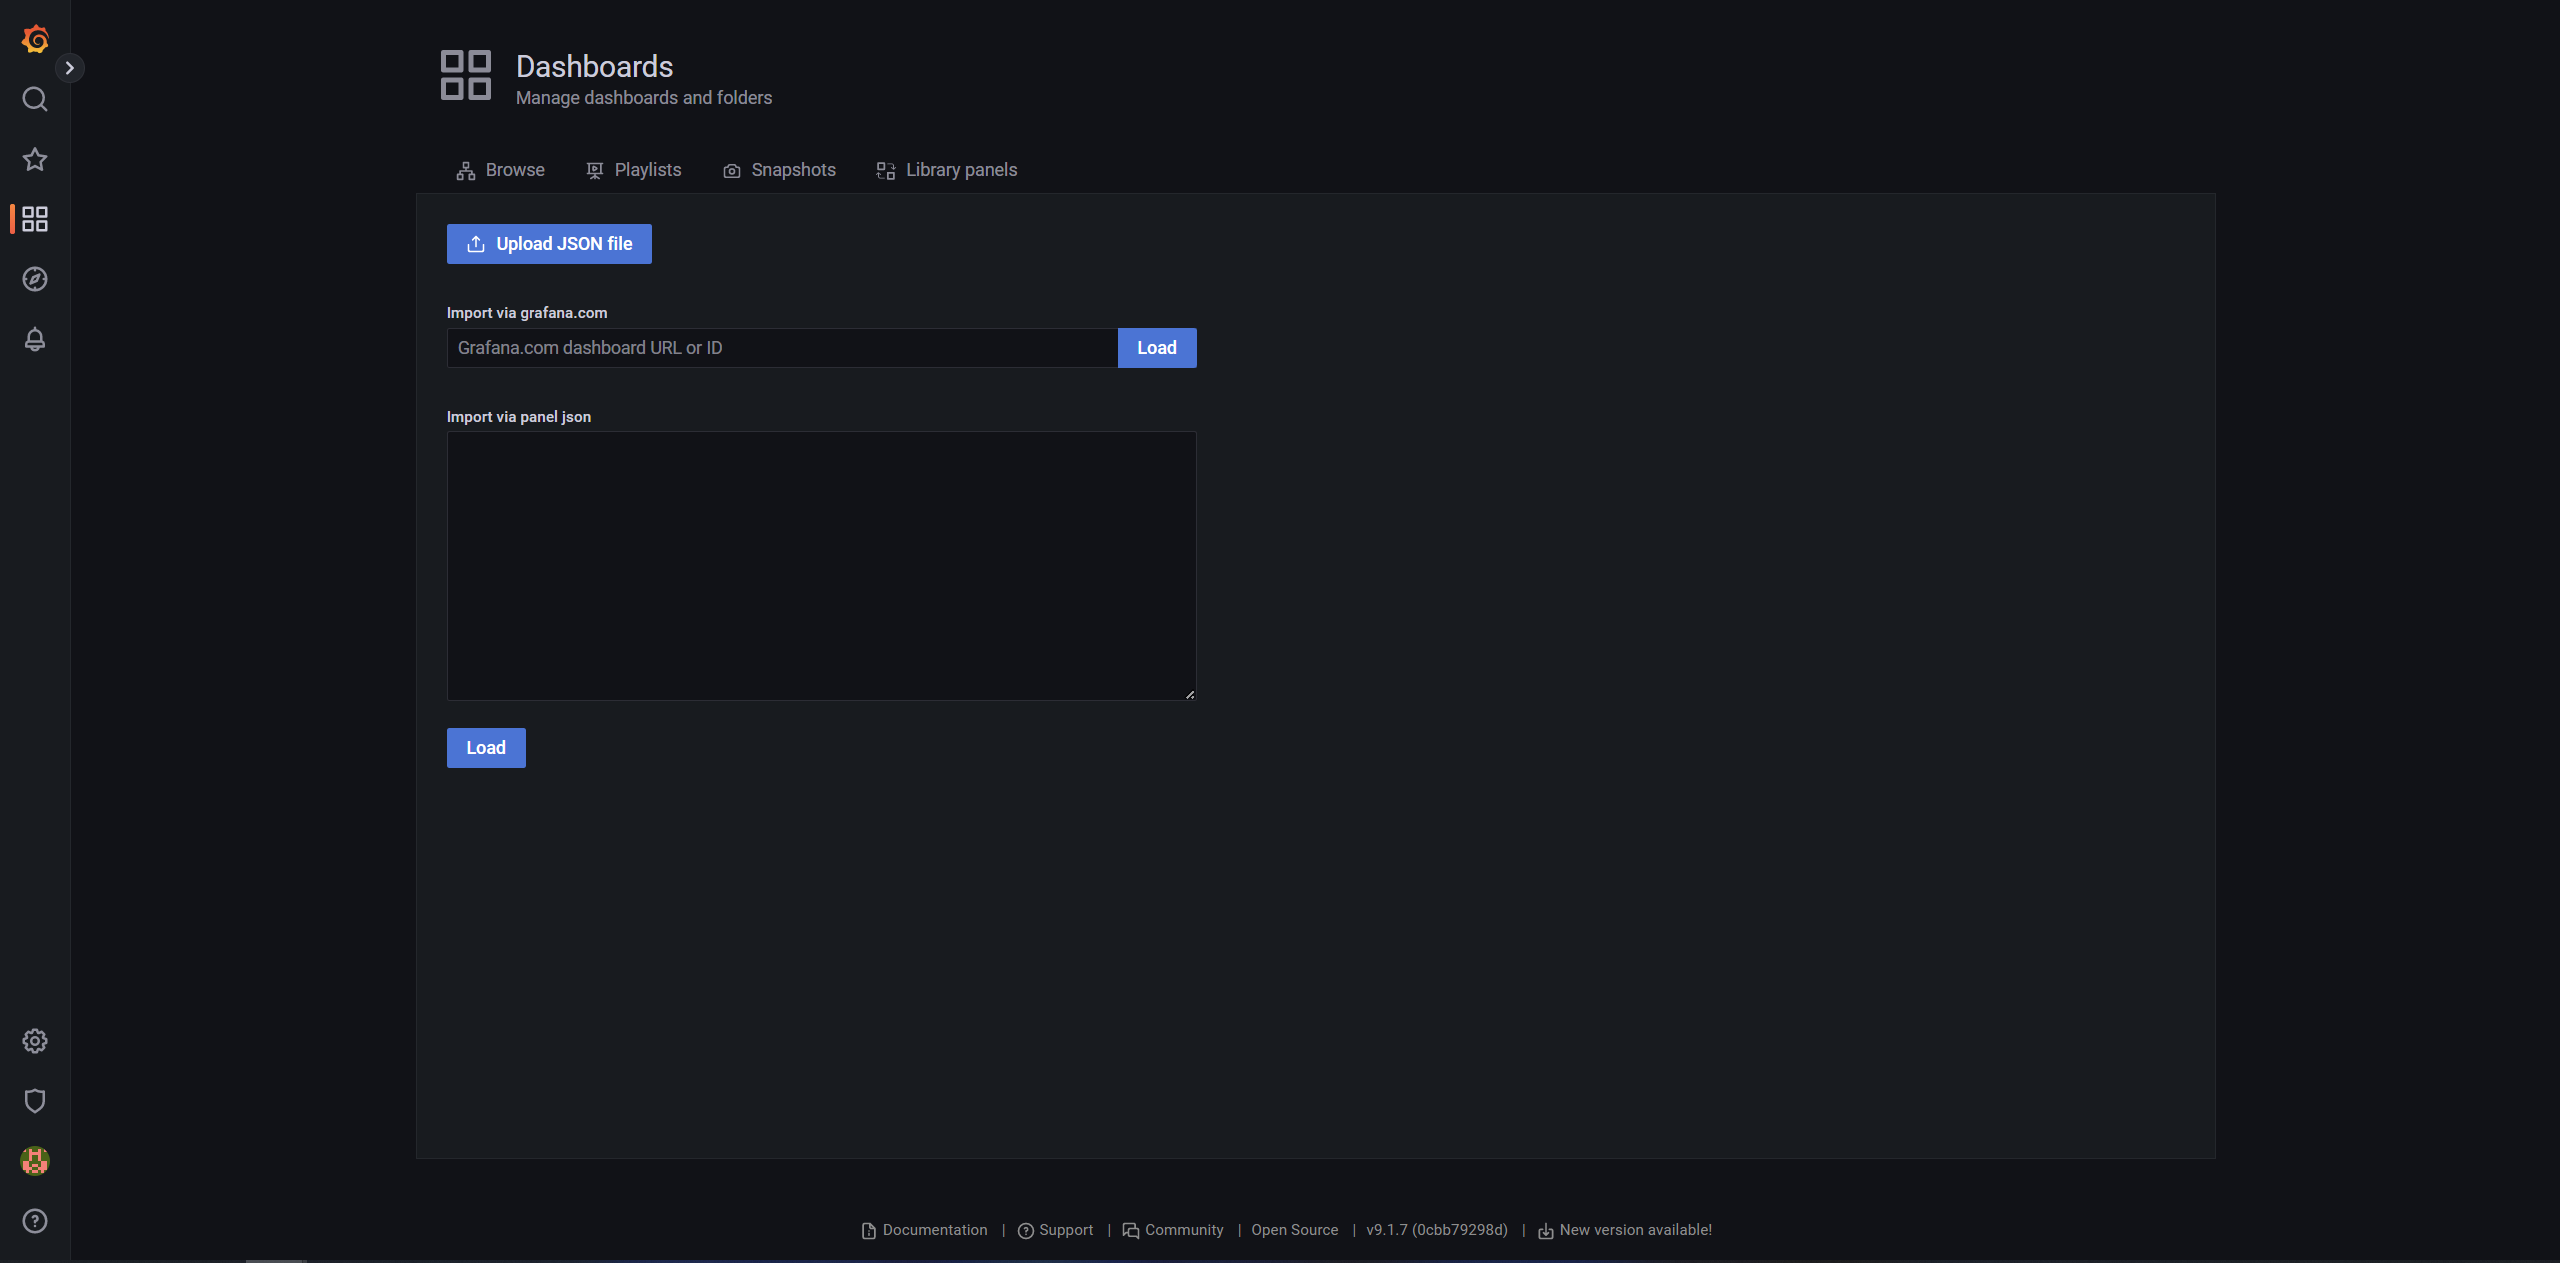
Navigate to + Import from the main menu.
-
Import your JSON code or the JSON file of the relevant location.
-
Navigate to the browse section to view the imported dashboard.
-
View the imported dashboard here.