Power BI Elements
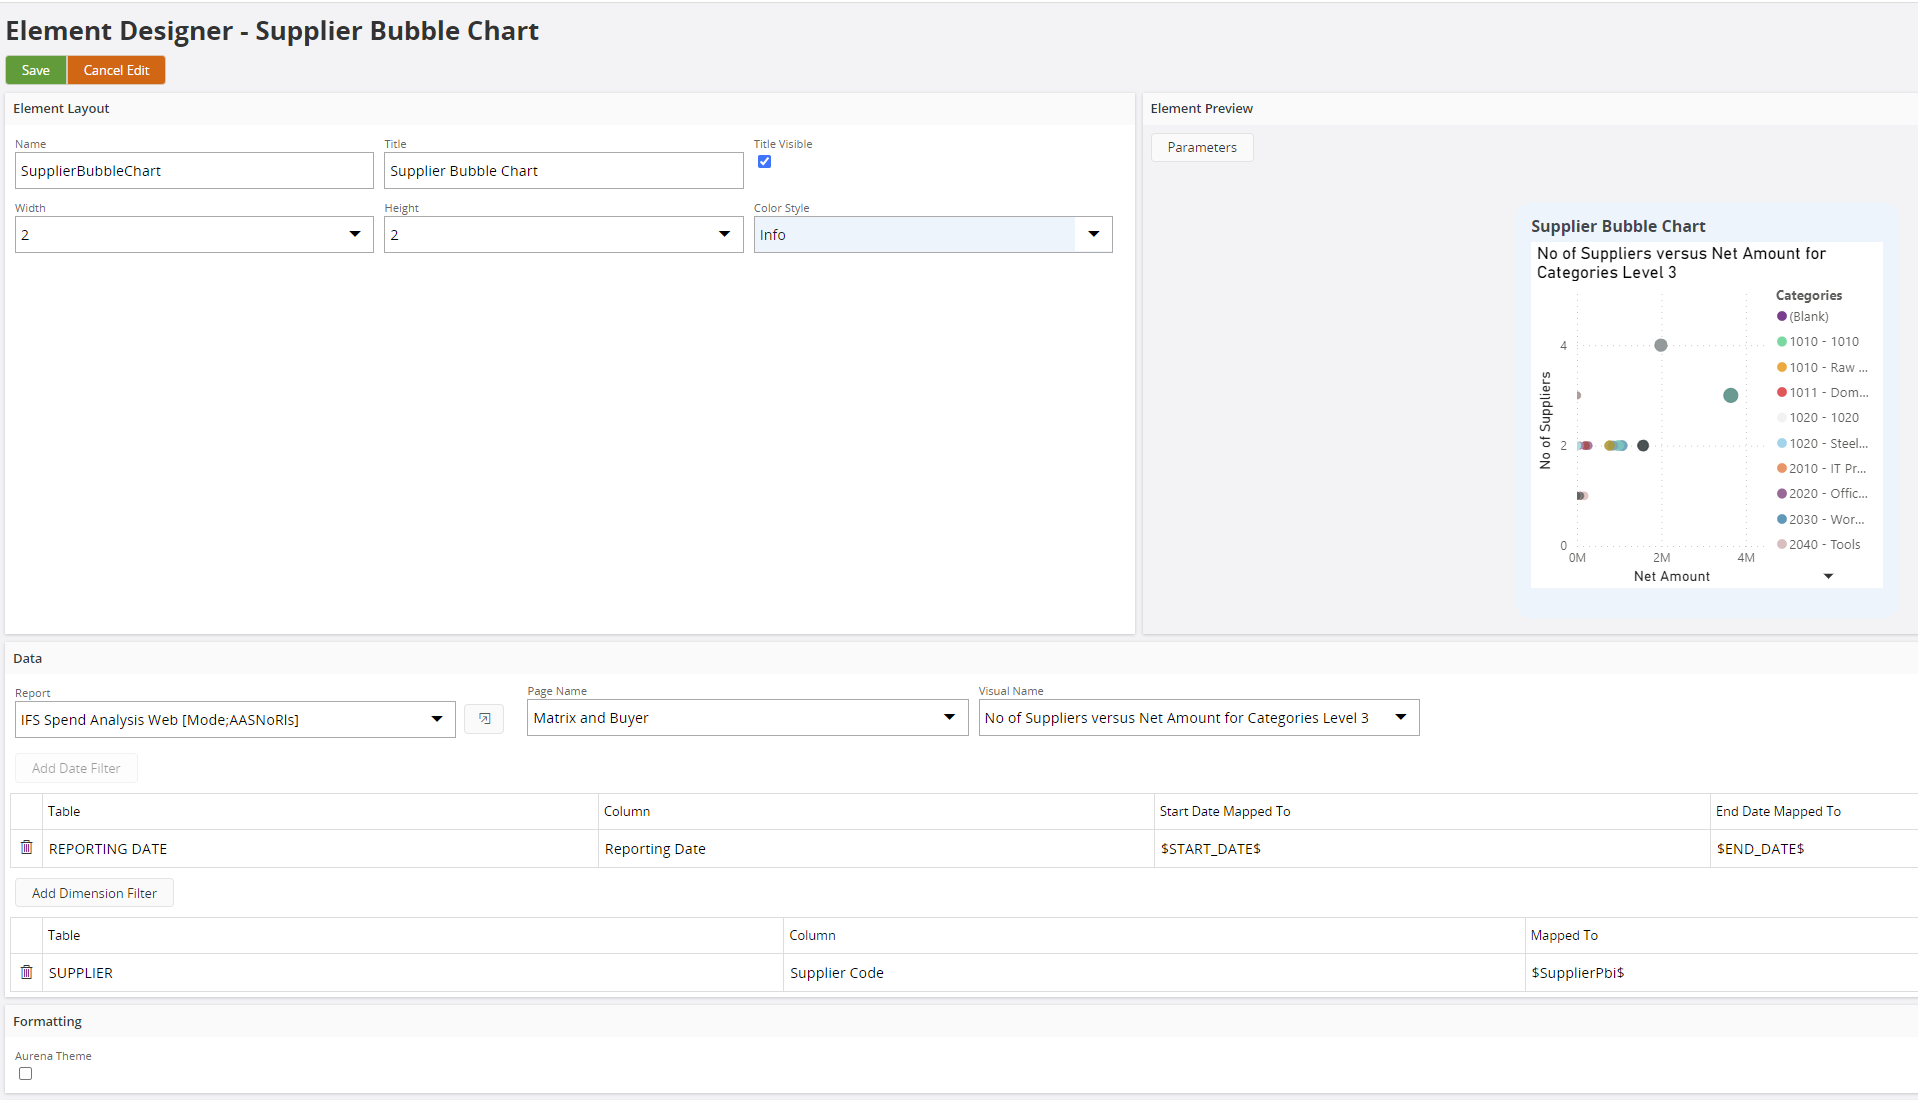
With the Power BI Element a Power BI report, dashboard tile or visual can be embedded into the lobby. This feature can be turned off using the system parameter "Comma separated list of disabled features".
Power BI Properties

Data Properties
| Property | Description |
|---|---|
| Report | The name of the report or dashboard to embed. The dropdown shows all the available reports and dashboards the environment has access to. The reports are requested from the Power BI Service which is reading the reports and dashboards from the Power BI workspace(s) the service principal has access to, normally that would be 1 workspace for a customer. With the edit button (shown behind the Report drop down) you can jump to a page where you can edit the report, for more information see: Power Bi Report Overview. |
| Page Name (r) | [Optional] Shows all the available pages of the selected Report, when selected the report is opened on this page and the Power BI page tabs will not be shown. |
| Visual Name (r) | [Optional] Shows the available visuals for the selected page, when selected this visual is shown instead of the page. |
| Tile (d) | The tile of the dashboard to show. |
| Date filter (r) | With the date filter the reports date dimension can be linked to page parameters. In the Table and Column columns the table and column of the Power BI Report needs to be specified that contain the date data. The Start Date Mapped To and End Date Mapped To column should contain the value or the page parameter to use for the filter. If a page parameter is used the parameter name should be specified within $ signs, a fixed value should be specified without $ signs. |
| Dimension filters (r) | Dimension filters can be used to add a fixed or dynamic filter to the report. For dynamic filters the filter should be placed within $, this will create a page parameter for the filter. Fixed filters should be written without $'s. |
(r) = report only, (d) = dashboard only The date filter and dimension filters can be tested in the Element Preview section using the parameters button.
Formatting properties (report only)
| Property | Description |
|---|---|
| Aurena Theme | When this toggle is enabled the styling of the report will be changed in line with the selected Aurena theme. If the toggle is disabled then the report will render exactly the same as it is designed in Power BI. |
Report data mode (report only)
At the moment there is no way to determine if a report is bound to Azure Analysis Service (AAS), SQL Server Analysis Services (SSAS) or is running in import mode and if it is using Row Level Security (RLS) or not. To be able to render the report correctly this information is needed. To be able to provide the information that is needed a report designer can use tags in the name of the dataset of the report that indicate the mode of the report in the form of [Mode;{x}] where x should be the number or the code of the table below.
| Mode | Description |
|---|---|
| (1) SsasWithRls | Report is connected to a SSAS model that is using RLS. |
| (2) SsasNoRls | Report is connected to a SSAS model without RLS. |
| (3) AasWithRls | Report is connected to a AAS model that is using RLS (default). |
| (4) AasNoRls | Report is connected to a AAS model without RLS. |
| (5) ImportWithRls | Report is running in import mode with RLS enabled. |
| (6) ImportNoRls | Report is running in import mode without RLS. |
Role to use (report only)
By default the role "EmbedUser" is used, this means that this role needs to be available. If the report is not using this role but another role the role can be specified by using a name tag in the form of [Role;{x}] where {x} needs to be replaced with the role to use.
Uploading and editing reports and dashboards
Uploading new reports and dashboards or editing existing reports or dashboards can be done through Microsoft Power BI, for more information see: https://docs.microsoft.com/en-gb/power-bi/
Editing reports can also be done from within IFS Cloud, see: Power Bi Report Overview.