Server Trace
Server tracing is done by using the system service Log_SYS. You can add your own traces wherever you find it suitable. Log level and Log label are more or less the same thing; label is a textual representation while level has a numeric representation. Server trace is mostly used to find problems in the server code.
Log Labels
Textual representation of different log levels.
not_set_txt_ CONSTANT VARCHAR2(12) := '';
undefined_txt_ CONSTANT VARCHAR2(12) := 'UNDEFINED';
error_txt_ CONSTANT VARCHAR2(12) := 'ERROR';
warning_txt_ CONSTANT VARCHAR2(12) := 'WARNING';
info_txt_ CONSTANT VARCHAR2(12) := 'INFORMATION';
trace_txt_ CONSTANT VARCHAR2(12) := 'TRACE';
debug_txt_ CONSTANT VARCHAR2(12) := 'DEBUG';
Log Levels
Numerical representation of different log levels.
not_set_ CONSTANT NUMBER := -1;
undefined_ CONSTANT NUMBER := 0;
error_ CONSTANT NUMBER := 1;
warning_ CONSTANT NUMBER := 2;
info_       CONSTANT NUMBER := 3;
trace_      CONSTANT NUMBER := 4;
debug_      CONSTANT NUMBER := 5;
Log Categories
Log_SYS has some built in Log categories, that are used to categorize the different traces.
Framework trace
Framework traces are reserved for tracing within the framework. All such traces are marked with category Framework. The method Fnd_Trace_ should be used to trace within the framework.
Bootstrap trace
Bootstrap traces are reserved for tracing methods that are used before the framework has started. This category is mostly invisible, since it generates a lot of trace and is only of interest to framework developers. The method Init_Trace_ should be used to trace bootstrap methods.
Stack Trace
This category is reserved for following the call stack. The Stack_Trace_ method is generated into every method through a call to the method Log_SYS.Init_Method, this makes it possible to trace the full call stack.
Installation trace
This category is reserved for tracing during installation. The method Installation_Trace_ should be used to trace methods during installation.
Application trace
Application trace is the trace you should use if your code belongs to the Application outside of the framework. The method to be used is called App_Trace.
It is possible to add custom categories as well. See procedure Own_Category in the Code Examples.
Log Type
Log Type is a trace marker that you can set yourself. You should use the Log type trace only if you want to filter on traces that are marked with the same Log type trace. This filtering is best used from the PL/SQL Trace tab in the debug console.
Start Tracing
In order to start tracing and seeing your traces you must set the log level that you would like to trace on. The higher the number (see the log levels below), the more output you will get. You should always use the method Set_Log_Level_ in order to start a tracing. The format parameter should be set to FALSE (default value) when tracing is done from the client and set to TRUE when tracing from any other tool. When the format is set to TRUE this means that the output is formatted to make it more readable. When set to FALSE formatting must be done by the client which uses it. (e.g. the debug console).
Log levels
| Name | Level |
|---|---|
| not_set_ | -1 |
| undefined_ | 0 |
| error_ | 1 |
| warning_ | 2 |
| info_ | 3 |
| trace_ | 4 |
| debug_ | 5 |
All categories
You can trace all categories by entering.
Specific category
You can also trace a specific category only. In the example below you will only get traces from Application (i.e. DB_APPLICATION) category.
The different categories are All, Bootstrap, Application, Framework, Installation and Callstack.
Trace Output
Client trace
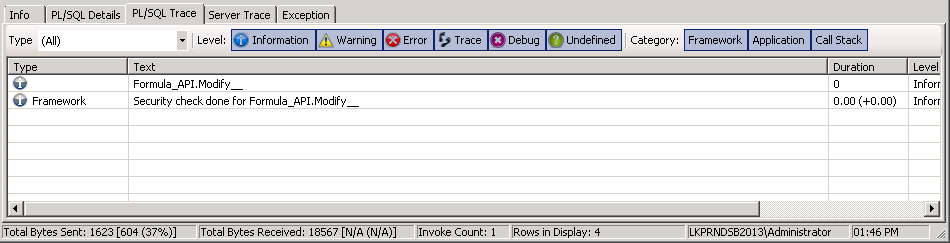
The server trace can be watched in the PL/SQL trace tab that is shown in the Debug Console in the client.
Server trace
Any SQL tool that can run PL/SQL can display the traces. In order to see anything you need to start tracing.
Code Examples
Below you can see some code examples which tries to explain how the server trace works.
First we have some example methods in a package called Server_Trace_API.
Example
Difference between formatted and not formatted server trace
Formatted
Formatted trace is intended for SQL*Plus and similar tools, and supposed to be formatted to allow developers to read the code used.
Output:
Application: This is an application trace text.
               Framework: This is an framework trace text.
Unformatted trace
Unformatted trace is intended for clients only. Clients are intended to format this output.
Output:
5^12699411^APPLICATION^DEBUG^Application^This is an application trace text.
5^12699411^FRAMEWORK^DEBUG^Framework^This is an framework trace text.
Use of categories
All categories
Output:
Application: This is an application trace text.
               Framework: This is an framework trace text.
One category
Output:
Application: This is an application trace text.
Own category
Output:
MyOwnCategory: This is a debug level application trace text.
               Application: This is a info level application trace text.
               MyOwnCategory: This is a error level application trace text.
Use of levels
Use Error level
Output:
Application: This is a error level application trace text.
               Framework: This is an error level framework trace text.
Use Debug level
Output:
               Application: This is a debug level application trace text.
               Framework: This is a debug level framework trace text.
               Application: This is a info level application trace text.
               Framework: This is a info level framework trace text.
               Application: This is a error level application trace text.
               Framework: This is an error level framework trace text.