Profiling
Profiling is a tool that can be used to see where the code has consumed most time and have many times it has been executed. This could be very useful information when looking to identify performance related problems. When using IFS Cloud clients can make several sever calls for one business process, also there can be more than one profiling session per business process.
Setup profiling
To allow profiling to work, then the profiling tables must be created in the SYS user schema. This is done by executing the script ORACLE_HOME/RDBMS/ADMIN/proftab.sql. Further configurations need to be done, see setup here.
In order to allow profiling in each environment the profiling system parameter must be set to ON. The system parameter is in category System Settings.
Enable profiling
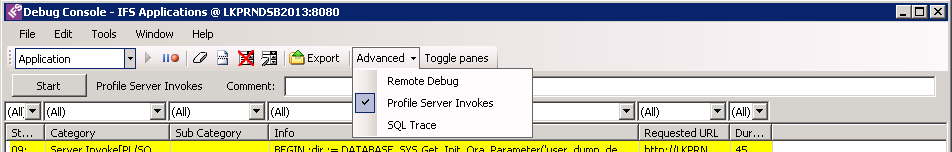
In IFS IEE client profiling can be started in the Debug console by selecting Advanced/Profile Server Invokes. This then allows developers to add a unique comment so that it is possible to find your profile run amongst others profile runs. Then press the Start button. All server calls will now be profiled until the stop button is pressed. It is important to understand that there might be several profiling runs per client call.
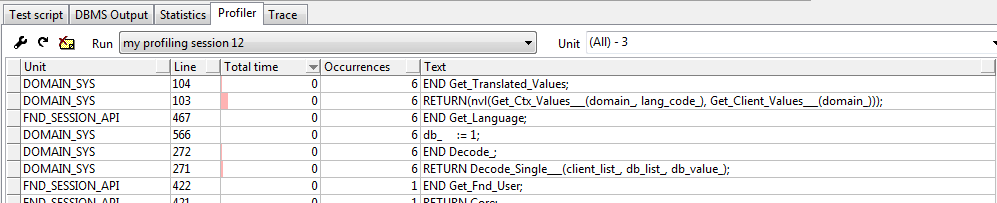
View profiling results
Profiling results can be viewed either by making queries against the profiler tables or by using a tool that displays the profiler result. One tool that displays the profiler results is PL/SQL Developer. To view profile results to bring up a test window and select the profiler tab. Find your profiler run in the Run combo box. If it is not there then try to do a refresh. It is also possible to remove profiling runs and change which fields you want to view in the form.