System Performance
Overview
This guide provides an overview of two critical performance monitoring screens in your Oracle database environment. These screens utilize the v$sql view to present real-time data about SQL statement performance. The primary purpose of these screens is to help you identify and address slow or resource-intensive queries quickly.
The v$sql view shows SQL statements that are currently in the shared pool. This means the data shown in this view is dynamic and influenced by the following factors:
- Database Activity: A high volume of queries can cause older SQL statements to be flushed from the cache more quickly, limiting the available data in the
v$sqlview. - Shared Pool Size: The larger the shared pool, the more SQL statements it can retain for a longer period of time.
It’s important to note that you will only see queries that are either active or have been executed very recently. If a query has aged out of the cache, it will not appear in these screens. For historical performance analysis, consider using tools like AWR (Automatic Workload Repository) or Statspack.
Custom Field Runtime Performance Overview
This screen is a focused version of the All SQL Overview, designed specifically to monitor SQL statements related to custom fields. It automatically filters for queries with an average elapsed time per execution greater than 2 seconds, helping you narrow down your focus to the most critical issues.
| SQL ID | A unique identifier for each SQL statement. |
| SQL Text | The beginning of the SQL statement text. |
| Executions | The number of times the SQL statement has been executed. |
| Elapsed Time / Exec (s) | The average elapsed time (in seconds) per execution of the SQL. |
| CPU Time / Exec (s) | The average CPU time (in seconds) per execution. |
| Module | The application module that executed the SQL statement. |
By default, the data on this screen is sorted in descending order based on Elapsed Time / Exec (s). This means the queries with the longest execution times are displayed at the top. The automatic filter, highlights queries where the average elapsed time per execution exceeds 2 seconds. This allows you to quickly identify and focus on critical performance issues related to custom fields.
All SQL Runtime Performance Overview
This screen provides a comprehensive view of SQL performance across your entire Oracle database. It’s an essential tool for identifying problematic queries and optimizing overall database performance.
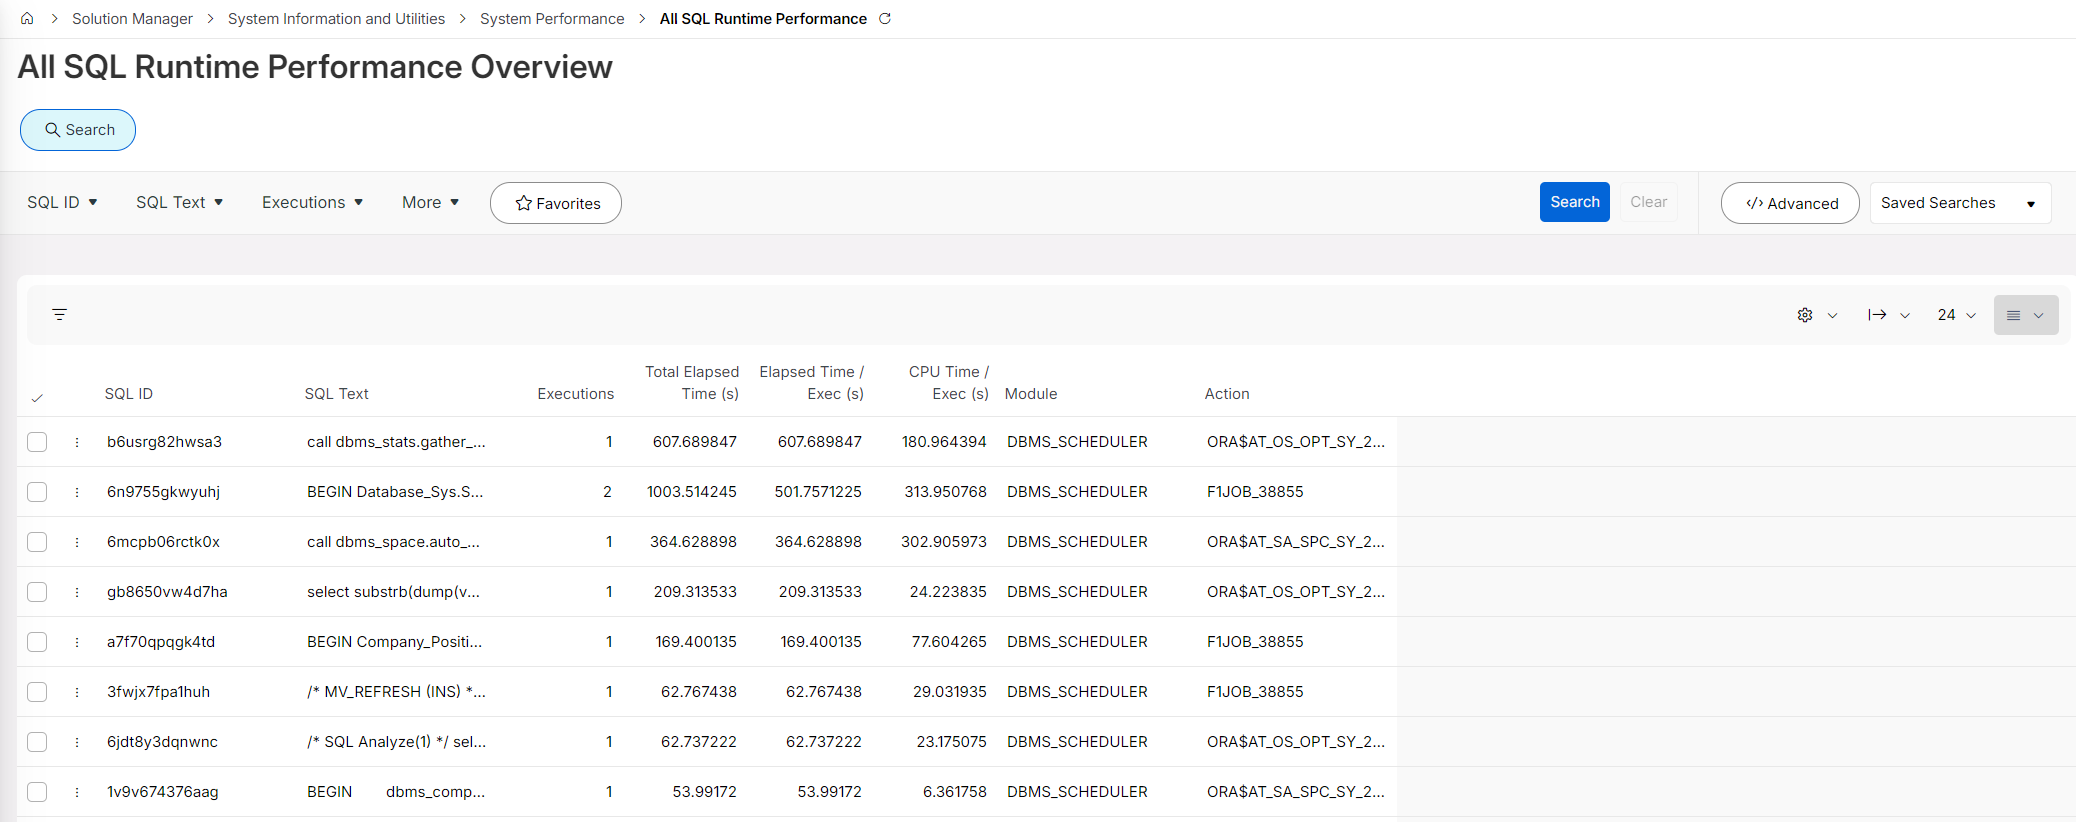
| SQL ID | A unique identifier for each SQL statement. |
| SQL Text | The beginning of the SQL statement text. |
| Executions | The number of times the SQL statement has been executed. |
| Total Elapsed Time (s) | The total time (in seconds) for all executions of the SQL statement. |
| Elapsed Time / Exec (s) | The average elapsed time (in seconds) per execution. |
| CPU Time / Exec (s) | The average CPU time (in seconds) per execution. |
| Module | The application module that executed the SQL statement |
| Action | The specific action within the module that executed the SQL. |
The data is sorted by default in descending order based on Elapsed Time / Exec (s). This allows you to immediately identify which queries are taking the longest to execute on average. The search bar at the top of the screen can be used to filter and locate specific queries quickly.
Note: Focus on queries showing high values in Elapsed Time / Exec (s) or CPU Time / Exec (s), as these are the primary indicators of potential performance bottlenecks.
Practical Tips and Best Practices
To maximize the utility of the above metrics, follow these practical tips:
1. Optimize Problematic Queries:
Continuously monitor the performance of SQL queries and optimize those that consistently exhibit high elapsed or CPU times. This can help reduce the strain on the database and improve user experience.
2. Monitor Regularly:
Regular monitoring is crucial to identify emerging performance trends or new issues before they impact users
3. Set Performance Thresholds:
Define thresholds for acceptable SQL performance. Use these thresholds to quickly identify queries that exceed your performance targets and require further investigation.
By utilizing these performance screens, you gain a powerful tool for real-time monitoring of SQL performance in your Oracle environment. Regular use of these screens can help you maintain optimal database performance and identify potential issues before they impact system efficiency.