Tree Diagram
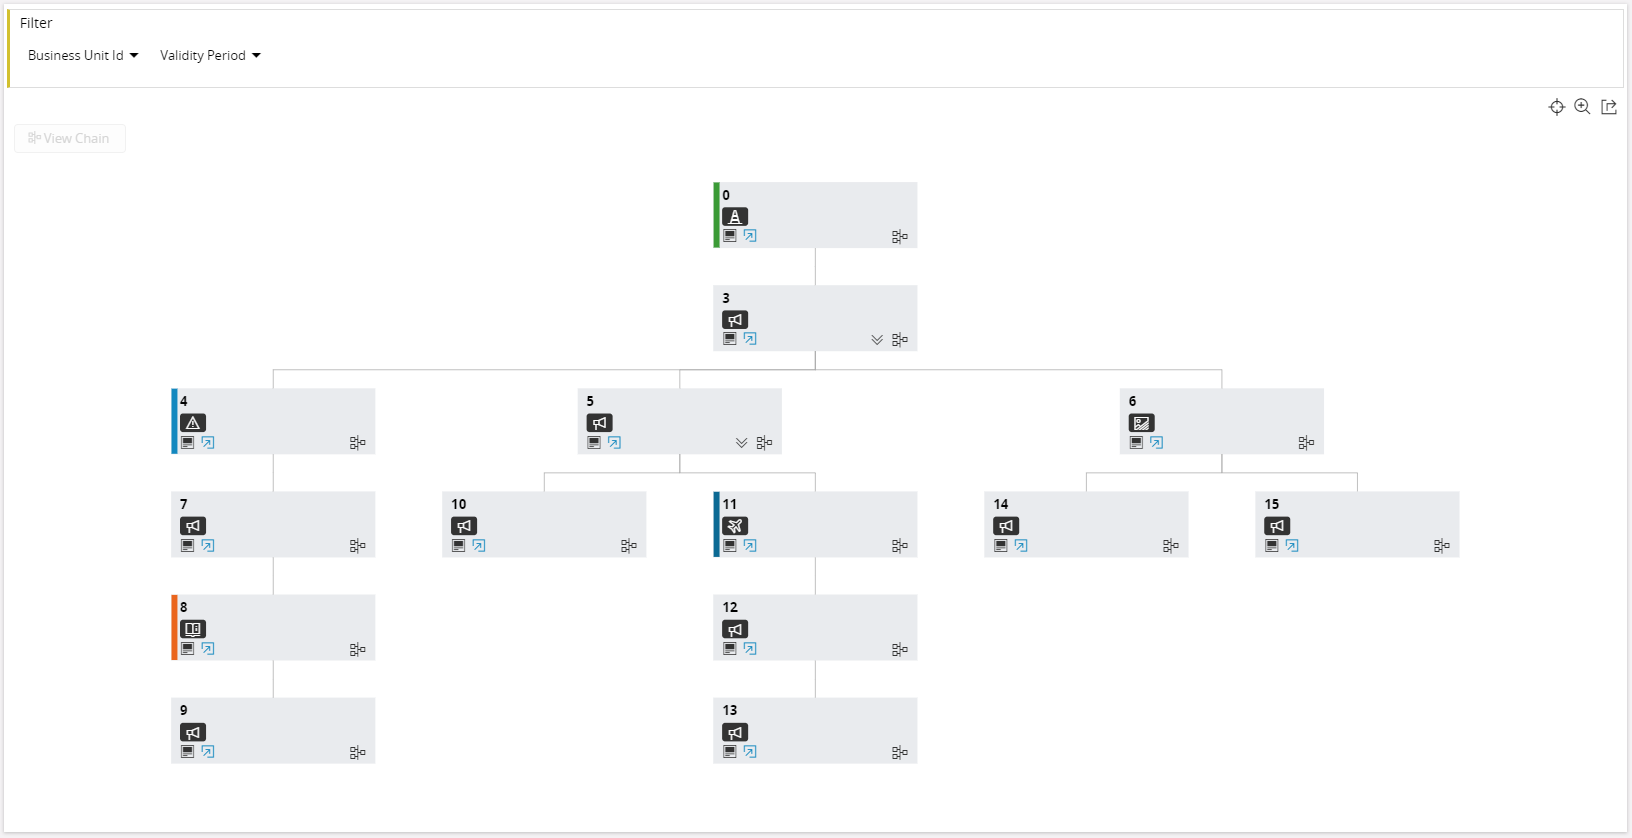
Tree Diagram is a control that can show a hierarchical relationship. It works as a read-only control.

Figure 1 - Tree Diagram Control
Variations
None
When to use
Use the Tree Diagram control to display an overview of records which have a hierarchical relationship with each other.
Limitations
- Cannot be used inside tabs and arrange blocks.
- Only supports data sources having parent-child relationship.
- A child data source needs to maintain the relationship between each record.
How to use
To use the Tree Diagram simply add a treediagram to the page and use the properties below to customize the control.
1. Define a tree diagram
Follow the examples given below.
In the client model file, inside the page block:
treediagram <tree_diagram_name> {
   ...
   }
Declarative syntax - Tree diagram
<tree_diagram_name> - Tree diagram identifier, use a meaningful name.
treediagram OrganizationTreeDiagram {
   ...
}
Example code - Tree diagram definition
2. Add the tree diagram to the page
page <page_name> using <page_entityset> {
   selector <selector_name>;
   treediagram <tree_diagram_name>;
}
Declarative syntax - Tree diagram on page
<page_entityset> - Serves as the data source to the page and to the selector.
selector - Contains the set of parent records for the tree diagram.
page OrgDiagram using Organizations {
   selector OrganizationSelector;
   treediagram OrganizationTreeDiagram;
   ...
}
Example code - Tree diagram on page
3. Adding a data source to tree diagram
Method 1
- Add an array to populate a tree diagram.
treediagram <tree_diagram_name> {
   ...
   node <node_name> for <entity> {
      connections {
         node <node_name>(<tree_diagram_array>) {
            connectedFrom = <column_name>;
            connectedTo = <column_name>;
         }
      }
      ...
   }
}
Declarative syntax - Data source added to a tree diagram
node - Each node represents a rectangle in the tree diagram, see Figure 1. Therefore, what goes into it and behavior of it needs to be defined inside the node block along with its entity (i.e. child array entity). Hence each rectangle represents a record.
<node_name> - The node identifier, use a meaningful name.
<entity> - The name of the entity which the tree_diagram_array is based on.
connections - The block where the data source for the respective node is defined (which populates the tree diagram). It needs to provide the same node_name created above, and pass the tree_diagram_array created in the projection.
<tree_diagram_array> - This is an array defined in the respective projection file. It is considered to be the child array for a respective parent record. The array refreshes when the parent record changes, which also refreshes the tree diagram.
connectedFrom - This defines the column name which maintains the node’s own key/id. (Column in child entity)
connectedTo - This defines the column name which maintains the node’s parent key/id. (Column in child entity)
treediagram OrganizationTreeDiagram {
   ...
   node BusinessUnit for TstBusinessUnit {
      connections {
         node BusinessUnit(BusinessUnitArray) {
            connectedFrom = BusinessUnitId;
            connectedTo = ParentBusinessUnitId;
         }
      }
      ...
   }
}
Example code - Data source added to a tree diagram (Method 1)
Method 2
- Add a function which returns an entity collection to populate the tree diagram.
This section is still under construction. The completed version will be available in IFS Applications 10 Update 7.* *
4. Adding content to tree diagram
Content to a node in tree diagram can be added in the form of fields. The fields need to be defined inside each zoom category in a zoomlevel block.
treediagram <tree_diagram_name> {
   ...
   node <node_name> for <entity> {
      zoomlevels {
         small {
            field ...;
            ...
         }
         medium {
            field ...;
            field ...;
            ...
         }
         large {
            field ...;
            field ...;
            field ...;
            ...
         }
      }
      ...
   }
}
Declarative syntax - Content added to a treediagram
zoomlevel - Contains 3 categories of zoom levels. Each zoom level can be used to define the fields that are visible when the tree diagram is zoomed. At least one field needs to be defined in one of the zoom levels, to show values on the node in the tree diagram.
treediagram OrganizationTreeDiagram {
   ...
   node BusinessUnit for TstBusinessUnit {
      zoomlevels {
         small {
            field BusinessUnitId;
         }
         large {
            field BusinessUnitId;
            daterangefield {
               startdate ValidFrom;
               enddate ValidTo;
               label = "Validity Period";
               searchable = false;
            }
         }
      }
      connections {
         node BusinessUnit(BusinessUnitArray) {
            connectedFrom = BusinessUnitId;
            connectedTo = ParentBusinessUnitId;
         }
      }
      ...
   }
}
Example code - Content added to a treediagram
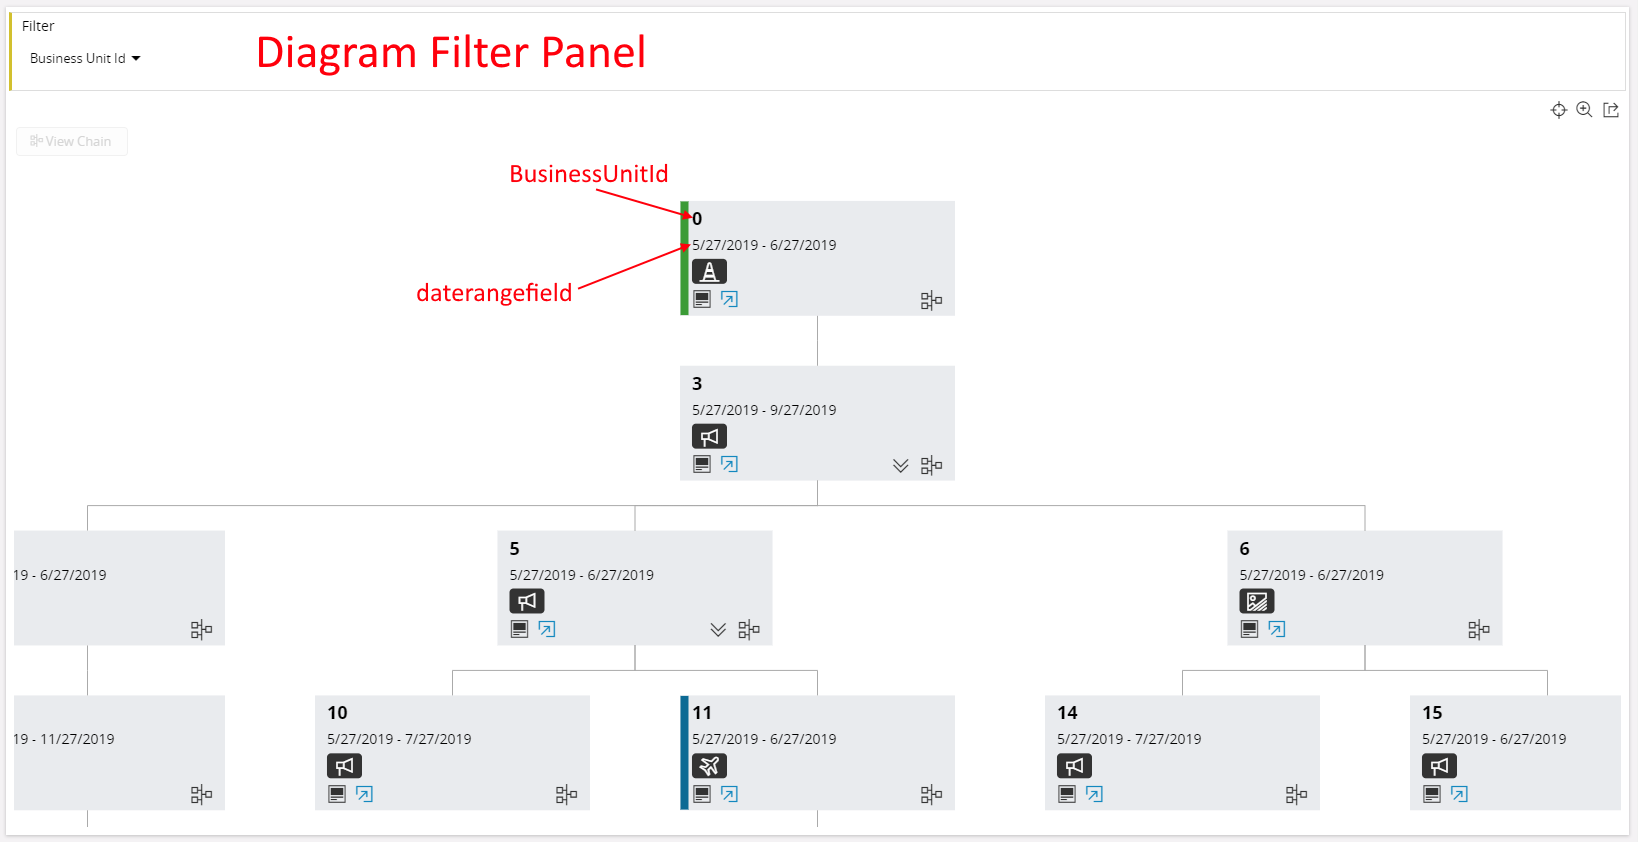
The fields defined in the zoomlevels are automatically picked to be visible in the tree diagram filter panel. This behavior can be avoided by using the property searchable inside the field block.

Figure 2 - Tree Diagram Filter Panel & Node Values
5. Adding nested tree diagram
The building block for the tree diagram is a node. A node definition represents a tree diagram. A tree diagram block can contain multiple nodes based on the depth of the nesting.
If a parent-child relationship exists from a node in the tree diagram (which means it acts as a parent), then a nested tree diagram can be defined.
If a node has a nested node, an icon appears  , which can be clicked to draw a nested diagram.
treediagram <tree_diagram_name> {
   ...
   node <node_name> for <entity> {
      ...
      connections {
         node <node_name>(<tree_diagram_array>) {
            label = <string>
            connectedFrom = <column_name>;
            connectedTo = <column_name>;
            nestednode <nested_node_name> {
               visible = [Expression];
               label = <string>
               iconset {
                  icon <icon_name> {
                     expression = [Expression];
                  }
               }
            }
         }
      }
   }

   node <nested_node_name> for <entity> {
      ...
      connections {
         node <nested_node_name>(<nested_tree_diagram_array>) {
            connectedFrom = <column_name>;
            connectedTo = <column_name>;
            ...
         }
      }
   }
}
Declarative syntax - Nested tree diagram
<nested_node_name> - Node identifier, use a meaningful name.
<entity> - Name of the entity where the nested_tree_diagram_array is based on.
<nested_tree_diagram_array> - This is an array defined in the respective projection file. This is considered to be the child array for a respective parent node/record.
visible - Can be used to control visibility of nested icon in a node, based on a condition.
label - Can be used to set a node or a tooltip text of the nested diagram or nested icon. See label.
iconset - Can be used to change the default icon. See iconset.
treediagram OrganizationTreeDiagram {
   label = "Diagram for Organization";

   node BusinessUnit for TstBusinessUnit {
      label = "Business Unit Diagram";
      zoomlevels {
         small {
            field BusinessUnitId;
         }
         large {
            field BusinessUnitId;
            daterangefield {
               startdate ValidFrom;
               enddate ValidTo;
               label = "Validity Period";
               searchable = false;
            }
         }
      }
      connections {
         node BusinessUnit(BusinessUnitArray) {
            connectedFrom = BusinessUnitId;
            connectedTo = ParentBusinessUnitId;
            nestednode BusinessUnitItem {
               visible = [BusinessUnitId = 3 or BusinessUnitId = 5];
            }
         }
      }
   }

   node BusinessUnitItem for TstBusinessUnitItem {
      zoomlevels {
         small {
            field ItemId;
            field Type;
            field Description;
         }
      }
      connections {
         node BusinessUnitItem(BusinessUnitItemArray) {
            connectedFrom = ItemId;
            connectedTo = ParentItemId;
         }
      }
   }
}
Example code - Nested tree diagram
Keywords
None.
Properties
Below is a list of properties that can be used to customize the control.
card | collapsed | details | emphasis | iconset | label
Example
Below is an example of a tree diagram with multiple settings.
Example 1
treediagram OrganizationTreeDiagram {
   label = "Diagram for Organization";

   node BusinessUnit for TstBusinessUnit {
      label = "Business Unit Diagram";
      details = BusinessUnit(BusinessUnitId);
      emphasis Complementary2 = [BusinessUnitId = 4];
      emphasis Complementary8 = [BusinessUnitId = 8];
      emphasis Complementary9 = [BusinessUnitId = 0];
      emphasis Complementary5 = [BusinessUnitId = 11];
      iconset {
         icon "alert" {
            expression = [BusinessUnitId = 4];
         }
         icon "assistant" {
            expression = [BusinessUnitId = 8];
         }
         icon "attention" {
            expression = [BusinessUnitId = 0];
         }
         icon "bad-image" {
            expression = [BusinessUnitId = 6];
         }
         icon "aviation" {
            expression = [BusinessUnitId = 11];
         }
         icon "announcement";
         emphasis Complementary5 = [BusinessUnitId = 0];
      }
      card BusinessUnitCard {
         label = "Extra information on ${BusinessUnitId}";
         visible = [BusinessUnitId = 3 or BusinessUnitId = 5 or BusinessUnitId = 4 or BusinessUnitId = 10];
      }
      zoomlevels {
         small {
            field BusinessUnitId;
         }
         large {
            field BusinessUnitId;
            daterangefield {
               startdate ValidFrom;
               enddate ValidTo;
               label = "Validity Period";
               searchable = false;
            }
         }
      }

      connections {
         node BusinessUnit(BusinessUnitArray) {
            connectedFrom = BusinessUnitId;
            connectedTo = ParentBusinessUnitId;
            nestednode BusinessUnitItem {
               visible = [BusinessUnitId = 3 or BusinessUnitId = 5];
               iconset {
                  icon "gesture-excellent" {
                     expression = [BusinessUnitId = 3];
                  }
               }
               label = "Go to child nodes of ${BusinessUnitId}";
            }
         }
      }
   }

   node BusinessUnitItem for TstBusinessUnitItem {
      zoomlevels {
         small {
            field ItemId;
            field Type;
            field Description;
         }
      }
      connections {
         node BusinessUnitItem(BusinessUnitItemArray) {
            connectedFrom = ItemId;
            connectedTo = ParentItemId;
         }
      }
   }
}
Example code - Tree diagram with multiple settings