Funnel Chart
Funnel charts could be generated inside page, card, arrange and tab definitions.
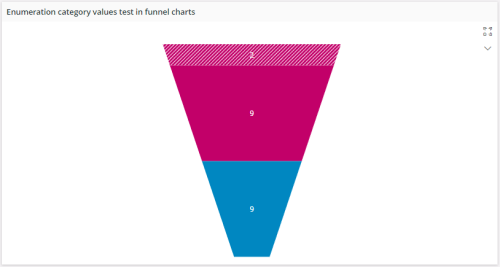
Figure 1 - Funnel chart in page
Variations
None.
When to use
Follow the steps below to add a funnel chart to a page.
1. Define a funnel chart
Define a funnel chart in the client model file using the following format.
funnelchart <funnel_chart_name> for <entity_name> {
   ...
}
<funnel_chart_name> - identity of the funnel chart, always use a meaningful identifier.
<entity_name> - The entity or the summary the funnel chart is based on, see examples below:
--------- Example code --------
funnelchart OrderTypeFunnelChart for OrderTypeSummary {
   ...
}
2. Add the funnel chart to the container
Add the funnel chart to a page, card, arrange, tab. A funnel chart gets it's vales from a data source which is either an entityset or an array.
- Add the funnel chart with its own entityset for example, to the page:
    page <page_name> {
        funnelchart <funnel_chart_name> using <entityset_for_funnel_chart>;
    }
<entityset_for_funnel_chart> - This is the entityset that serves as the data source from which the funnel chart gets its values. The entityset must be based on the same entity that was used to define the funnel chart.
------------ Example code Method 1 ------------
page FunnelChart using OrdersSet {
    funnelchart OrderCategoriesFunnelChart using OrderCategoriesSet;
    }
page <page_name> using <entityset_for_page> {
    funnelchart <funnel_chart_name>;
    }
This method is useful if the purpose of the page is to display a funnel chart of records. In such instances it is not mandatory to define an entityset for the funnel chart since it gets its values from the <entityset_for_page>.
----------- Example code Method 2 -----------------
page FunnelChart using OrderCategoriesSet {
    funnelchart OrderCategoriesFunnelChart;
}
- Add the funnel chart to use an array or a reference:
    page <page_name> using <entityset_for_page> {
        funnelchart <funnel_chart_name>(<funnel_chart_array>);
    }
<funnel_chart_array> - This is the array or reference defined in the related projection file.
Most of the time an array or reference is connected to a parent record and needs to be updated when the parent record is changed. In such instances the funnel chart needs to be bound to the control which has the parent record, for example a selector or a list. The binding is done using the bind keyword.
page <page_name> using <entityset_for_page> {
    selector <selector_name>;
    funnelchart <funnel_chart_name>(<funnel_chart_array>) bind <selector_name>;
}
------ Example code Method 3 ----------
page Form using OrdersSet {
    selector OrdersSelector;
    funnelchart OrderItemsFunnelChart(OrderItemsArray) bind OrdersSelector;
}
- Add the funnel chart to use a function that returns an entity collection:
page <page_name> {
    list <funnel_chart_name> using <function_set>;
}
<function_set> - This is the function defined in the related projection file that returns an entity collection. Function should return the same type entity collection as the funnel chart is based on. Function parameters can get values from several places like the current record of the page, global context, search context, etc.
------- Example code Method 4 ------------
page Form using ServiceInvoiceSet {
    selector ServiceInvoiceSelector;
    list ServiceInvoiceLineList using GetInvoiceLines(InvoiceNo, context.Company)
}
- Add a funnel chart to a card.
The below code snippets would show how funnel chart could be integrated to a card (Only referenced funnel chart could be generated).
(Parent-Child relationship [1-M])
card CardName for SomeEntity {
    funnelchart FunnelChartName(ChildArrayName);
}
3. Set the appropriate properties for the funnel chart
Set one or more properties for the funnel chart such as label, collapsed, centerlabel etc. For a complete funnel chart of the properties and how to set them see the Properties section below.
4. Add content to the funnel chart
Content for a funnel chart can be added in the form of argument, value and commands
The below code snippet is the very least amount of properties required to generate a funnel chart.
funnelchart FunnelChartName for SomeEntity {
   label = "This is my funnel chart title";
   argument ArgumentFieldName;
   value ValueFieldName;
}
1 - Argument
The argument keyword is one of the two main field attributes required to generate a funnel chart. Argument field being the data source field that provides arguments for series points (i.e. the field that you are applying the GROUP BY clause).
funnelchart FunnelChartName for SomeEntity {
    argument ArgumentFieldName;
}
2 - Value
The value keyword is one of the two main field attributes required to generate a funnel chart. value field being the data source field that provides values for series points (i.e. the field which has an Aggregate Function).
    funnelchart FunnelChartName for SomeEntity {
        value ValueFieldName;
    }
5. Setting TopN values
The keyword topn is used to limit the number of visible slices in the funnel chart according to different conditions. There are 3 modes in topn;
Mode 1 - Count
Is used to limit the number of slices by specifying the number slices to be shown.
    funnelchart FunnelChartName for SomeEntity {
        label = "This is my funnel chart title";
        argument ArgumentFieldName;
        value ValueFieldName;
        topn = Count(3);
    }
The above condition would make the funnel chart to only show top 3 slices along with others slice.
Mode 2 - ThresholdValue
Is used to limit the number of slices by specifying a minimum value.
funnelchart FunnelChartName for SomeEntity {
    label = "This is my funnel chart title";
    argument ArgumentFieldName;
    value ValueFieldName;
    topn = ThresholdValue(100);
}
The above condition would make the funnel chart to only show slices that has a value greater than or equal to 100.
Mode 3 - ThresholdPercent
Is used to limit the number of slices by specifying a minimum percentage of the total
    funnelchart FunnelChartName for SomeEntity {
        label = "This is my funnel chart title";
        argument ArgumentFieldName;
        value ValueFieldName;
        topn = ThresholdPercent(20);
    }
The above condition would make the funnel chart to only show slices that has a percentage greater than or equal to 20 of the total.
In all of the 3 modes others slice would be shown along with slices which satisfied the given criteria. others slice represents the sum of all the other slices which didn’t satisfy the condition.
6. Setting custom colors on funnel chart
Slices could be colored using the emphasis property
funnelchart FunnelChartName for SomeEntity {
   label = "This is my funnel chart title";
   argument ArgumentFieldName;
   value ValueFieldName;
   emphasis Complementary1 = [ArgumentFieldName = "Something"];
   emphasis Complementary3 = [ValueFieldName = "Something"];
}
The emphasis property has predefined set of colors to choose from.
Could evaluate the condition from either ArgumentFieldName or ValueFieldName.
7. Setting patterns on funnel chart
Slices could be filled with patterns using the pattern property.
funnelchart FunnelChartName for SomeEntity {
   label = "This is my funnel chart title";
   argument ArgumentFieldName;
   value ValueFieldName;
   pattern fillpattern1 = [ArgumentFieldName = "Something"];
   pattern fillpattern2 = [ValueFieldName = "Something"];
}
pattern has predefined set of constants to choose from.
Could evaluate the condition from either ArgumentFieldName or ValueFieldName.
8. Navigate to details in funnel charts
The details property can be used to navigate to details of a funnel chart.
page <page_name> {
    funnelchart <funnel_chart_name> using <entityset_for_funnel_chart>{
        details = <detail_page_name>(arguments)
    }
}
The arguments are the primary and foreign keys needed to query the record.
page ActivityPage using ActivityChartEntityset {
    title = "Activity Chart";
    funnelchart ActivityFunnelChart {
        details = ActivityDetailsPage(ActivityType);
    }
}

funnelchart ActivityFunnelChart for ActivityChartSummary {
    argument ActivityType;
    value Count;
}
9. Using page search context for filtering chart datasource
Page search context values can be used in charts for filtering chart data source. This has to done when adding a chart into a page. The following is a code example implementation of it.
page EmployeesPage using Employees {
   searchcontext PageSearchContext {
      defaults = GetPageSearchContextDefaults();
   }
   funnelchart  EmployeesFunnelChart using Employees {
      filter = [StartDate < PageSearchContext.FromDate];
   }
}
10. Using chart search context for filtering
Chart search context values can be used in charts for filtering chart data source. The following is a code example implementation of chart level search context.
page EmployeesPage using Employees {
funnelchart EmployeesFunnelChart using getEmployees(ChartSearchContext.<PARAM1>, ChartSearchContext.<PARAM2> ) {
searchcontext ChartSearchContext {
defaults = GetChartSearchContextDefaults();
}
}
}
Search context values can be used inside charts for different purposes. Example: commands, labels
11. Modify settings in funnel chart
With this functionality it is possible to further configure chart and modify chart metadata. The following is a code example implementation of it.
funnelchart  CostSummaryGraph for CostSummary {
   enablesettings = [true];
}
This will enable a settings button in the chart toolbar, clicking the button will open a chart settings dialog.
Properties
Below is a list of properties that can be used to customize the control.
collapsed | centerlabel | details | filter | label | visible | searchcontext
Example
Example 1 - Funnel Chart with Basic settings
Below is an example of a funnel chart with multiple settings.
funnelchart OrderChart for TstOrderItem {
   label = "Orders Funnel Chart";
   argument ItemNo;
   value Quantity;
   command Command1;
}
Example 1 - funnel Chart with Basic settings