Enhancing Reports with Charts
Use the Chart control to add charts to your reports. Create and customize charts using the Chart Designer. Choose from various chart types like bar, point, line, pie, doughnut, and area charts. You can display multiple data series within a single chart.
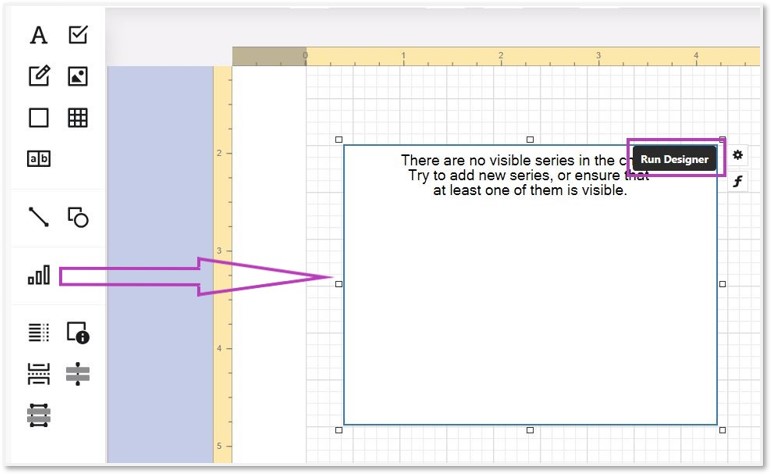
- Add a Chart element to the layout
Configure properties.

Note: Do not specify the data source.
Charts can be used to visualize data in different parts of a report:
Header/Footer: Display a summary of the entire report.
Group Header/Footer: Visualize data within each report group.
Detail Band: Display a chart for each record in the report data.
To provide data to a chart's series, specify the following:
- Argument Data Member: The field for point arguments.
- Value Data Members: The fields for point values.
Add Charts Individually for each series:
Add a chart element from the toolbox to the layout & specify the Data member.
Add a Series: Locate Series in the chart elements tree and click the plus button. Choose a series type (e.g., Bar).
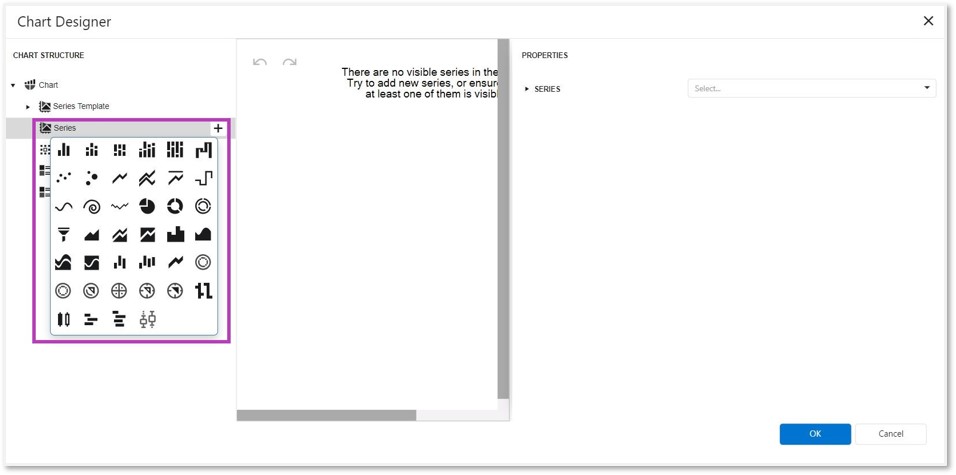
Populate Series: Specify the Argument Data Member and Value properties.

Chart Designer Guidelines
To create charts, ensure your data has a flat structure. A flat data structure means that all data fields required for the chart are on the same level. Nested or hierarchical structures are not supported in charts.
