Mobile App Status
The lobby Mobile App Status shows several metrics gathered for a certain app and show it in a more graphical view. To find the lobby Mobile App Status go to Solution Manager / Configuration / Lobbies and search for Mobile App Status.
The Mobile App Status is centered around certain areas with key metrics for each area.
The Mobile App Status is per app and is given as a parameter.
| App Name | Parameter |
|---|---|
| CRM Companion | CrmCompanionApp |
| Mobile Maintenance for Aviation | FLMaintApp |
| MWO Service | ServiceEngApp |
| MWO Maintenance | MaintEngApp |
| Notify Me | NotifyMe |
| Scan It | ScanIt |
| Trip Tracker | TripTracker |
Devices and Users
For Devices and Users the following metrics exist:
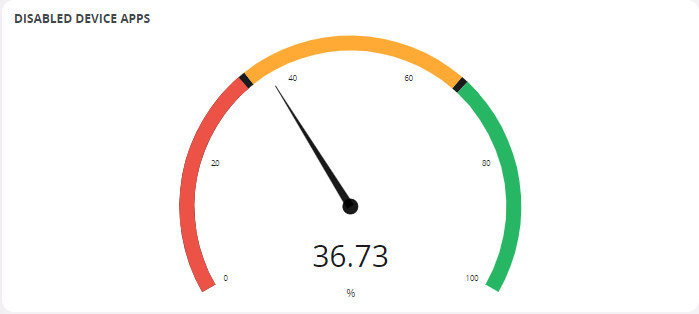
Disabled Device Apps
Shows how many devices are disabled today. If you have a high value of disabled devices you should consider if the devices are still in use and clean up the disabled devices. The percentage shows how many disabled devices exist out of total number of devices.
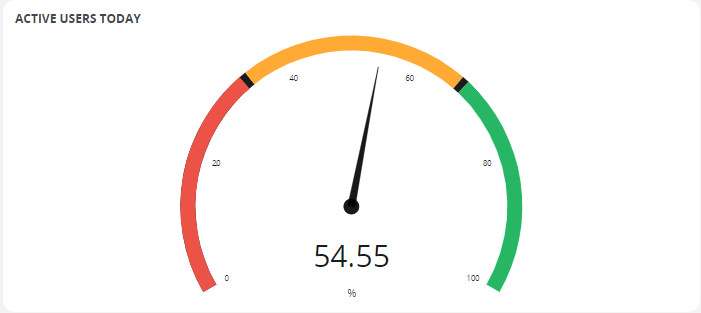
Active Users Today
Shows how many users are active today. The percentage shows how many active users exist out of total number of users with devices.
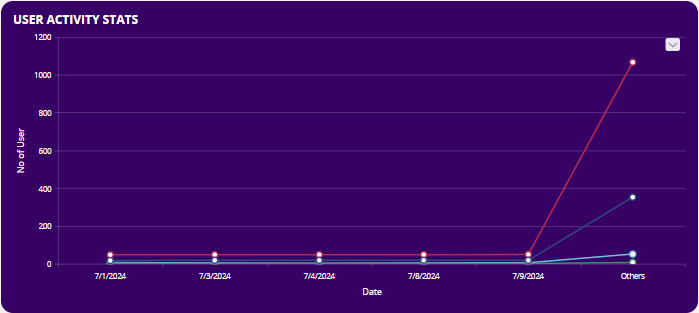
User Activity Stats
Shows how many users are active on a certain date.
Active User/Devices
Shows how many user devices are currently active.
Active User/Devices Last Access > 7 days
Shows how many user devices that has not been active the last 7 days. If you have a lot of devices that has not been active for a period of time, you should consider if those devices are used anymore and disable those devices.
Total User/Devices
Shows how many total user devices that exist.
Disabled User/Devices
Shows how many user devices that are disabled. If you have a high number, you should consider if the devices are still in use and delete the disabled user devices.
New Device Registration Today
Shows how many new device registration that has happened today.
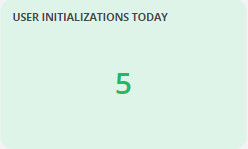
Users Initializations Today
Shows how many user initialization that has happened today. If the number is high every day, you need to investigate why users are initialization every day. Initialization usually happens the first time you use the app or if you change something, e.g. adding a custom attribute, otherwise initialization should not happen on a day to day basis.
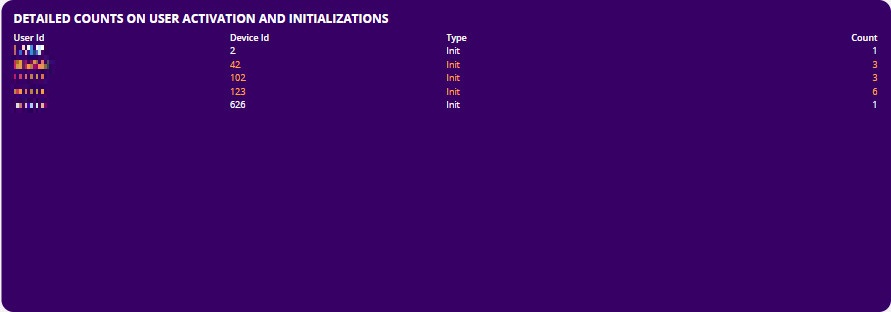
Detailed Counts on User Activation and Initializations
Shows detailed information about whom and which devices has done user activations or initializations today as well as how many times they have done it.
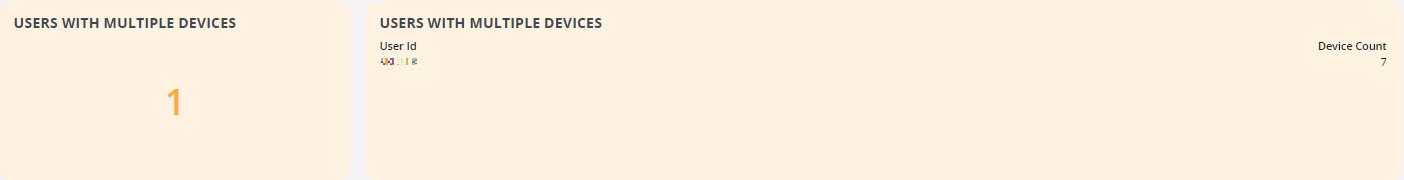
User with Multiple Devices
Shows total number of users with multiple devices as well as which users and how many multiple devices the user has.
New Device Activations Today
Shows total number of device activations today as well as which user has done the device activation.

New User Activations Today
Shows total number of user activations today as well as which user has done the activation.
Failed Transactions
For Transactions the following metrics exist:
Failed Transactions
Shows how many failed transactions that currently exist. The value should always be 0 and if you have any other number you need to resolve this.
Queued Transactions
Shows how many queued transactions that exist. If you see that the queued transactions are getting higher and higher, you need to investigate why it increases.
Failure Management
Shows how many deleted and ignored transactions that has occured today.
App Configuration Setup
For App Configuration Setup the following metric exist:
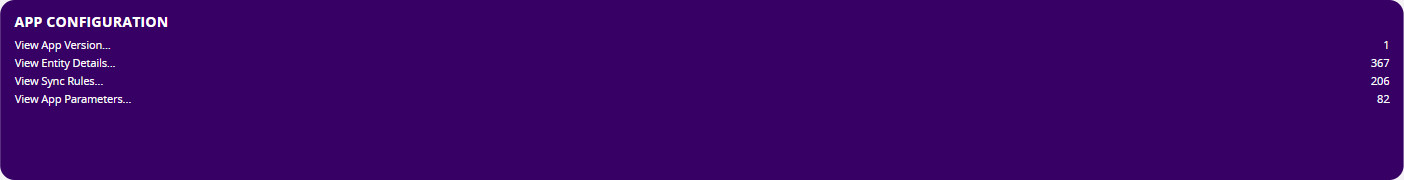
App Configuration
Shows links to to different app configuration pages, so you can see the setup for the app.
Messages and Background Jobs
For Messages and Background Jobs the following metrics exist.
Queued Push Messages
Shows the total number of queued push messages. If you see that the queued push messages are getting higher and higher, you need to investigate why it increases.
Queued Out Messages
Shows the total number of queued out messages. If you see that the queued out messages are getting higher and higher, you need to investigate why it increases.
Completed Push Messages (Today)
Shows the total number of push messages today.
Failed BG Jobs
Show total number of failed background jobs. If you have any failed background jobs, you need to check why it has not been run and rerun it.
General Synchronization Process Information
For General Synchronization Process Information the following metric exist:
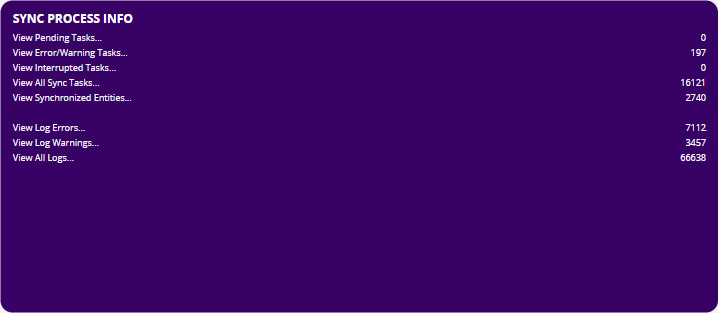
Sync Process Information
Shows links to different pages within IFS Cloud Web, so you can directly go to the area you want to know the details about.
Synchronization Times
For synchronization time the following metrics exist:
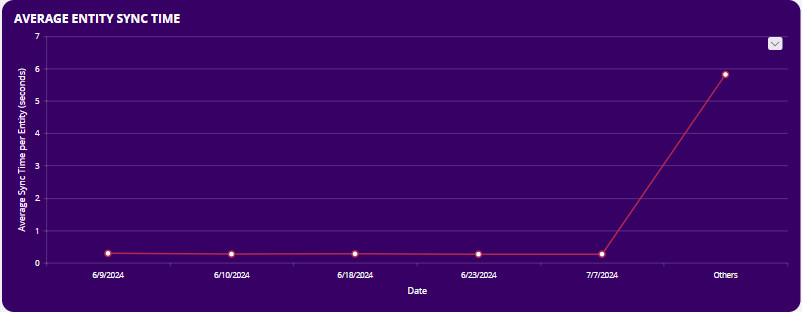
Average Entity Sync Time
Shows the average entity synchronization time, in seconds. Very high values in this graph might indicate performance problems for certain entities and needs to be investigated to see whether it is normal or not.
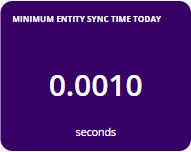
Minimum Entity Sync Time Today
Shows the lowest synchronization time in seconds today.
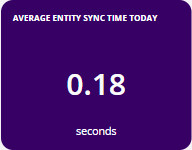
Average Entity Sync Time Today
Shows the average synchronization time in seconds today.
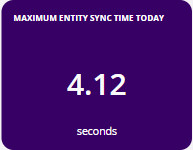
Maximum Entity Sync Time Today
Shows the highest synchronization time today.
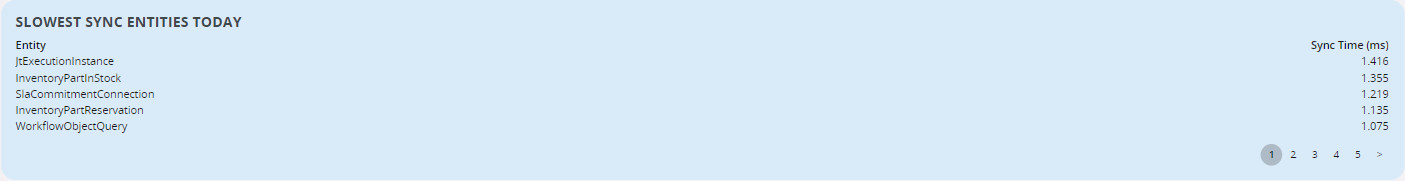
Slowest Sync Entities Today
Shows a list of all synchronized entities in milliseconds today, with the entities that takes the longest time first. Each entity that has a high value might need to be reviewed as it decreases the performance in the synchronization. It might not be anything wrong, it could be dependent on the data volume for the entity, but good to review and see if any additional filter can be added to reduce the time.
Synchronization Data Volumes
For synchronization data volumes, the following metrics exist:
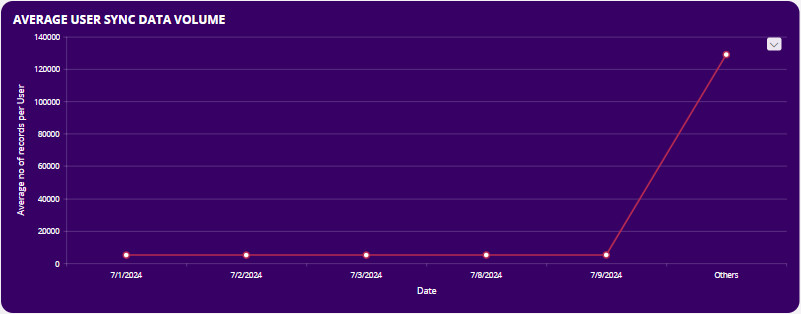
Average User Sync Data Volume
Shows the average synchronization data volume for a user.
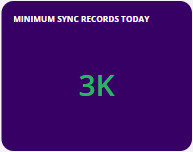
Minimum Sync Records Today
Shows the lowest amount of records during a synchronization today.
Average Sync Records Today
Shows the average number of synchronized records today.
Maximum Sync Records Today
Shows the highest amount of records during a synchronization today.
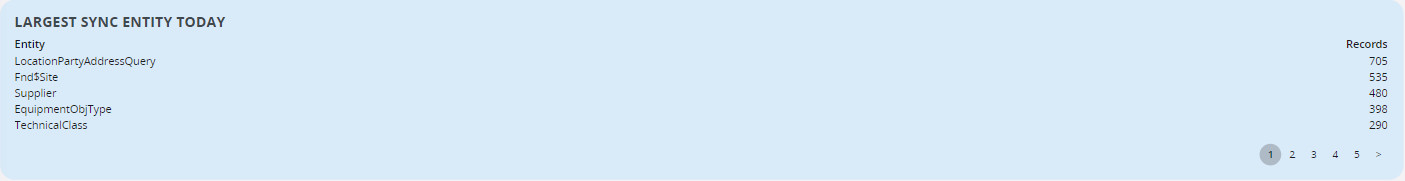
Largest Sync Entity Today
Shows a list of all synchronized entities today, with the entities that are largest first. Each entity that has a high value might need to be reviewed as it decreases the performance in the synchronization. It might not be anything wrong, but good to review and see if any additional filter can be added to reduce the records of data that is synchronized.
Scheduled Tasks Status
For Scheduled Task Status the following metric exist:
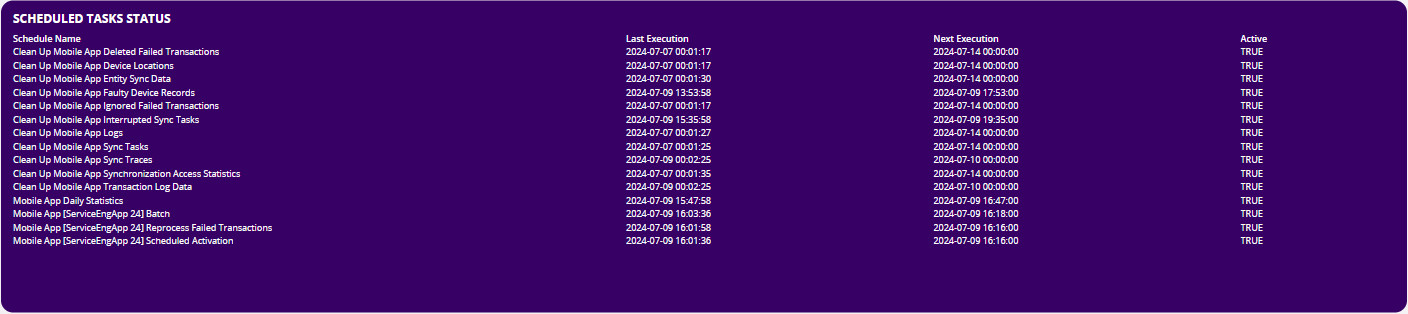
Scheduled Tasks Status
Shows all the mobile scheduled tasks with information when it was last executed and when it will execute next time and whether it is active or not.
Applications with Development Errors
For Applications with Development Errors the following metric exist:
Applications with Development Errors
Shows if any app has a deployment error and needs to be redeployed to the database again.