Creating and Modifying Layouts
This section of the developers guide describes how to develop a graphical layout for a report. The input to the tool is a description of the XML structure in the form of an XML schema (.xsd). One of the files generated from the modeled report structure. Developing the layout and defining the structure of the report data (modeling) goes hand in hand, it's important to understand that the structure of the data determines what can be achieved in the layout.
Concepts
There are a couple of basic concepts that are used through out the tool and layout design process.
First of all there a are couple of different data/file types involved. An XML file that consists of the data that is generated by the business logic layer. To use the tool you need a XML schema (XSD) that describes the structure of the data. The schema contains information of the logical structure of the data, it contains data type information and so on. The XSD is what you supply as input to the tool as a first step when you are about to create a report layout. Given the structure of the XML you will be able to graphically design the layout and generate a report with .rdl file extension, basically RDL layout will be saved with XML data format.
The structure of the XML (i.e. the XSD schema) very much determines what you are able to do with certain elements in the data. Where you can place them, whether or not you can iterate through a collection of items and so on. Due to this it is very important that you put a lot of thought into the data assembly step and the design of the XSD schema. It is not possible to alter or change how the data is grouped within the tool. It's possible to ignore grouping, but it's not possible to create new logical groups. If you for instance have a data structure that groups customers based on location, you can create a report that list the customers based on this grouping or not, but you can't create a report that list the customers based on some other criteria such as size. You can still sort them on size but you can not group them. Further more, if you have a master detail structure you can not use detail information in any level above that detail level. What this means in practice is that if you have an order with a number of order rows, you can not use any of the data from the order rows in the order header. This is simply because there is no way of knowing from which one of the order rows to pick that information. The other way around, putting header data in details, is perfectly ok.
XML is a tree based data structure and this is reflected by a tables concept in the tool. Connecting a table to a certain node in the schema/XML will result in a loop/iteration. When you use the tables tool in your layout you are designing the layout of one row in that table. Each child element of the XML node to which the table is linked will result in the designed output once you render it. The other building block is block containers or simply blocks. These can be used to group content, to make it easier to work with.
There are three types of pages in the tool, first, repeat and last. Each page consists of three sections, header footer and flow. There is no need to use all page types nor page sections if not necessary to achieve the desired layout. The page types first and last makes it possible to design specific layouts for the first and last page. All other pages will get the "repeat" layout. In the header and footer section of a page you put static content, page header and footers. They layout of a header and footer is fixed, theses sections will not expand as the flow section. In the header and footer it's wysiwyg. The flow section is where you put tables, things that will expand.
Overview Creating layouts
This part of the guide is based around the same sample report that was used to illustrate the modeling part, the component information report (module_rep) which lists a number of modules, per module there is a list of logical units and for each database object there is a list of database objects. The layout it self simply list all database objects, the logical unit is included, but the actual grouping is not used. The schema and a sample XML file can be found here (xsd, xml) When you start the tool a window looking something like this will appear.
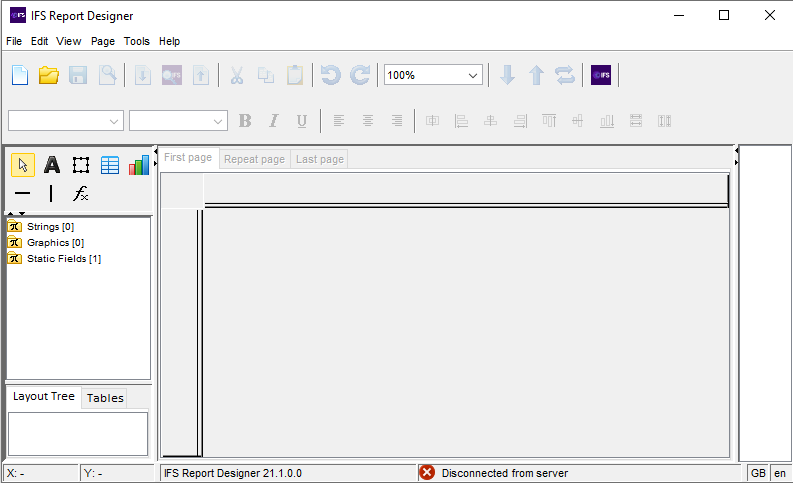
The window consists of four sections. The toolbar, which is pretty standard, with a number of tools used to create and modify a layout. The upper left tree control shows objects that can be dragged into the layout to create the layout. This is where all the elements defined in the XML schema (xsd) will be available once loaded. The area to the right is the layout it self. Once you create or open a layout a paper type wysiwyg layout will appear here. In the lower left section the XSL-FO tree is shown. This part becomes meaningful if you know a bit about XSL-FO, it can also be used to select objects in the layout even if you are not that familiar with XSL-FO.
There is two ways to creating and opening layouts. In one the tool is connected to a server and in the other the tool is disconnected. Press the connect button  to connect to a server. The workflow are similar for both ways, use the File menu or the buttons to open an existing layout or to create a new one. When creating a new layout, if connected the user is prompted with a dialog that displays the available schemas in the database. If disconnected, the user selects a schema from a browser dialog. When opening an existing layout, if connected, the schema is automatically selected from the database. If disconnected, normally the schema is detected automatically, but if no schema is found you will be asked to manually locate the schema.
When creating layout from scratch, either connected or disconnected, you will be presented with a new layout properties dialog, see below.
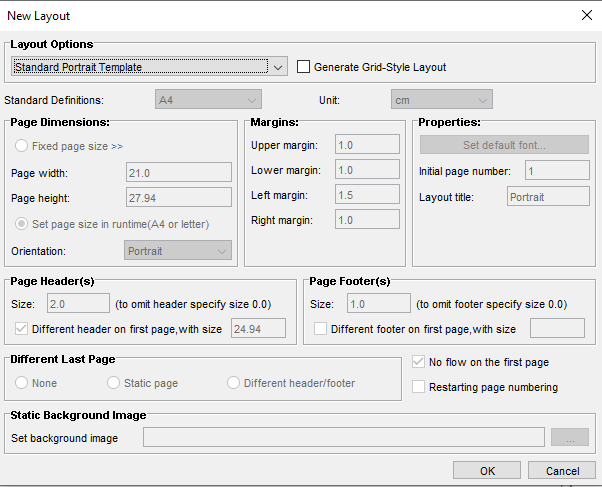
There are four main layout options in this dialog, two of which creates a standard layout based on a template (portrait or landscape). Using these two options you will get a report that has a predefined standard first page, and a standard header and footer on the repeat page. These two templates also use a dynamic page size which makes it possible to design one combined layout for use with both A4 and US Letter paper formats. From a developer point of view you will get a page which is the least common denominator of the two formats.
If the template is not used it is possible to create a custom layout. Where the page size can be set to fix or dynamic format, margins can be customized and so on. The lower section of the dialog is used to define headers and footers per page type. Page headers for first and repeat pages are defined in Page Header(s) section. Similarly, page footers for first and rest pages are defined in Page Footer(s) section of the dialog. Note that it's not only possible but fairly common to use the same footer on both the first and rest page. For last page definitions, look in Different last page section at the bottom of the dialog.
The fourth option is to use the Static Form layout, this layout will add a static background image (an image or a pdf) to the report.
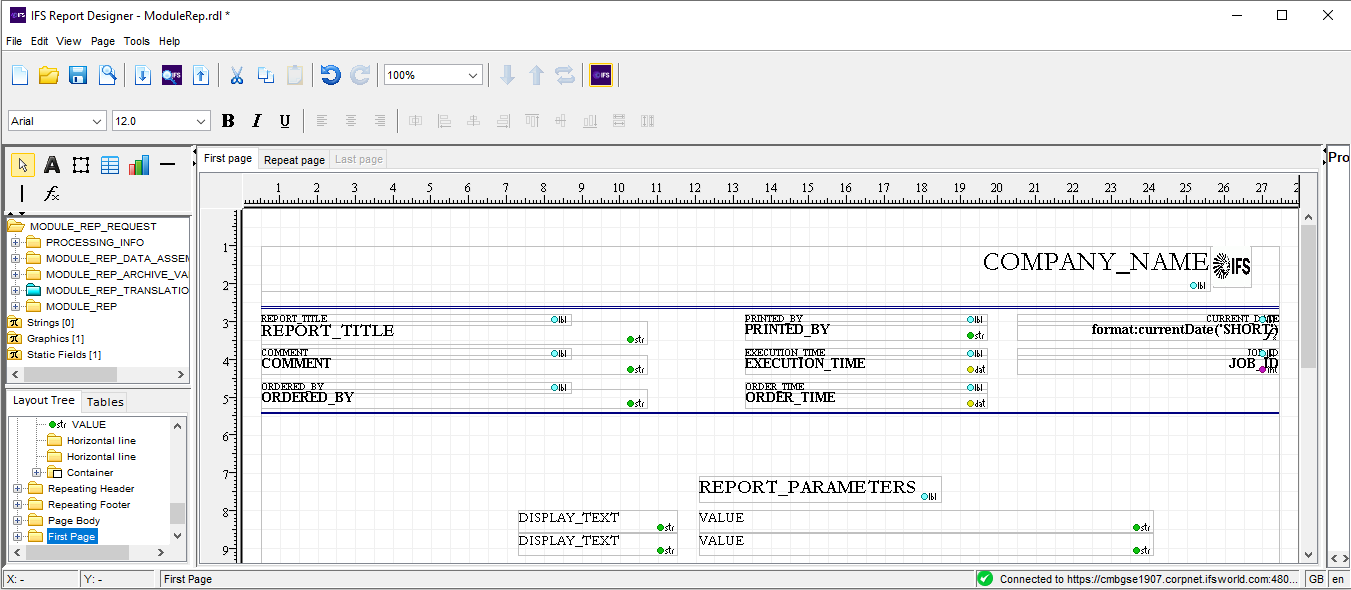
Creating a new layout using the standard landscape template based on the sample schema mentioned above, this is how the tool would look. We're looking at the first page which is indicated by the first tab being selected. To get to the repeat page, select the repeat page tab and for the last page, select the last page tab. The last page tab is only available if the layout has a specific last page.
The repeat page would look like below. The header and footer sections of the page is selected in this screen capture.
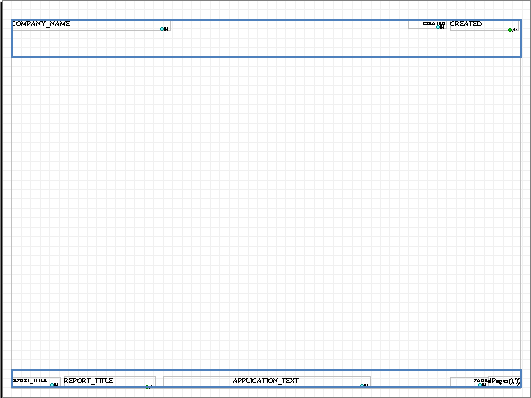
The page header and footer is used for static information, while the flow is used for dynamic information where you do not know how many occurrences there will be for an object for instance. In the header and footer, elements are placed using an absolute positioning approach, while relative positioning is used in the flow area. In the static areas (header and footer) you can add blocks, elements, lines and graphics simply by dragging them from the tree and dropping them into the layout. Tables can only be placed within flow areas. A table consists of a number of rows and columns (cells). Tables can be nestled (tables inside other tables/cells) making it possible to create virtually any structure.
More about how to work with tables later on. Let us concentrate on the left upper tree control for a minute. On the top level the tree looks like this.
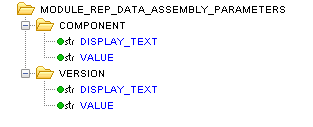
The first element in the three, the MODLULE_REP_REQUEST element, and all it's child elements are a direct mapping of the XML schema. The PROCESSING_INFO element contains a number of attributes such as when the report was ordered, by whom, how many copies and so on. The MODULE_REP_DATA_ASSEMBLY_PARAMETERS section contain all report parameters, for this report component and version can be supplied when running the report. Kind of a selection criteria. This is something that you would normally see on the first page of the report. MODULE_REP_TRANSLATIONS contain all report specific translations, like column titles and report texts. The MODULE_REP element contains the actual report data.
The strings element, is where you can define custom strings to add in the layout. Normally this isn't something you would use in a real layout since any such texts wouldn't be translated when formatting the report using different languages. The graphics element is where you can import images/logotypes from disk to use in the layout. Both graphics and strings are created using a RMB option. The static fields element contains special fields that can be used in the layout. Currently only one such field exist and that is a page count field.
Expanding the different sections and this is what it looks like.
 |
 |
 |
All Elements/attributes in these structures can easily be added to the layout by simple dragging and dropping them at the desired location in the layout are. Added elements/attributes will be highlighted in blue.
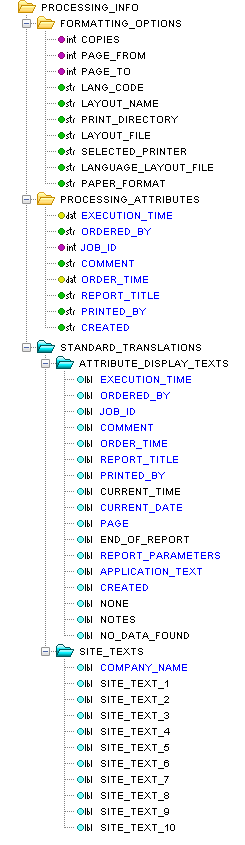
The processing info section consists of three sub sections. Formatting options are things that can be set by the user when the print/preview is requested. Processing attributes are things set by the framework at request/execution time. The standard translations section contains attributes display texts for formatting options and processing attributes as well as site texts.
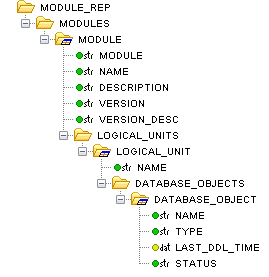
The module_rep section contains the actual data. The elements module, logical_unit and database_object all have a slightly different icon, ![]() or
or ![]() , this icon indicates that these elements may appear multiple times in the XML data and can be connected to a table for iteration over all occurrences. This structure is an exact representation of the report data structure as it was modeled in IFS Developer Studio. The ordinary elements are aggregates, the leafs are attributes and the special table elements are aggregate arrays. So what this structure tells us is that this report consists of a number of modules, each module has a name, module id, description and so on. A module can contain a number of logical units, consisting of a name, and a number of database objects. A database object have a name, type, status and so on.
, this icon indicates that these elements may appear multiple times in the XML data and can be connected to a table for iteration over all occurrences. This structure is an exact representation of the report data structure as it was modeled in IFS Developer Studio. The ordinary elements are aggregates, the leafs are attributes and the special table elements are aggregate arrays. So what this structure tells us is that this report consists of a number of modules, each module has a name, module id, description and so on. A module can contain a number of logical units, consisting of a name, and a number of database objects. A database object have a name, type, status and so on.
The module_rep_translations section contains all the attribute display texts for the attributes in the data section. One will notice that the structure is the same as for the data part with the exception of the iteration/table elements. Even if there can be several modules in a report the module name attribute display text is the same for all modules. This section would also contain any report texts defined for the report, but for this particular report there are none.
The main building block when designing any report layout would be the table object. Tables are used to iterate over multiple occurrences of a specific element in the XML. In our sample report we have a number of modules. This is indicated in the tree by the table icon, ![]() , of the module element.
, of the module element.
Let's expand the standard empty template layout we created above by listing all the modules. This is done by adding a table to the flow area using the table tool,  or simply drag and drop the table icon
 ![]() from the schema tree to the layout. You will get an input dialog where you can supply the number of columns and rows of the table. After the table is created it needs to be connected to the corresponding element in the XML. Dragging the module element and dropping it on the table connects the table to the module element. What this means is that for every occurrence of a module element in the XML, the number of rows and columns will be outputted on the paper. Once the table is connected we can drag fields/attributes from the tree and drop them in the desired cell in the table. Now the layout could look something like below. The module id, name, description and version have been added to the table.
from the schema tree to the layout. You will get an input dialog where you can supply the number of columns and rows of the table. After the table is created it needs to be connected to the corresponding element in the XML. Dragging the module element and dropping it on the table connects the table to the module element. What this means is that for every occurrence of a module element in the XML, the number of rows and columns will be outputted on the paper. Once the table is connected we can drag fields/attributes from the tree and drop them in the desired cell in the table. Now the layout could look something like below. The module id, name, description and version have been added to the table.
If we would like to preview how the report would look when printed, we could use the preview action in the file menu. We will be asked to locate a sample XML file, either the file generated by the code generation can be used or we could use a file with data from a real report request. The above layout would look something like this when previewed.
The sample data only contains one module, further more there is no description of the module in the data. So far, this an extremely simple report. Let us expand it by listing all logical units for each module. What we need to do now is to add a second table as a child table to the already existing one. Depending on the desired layout this can be done in a couple of different ways. I am going to keep it simple. I am going to merge all the cells on the second line of the existing table and add the new table in that merged cell. Merging cells are done by selecting all the cells and using the merge cells option in the cells sub RMB menu. After adding the table I connect it to the logical units element by dragging and dropping and then finally I will add the logical unit name attribute to that table. This is how the tables and preview would look now.

A bit more interesting, but there is still something missing. Obviously I need some attribute display texts, or column titles. I only want these to appear once, not for every occurrence of a module or logical units. To achieve this I will use a table header. A table can optionally have a number of header and footer rows. These parts of the table will only appear once, not for all occurrences of the iterated element like the rest of the rows in the table. To add the header, simply use the RMB option add table header for the table. The translated column titles are in the module_rep_translations section in the tree and are added to the table headers in the same drag and drop manner as the other fields/attributes.

This overview covered the basic concepts of creating a new layout using the tool. To gain a better understanding of how to use the tool's functions and features click here.