Pie Chart
Pie charts could be generated inside page, card, arrange, or tab definitions.
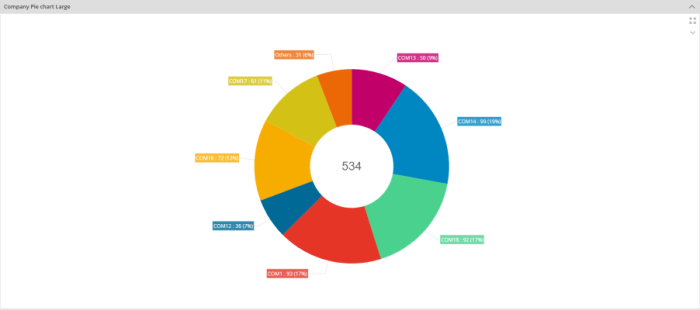
Figure 1 - Pie Chart in a Page
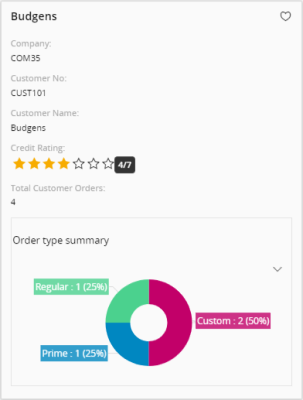
Figure 2 - Pie Chart in a Card
Variations
Bar Chart, Funnel Chart, Line Chart, Radar Chart, and Stacked Chart.
When to use
Pie charts are best to use when you are trying to compare parts of a whole and do not need to show changes over time.
How to use
Follow the steps below to add a pie chart to a page.
1. Define a pie chart
Define a pie chart in the client model file using the following format.
piechart <pie_chart_name> for <entity_name> {
   ...
}
<pie_chart_name> - identity of the pie chart, always use a meaningful identifier.
<entity_name> - The entity or the summary the pie chart is based on, see examples below:
//Example code
//-------------
piechart OrderTypePieChart for OrderTypeSummary {
   ...
}
2. Add the pie chart to the container
A pie chart can be added to a page, card, arrange, or tab. A pie chart gets it's vales from a datasource which is either as an entityset, an array or reference:
page <page_name> {
    piechart <pie_chart_name> using <entityset_for_pie_chart>;
}
<entityset_for_pie_chart> - This is the entityset that serves as the datasource from which the pie chart gets its values. The entityset must be based on the same entity that was used to define the pie chart.
//Example code Method 1
//----------------------
page PieChart using OrdersSet {
    piechart OrderCategoriesPieChart using OrderCategoriesSet;
}
page <page_name> using <entityset_for_page> {
    piechart <pie_chart_name>;
This method is useful if the purpose of the page is to display a pie chart of records. In such instances it is not mandatory to define an entityset for the pie chart since it gets its values from the <entityset_for_page>.
// code Method 2
//--------------
page PieChart using OrderCategoriesSet {
    piechart OrderCategoriesPieChart;
}
- Add the pie chart to use an array or a reference:
page <page_name> using <entityset_for_page> {
    piechart <pie_chart_name>(<pie_chart_array>);
}
<pie_chart_array> - This is the array or reference defined in the related projection file.
Most of the time an array or reference is connected to a parent record and needs to be updated when the parent record is changed. In such instances the pie chart needs to be bound to the control which has the parent record, for example a selector or a list. The binding is done using the bind keyword.
page <page_name> using <entityset_for_page> {
    selector <selector_name>;
    piechart <pie_chart_name>(<pie_chart_array>) bind <selector_name>;
}

//Example code Method 3
//----------------------
page Form using OrdersSet {
    selector OrdersSelector;
    piechart OrderItemsPieChart(OrderItemsArray) bind OrdersSelector;
}
- Add the pie chart to use a function that returns an entity collection:
page <page_name> {
    list <pie_chart_name> using <function_set>;
}
<function_set> - This is the function defined in the related projection file that returns an entity collection. Function should return the same type of entity collection as the pie chart is based on. Function parameters can get values from several places like the current record of the page, global context, search context, etc.
//Example code Method 4
//----------------------
page Form using ServiceInvoiceSet {
    selector ServiceInvoiceSelector;
    list ServiceInvoiceLineList using GetInvoiceLines(InvoiceNo, context.Company)
}
Adding a pie chart to a card
The below code snippets shows how pie chart could be integrated to a card (Only referenced pie chart could be generated).
(Parent-Child relationship [1-M])
card CardName for SomeEntity {
    piechart PieChartName(ChildArrayName);
}
3. Set the appropriate properties for the pie chart
Set one or more properties for the pie chart such as label, collapsed, centerlabel etc. For a complete list of the properties and how to set them see the properties section below.
4. Add content to the pie chart
Content for a pie chart can be added in the form of argument, value, and commands
- argument - The argument keyword is one of the two main field attributes required to generate a pie chart. Argument field being the data source field that provides arguments for series points (i.e. the field that you are applying the GROUP BY clause).
    piechart PieChartName for SomeEntity {
        argument ArgumentFieldName;
    }
- Argument label: The argument property could be extended to be manipulated with the pie chart slice label.
argument ArgumentFieldName {
    label = "${argumentText} : ${valueText} (${percentText})";
}
Label will have the structure of the pie chart slice label. Therefore each slice label would be structured inline to the definition.
- `\${argumentText}` - Will contain the argument name of the respective slice.
- `\${valueText}` - Will contain the value of the respective slice.
- `\${percentText}` - Will contain the percentage of the respective slice.

All of the above keywords wrapped around `${}` are case sensitive.

By default the argument label structure is set to:

`\${argumentText} : \${valueText} (\${percentText})`

>NOTE: Depending on the device or browser size the label would drop certain Texts from view.
- value - The value keyword is one of the two main field attributes required to generate a pie chart. Value field being the data source field that provides values for series points (i.e. the field which has an Aggregate Function).
piechart PieChartName for SomeEntity {
    value ValueFieldName;
}
5. Setting TopN values
The keyword topn is used to limit the number of visible slices in the pie chart according to different conditions. There are 3 modes in topn;
- Count Is used to limit the number of slices by specifying the number of slices to be shown.
piechart PieChartName for SomeEntity {
    label = "This is my pie chart title";
    argument ArgumentFieldName;
    value ValueFieldName;
    topn = Count(3);
}
The above condition would make the pie chart to only show the top 3 slices along with other slice.
- ThresholdValue Is used to limit the number of slices by specifying a minimum value
piechart PieChartName for SomeEntity {
    label = "This is my pie chart title";
    argument ArgumentFieldName;
    value ValueFieldName;
    topn = ThresholdValue(100);
}
The above condition would make the pie chart to only show slices that has a value greater than or equal to 100.
- ThresholdPercent Is used to limit the number of slices by specifying a minimum percentage of the total
piechart PieChartName for SomeEntity {
    label = "This is my pie chart title";
    argument ArgumentFieldName;
    value ValueFieldName;
    topn = ThresholdPercent(20);
}
The above condition would make the pie chart only show slices that has a percentage greater than or equal to 20 of the total.
In all of the 3 modes other slices would be shown along with slices which satisfies the given criteria. Other slice represents the sum of all the other slices which did not satisfy the condition.
6. Setting custom colors on pie chart
Slices could be colored using the emphasis property
piechart PieChartName for SomeEntity {
   label = "This is my pie chart title";
   argument ArgumentFieldName;
   value ValueFieldName;
   emphasis Complementary1 = [ArgumentFieldName = "Something"];
   emphasis Complementary3 = [ValueFieldName = "Something"];
}
emphasis has predefined set of colors to choose from. The condition for the color could be evaluated from either ArgumentFieldName or ValueFieldName as shown in the above example.
7. Setting patterns on pie chart
Slices could be filled with patterns using the pattern property
piechart PieChartName for SomeEntity {
   label = "This is my pie chart title";
   argument ArgumentFieldName;
   value ValueFieldName;
   pattern fillpattern1 = [ArgumentFieldName = "Something"];
   pattern fillpattern2 = [ValueFieldName = "Something"];
}
pattern has predefined set of constants to choose from. The condition for the pattern could be evaluated from either ArgumentFieldName or ValueFieldName as shown in the above example.
8. Navigate to details in pie charts
details property can be used to navigate to details of a pie chart.
page <page_name> {
    piechart <pie_chart_name> using <entityset_for_pie_chart>{
        details = <detail_page_name>(arguments)
    }
}
The arguments are the primary and foreign keys needed to query the record.
//Example Code
//------------
page ActivityPage using ActivityChartEntityset {
    title = "Activity Chart";
    piechart ActivityPieChart {
        details = ActivityDetailsPage(ActivityType);
    }
}
piechart ActivityPieChart for ActivityChartSummary {
    argument ActivityType;
    value Count;
}
9. Using commands in pie chart
With this functionality, it is possible to execute custom commands on selected data points. A data point is single record bound and has an associated record behind. Same as in Navigate to Details, it is possible to access all the attributes of the associated record upon a click. Following is a basic implementation of custom commands in pie charts.
piechart CostSummaryGraph for CostSummary {
   label = "Cost Summary Graph";
   argument CostType;
   value Count;

   command CostVariance;
   command CostActivity;
}

command CostVariance for CostSummary {
   label = "Cost Variance";
   execute {
      navigate "page/TotalActivityCost/Form?$filter=CostCategory eq $[Category]";
   }
   enabled = [Count > 3];
}

command CostActivity for CostSummary {
   label = "Cost Activity";
   execute {
      navigate "page/TotalActivityCost/Form";
   }
}
10. Using page search context for filtering chart datasource
Page search context values can be used in charts for filtering chart data source. This has to done when adding a chart into a page. The following is a code example implementation of it.
page EmployeesPage using Employees {
   searchcontext PageSearchContext {
      defaults = GetPageSearchContextDefaults();
   }
   piechart EmployeesPieChart using Employees {
      filter = [StartDate < PageSearchContext.FromDate];
   }
}
11. Using chart search context for filtering
Chart search context values can be used in charts for filtering chart data source. The following is a code example implementation of chart level search context.
page EmployeesPage using Employees {
piechart EmployeesPieChart using getEmployees(ChartSearchContext.<PARAM1>, ChartSearchContext.<PARAM2> ) {
searchcontext ChartSearchContext {
defaults = GetChartSearchContextDefaults();
}
}
}
Search context values can be used inside charts for different purposes. Example: commands, labels
12. Modify settings in pie chart
With this functionality it is possible to further configure chart and modify chart metadata. The following is a code example implementation of it.
piechart CostSummaryGraph for CostSummary {
   enablesettings = [true];
}
This will enable a settings button in the chart toolbar, clicking the button will open a chart settings dialog.
13. Select multiple data points in pie chart
With this functionality, it is possible to select multiple data points and execute custom commands on them. The following is a code example implementation of multi select.
piechart CostSummaryGraph for CostSummary {
   enablemultiselect = [true];
}
You can use CTRL+click to select multiple chart segments. On a mobile device use chart settings dialog to switch to multi-select mode.
14. Subscribe to other Charts
This functionality relates to publisher-subscriber model. Adding subscribable property makes a chart eligible to receive notifications from other charts. The following is a code example implementation of subscribable.
piechart CostSummaryGraph for CostSummary {
   subscribable = [true];
}
15. Using Publisher Parents in pie chart
This functionality relates to publisher-subscriber model. Adding publisherparents property specifies set of publishers, who can send notifications to this chart. The following is a code example implementation of publisher parents.
piechart CostSummaryGraph for CostSummary {
publisherparents = <Chart_name>, <Chart_name>;
}
Further configuration of publisher parents can be achieved through chart settings dialog.
16. Using Dynamic Tooltips in pie chart
There are two types of user defined dynamic tooltips exist for pie chart.
1 - Inline Tooltips(Deprecated from 10UPD9)
You can specify a placeholder enabled string here. The following is a code example implementation of inline tooltips.
 piechart CostSummaryGraph for CostSummary {
    tooltip =  <TEXT>; //ex: tooltip = "${PartNo} - ${Cost}"
 }
1 - Multiline Tooltips
You can specify a set of fields inside tooltip block. field visibility can be controlled. Multilined block of "{ field_label }: { field_value }" is rendered, on chart area hover. The following is a code example implementation of multiline tooltips.
piechart CostSummaryGraph for CostSummary {
tooltip {
field <FIELD_NAME>;
field <FIELD_NAME> {
visible = [<EXPRESSION>];
}
}
}
Properties
Below is a list of properties that can be used to customize the control.
collapsed | centerlabel | details | filter | label | visible | searchcontext
Example
Example 1 - Basic Pie Chart
The below code snippet is the very least amount of properties required to generate a pie chart.
//-------------------------------- MAIN PAGES ---------------------------------
page TestPage using PieChartEntityset {
   title = "Pie Chart Test Page";
   piechart PieChartTest;
}
//----------------------------- VISUAL COMPONENTS -----------------------
piechart PieChartTest for PieChartEntity {
   label = "This is my pie chart title";
   argument ArgumentFieldName;
   value ValueFieldName;
}
Example 1 - Basic Pie Chart
Example 2 - Pie Chart with multiple settings
Below is an example of a pie chart with multiple settings.
//-------------------------------- MAIN PAGES ---------------------------------
page TestPage using PieChartEntityset {
   title = "Pie Chart Test Page";
   piechart CompanySalesPieChart using CompanySalesSummaryEntityset;
}
//----------------------------- VISUAL COMPONENTS -----------------------------
piechart CompanySalesPieChart for CompanySalesSummary {
   label = "Company Sales Pie chart";
   height = large;
   centerlabel = [true];
   argument Company;
   value Sales;
   topn = Count(7);
}
Example 2 - Pie Chart with multiple settings