Tool Feature Overview
In some aspects the features of this tool are very similar to other layout or word processing applications. Such aspects would be changing font and style, aligning objects copying and pasting objects. These aspects will not be covered in this guide. We will focus on the aspects that are specific to this tool and/or where this tool differs from what one would expect compared to other applications.
Barcodes
The tool allows you to create different barcode types using RMB click on a data field and select create barcode from the pop-up menu. When you create the barcode, properties of the barcode will appear on the property panel and can change the barcode type and the other properties as required. There are number of barcode types in which you can select from and a set of standard properties that can be altered such as bar code height, width, color and text.
Read more on barcode properties and their behavior in Barcode - Details.
Blocks
Blocks are automatically created when fields are added to the static areas of a layout. Apart from these automatically generated blocks you can create your own blocks. Blocks can be used to group things in static areas. Create one block, place a couple of fields in it and you've created your self a group that can be moved around in the layout. A block can have a border which makes it possible to graphically show this grouping in the report if desired.
Charts
The XML data can be shown in the report in form of one of the supported charts. To see an example of chart usage, see the SalesReport report in the sample directory.
Conditions
Conditions can be used to control any available property of an object including if the object should be visible or not. This makes it possible to create conditional formatting, such as different colors and fonts depending on values in the data stream. Using the right mouse button you can access the conditions dialog for any object in the layout including blocks, cells, rows and tables. There are two types of conditions. First the visible condition that controls the visibility of the data. The other type is conditions that control certain properties of the object. This type of conditions can be used to control font, size, color, borders and other aspects of an object.
Click Conditions - Details to read more on conditions and how to apply them.
Connect to IFS
The tool can be connected to a server using the button:  . While connected, the tool can use resources from the database.
When creating a new layout, instead of browsing locally for a schema to use, the user can chose from the available schemas in the database.
When opening an existing layout, the schema in the database will be used instead of a local schema.
When previewing a layout, example data that is in the database is used and the user may chose from all available data for that report. Instead of having to have the example data (xml) locally.
When working with a layout, the layout can be automatically deployed to the database by clicking the deploy button:  or the file menu. No need to import the schema manually to the server.
Copy and Paste
When you copy and past objects in the layout it's important to understand that not all objects can be used on all levels in the layout. Just as it is not possible to drag and drop one of the fields from a detail section to a master section it is not possible to copy one of these fields from the table to the page header. Normally the tool would prevent you from placing any field where it's not clear how it should be used.
Custom Fields
Read more about Custom Fields from here.
Detecting missing fields in the layout
There may be instances where a layout may contain fields, which are removed or renamed in the schema. When loading such a layout you will be presented with the following warning message, “There were errors in the layout. See the “Errors” folder”.
If you look to your upper left hand corner of the tool, you will see that a new folder named “Errors” has been created at the bottom of the schema tree. Inside this folder are the nodes corresponding to the offending fields.
By clicking on such a node the corresponding filed in the layout will be selected making it easier to locate these erroneous fields. By simply double clicking on the node you can edit the name directly from the tree and all it’s occurrences in the layout will be automatically changed.
Edit History
With this feature you can maintain a log of all changes done to the layout and other facts that you may think will be useful for other developers. You can access this feature by selecting the option Edit History under the file menu.
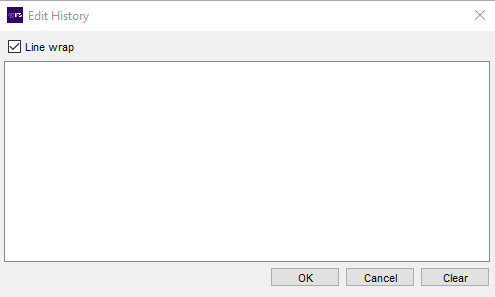
Enter the information in the space provided and it will be saved in the layout file itself. The next time you open this layout you will be able to see your previous comments as well as comments entered by others giving you a complete history of the layout.
Fonts
The IFS Report Designer tool and the IFS Print Agent comes with a set of base fonts. To be able to use additional fonts one needs to update both the design tool and the runtime (Print Agent). You'll find a guide on how to include additional fonts at Working with Fonts.
Formatting numbers and dates
Number and date fields can be formatted and displayed based on formatting options specified by you. Right-mouse click on a number or date field in the layout and you can format the output in a number of different ways. Formatting options for numbers are things like the number of digits and where to place the negative sign, before or after. For dates you can choose to use any of short, medium, long or full formats. Both the date and time part can be controlled this way. These formats are dependent on the local, so if you specify the date to be formatted as java Short date format and the locale as Swedish, you will get something like 2012-05-29, while you would get something like 5/29/12 with a US English locale for the same short date format.
A detailed guide on how to format dates and numbers can be found at Date and Number Formatting.
Functions
The tool contains a function editor. You can create functions by using the function tool, ![]() , and insert functions into static areas as blocks or in table cells. Functions can be used to perform calculations and manipulations to the data in the XML before it is placed in the layout. There are functions for string manipulations like to uppercase , sub string and such. There are also functions available to perform different mathematical operations like round and abs as well as mathematical operators like +, -, *. In addition, there are Date and Time functions such as CurrentDateTime and DateAddDay which helps to perform various date and time manipulations. Other useful functions include sum and count functions. These summarization functions can be used to calculate sums not included in the data stream.
, and insert functions into static areas as blocks or in table cells. Functions can be used to perform calculations and manipulations to the data in the XML before it is placed in the layout. There are functions for string manipulations like to uppercase , sub string and such. There are also functions available to perform different mathematical operations like round and abs as well as mathematical operators like +, -, *. In addition, there are Date and Time functions such as CurrentDateTime and DateAddDay which helps to perform various date and time manipulations. Other useful functions include sum and count functions. These summarization functions can be used to calculate sums not included in the data stream.
Another two functions under "Others" category called Rotate Text and Vertical Text can be used to add text effects in the report. Rotate text, rotates the given text by specified angle and makes possible to display text in different directions. Vertical text has the ability to return the given letters in the text vertically from top to bottom.
Using the function editor it's possible to create functions by selecting fields and operations or by editing the expression by hand.
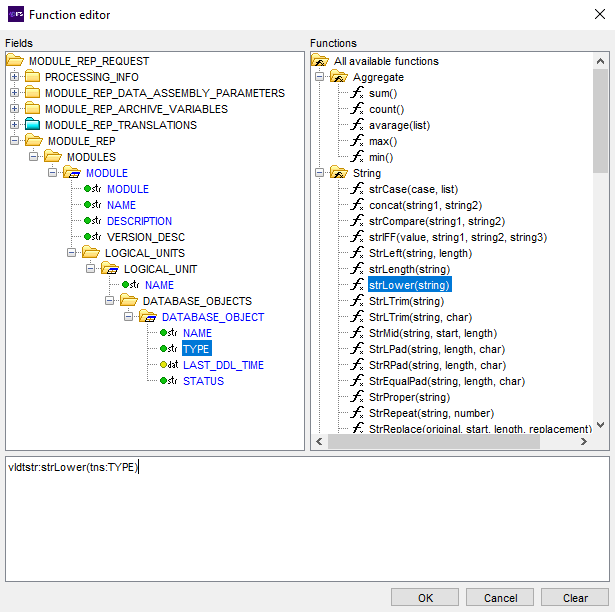
If the above function is added to the table header or footer of the logical unit table in the above sample report, the number of logical units per module would be listed.
To see a detail listing of available formulas with examples and descriptions read Functions - Details.
Images
Graphics added to the layout can be either static images or dynamic images. Static images are those which does not change a company logo for instance. Dynamic images are those which change depending on some variable in the XML. Consider a listing of inventory items with descriptions and images describing each item in the list. Such images would qualify as being dynamic images. To learn more on images read Working with Images.
Layout Properties.
In the Page Settings Dialog,
Set Default font will update the default font of the layout.
Initial page number, sets the page number of the first page of the report.
Layout Title
This property can be used to update the layout title (display name of the layout in the print dialog), once the layout title is changed, the layout has to be installed through the installer to get the layout title updated in the database. For testing purposes users can change the layout title manually from the solution manger.
Mirroring layouts
Bidirectional languages such as Arabic and Farsi are read from right-to-left. Therefore layouts created to support these languages have a logical flow of right-to-left. These layouts are referred to as RTL layouts. Using the tool one could convert a standard left-to-right (LTR) layout to a RTL. To read more on how to create mirrored layouts go here.
Moving Fields
Fields placed in the layout can be moved from one location to another. Use the ALT key and mouse drag option to drag and drop a field to a different location in the layout. Note that fields cannot be moved to locations that are not supported. For instance a field in a detail table cannot be moved to it's master table or repeating data cannot be moved to static sections of the page and so on.
Pages
There are three different types of pages. Namely first, repeat and last. All three types can have their own design. If one of the standard templates are used when creating a new layout you will get a first and a repeat page. If no template is used, the default setting is to create only a repeat page, but this can be configured manually in any way you'd like. If you use Static form, you will get maximum up to three static pages and will be able to set PDF's or images as background for the report. Which pages are created is controlled in the New Layout dialog. These page settings can also be changed at a later point using the Page Settings menu option. The only difference being that Layout Options and Standard Definition options on the dialog are only available when creating a new layout and not when editing.
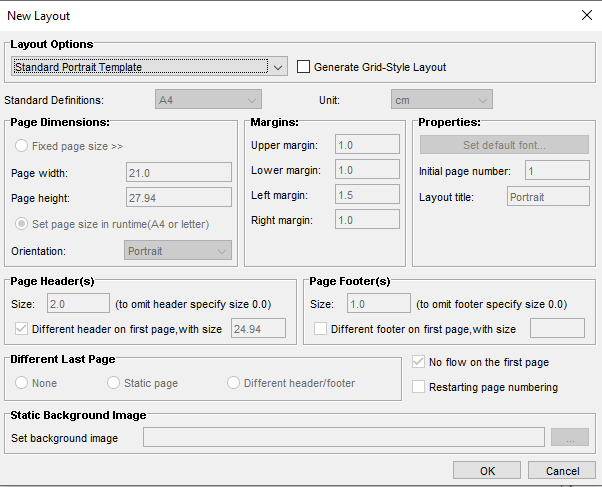
Above is an example of default page settings for a standard Portrait template. The paper size is set to dynamic, which means that the paper size will be adjusted in runtime by adding some white space on the left and right if printed on A4 paper, this since a landscape A4 is wider than a US Letter page. For a portrait layout it would be the US Letter page that would get the extra white space. The margins are 1.0 cm except the left margin which is 1.5. The layout has a header that covers most of the first page, the option that no flow should be printed on the first page is also selected. The repeat page has a 2 cm header and 1 cm footer. The same footer is also used for the first page. A last page has not been defined for this template.
To read more on how to configure page headers and footers read Pages and page sections.
Preview
The layout created can be previewed at any given time. To be able to do a preview of how the report will look when executed a sample XML file is needed. A very basic sample XML file is generated from the repository model, but usually it makes more sense getting some XML from an actual report execution. When you select preview from the file menu you will be asked to locate this XML file. Once the file is selected, RDL objects map to XSL objects and generate the XSL style sheet, with generated XSL the XSL-FO source will be created by applying the XSL style sheet to the XML. The result of this XSLT transformation will be rendered into a PDF and displayed using the default PDF reader.
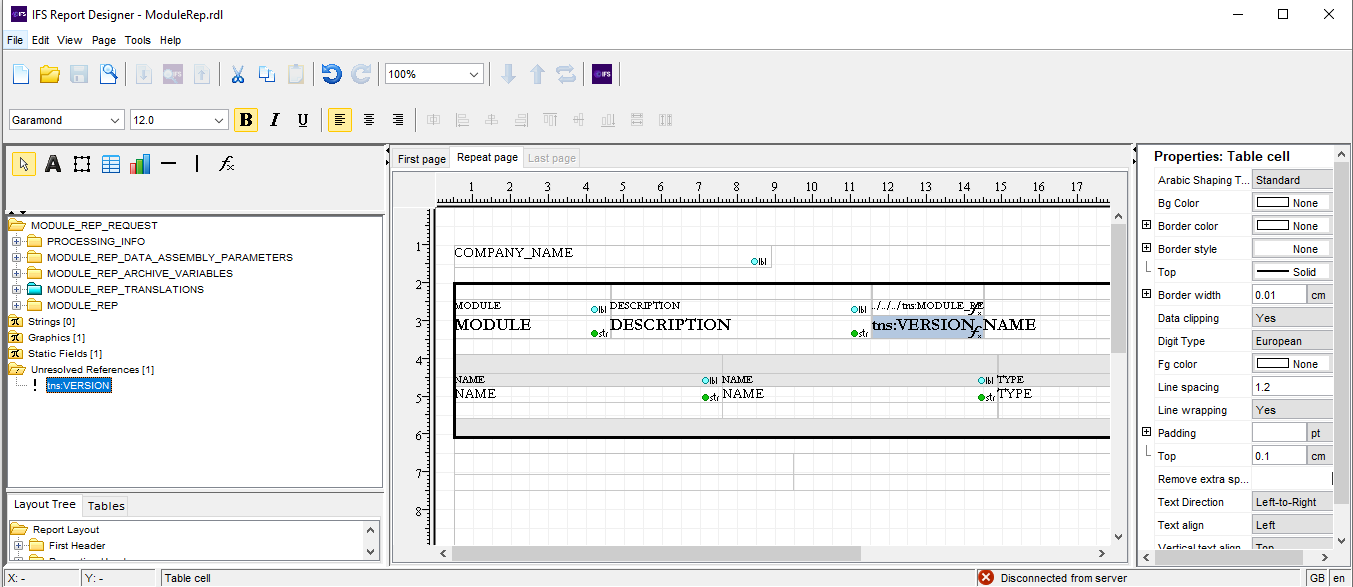
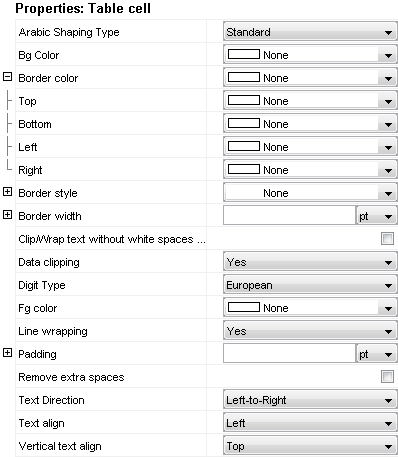
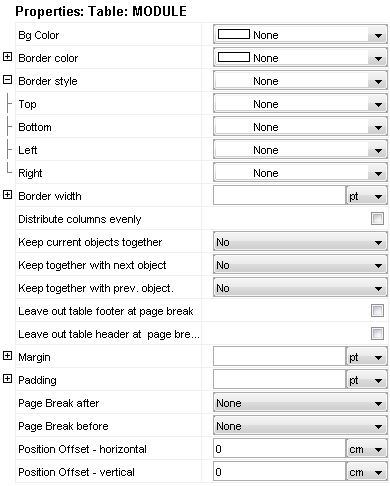
Properties
There are various properties available for different layout objects. Using these properties one can change colors, fonts, border styles or even add extra functionality such as wrapping, data clipping and page breaks. Properties can be set on tables, rows, cells and block containers. You can gain access to all these properties, from the property panel on you right hand side by selecting of each these objects. One can set Explicit values to these properties or else, each property is assigned to inherit values from their parent objects or simply set them to None. Pressing the expand button (+) will provide more specific property settings. For instance, Border style can be set on top , bottom , left or right sides of a cell or even as a combination of these options.
To learn more on properties read Properties - Details.
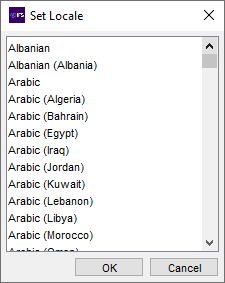
Set Locale
Use the Set Localeoption under File menu to set the default locale for the layout. This locale can be used to format date and numbers when previewing the report from tool.
Search Within
The layout can be searched to locate data placed within the layout. Right mouse click on the report layout section that needs to be searched and select Search within from the menu options. Enter the string to be searched and the matching results will be listed on the Search tab placed on the bottom left hand corner of tool. To limit the search to a particular section of the report, for instance the flow area, select the right mouse button menu options of the flow section. If the entire layout needs to be searched then use the right mouse button menu options from outside the page border.
Sorting
The rows in a table can be sorted in a number of ways. If no sorting is defined the rows will appear in the same order as in the XML data stream. To control the sorting use the RMB sorting option on the table. Doing that will bring up the below dialog.
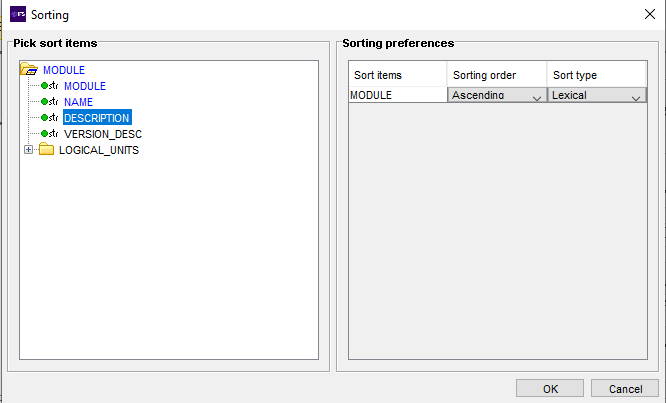
Clicking objects on the left side will add them as a sorting criteria to the right. For each added field to sort on one can choose from ascending and descending as well as lexical or numeric sorting order. Multiple fields can be added in such cases each sorting criteria will be evaluated in a top down manner.
Static Strings
These refer to constants that can be included in the layout. Static strings do not get translated and therefore, it is better to limit their use. To create static strings, right-mouse click on the schema tree node called Strings or select Add string from the Edit menu. These strings can be dragged and dropped to both static areas of the page such as header or footer or inside tables in the flow section.
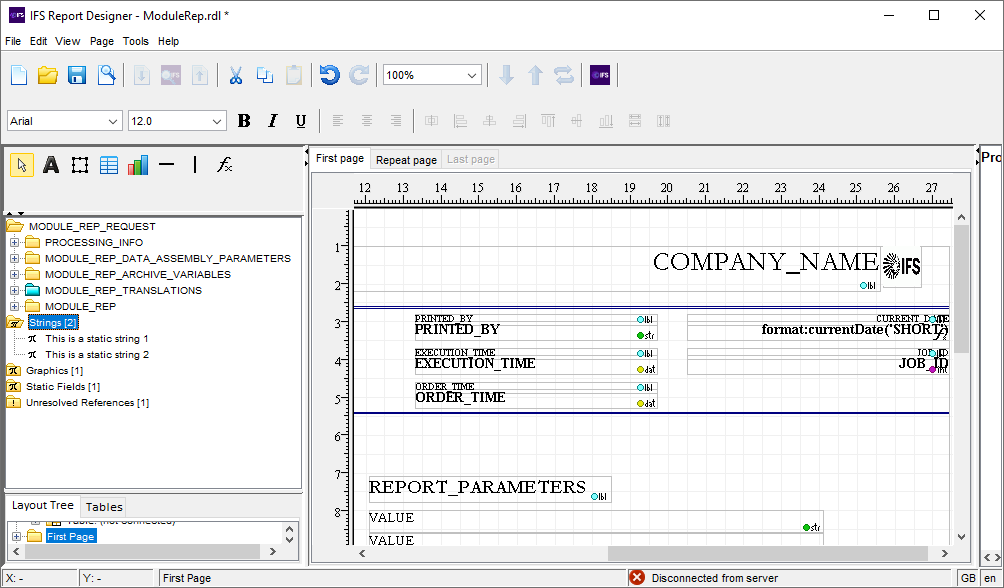
The strings created, will be added to the schema tree under the Strings node as shown above.
It is also possible to copy and paste static strings from one location in the layout to another. When copying a string, the tool creates a new instance of the string that is not a reference to the original string. The two will behave as two separate strings even though they hold the same name.
Tables
To place a table in the layout use the table tool,  or simply drag and drop the required table element
 ![]() from the schema tree. Tables are used to iterate through repeated elements in the XML. Just as a page a table can have three different sections. A table can have a header, a footer and a flow section. The header and footer only appear once for each table. The flow section is repeated for each occurrence of the element to which it is connected. A tip is to think of a table as a "for each" operator or building block. When you connect a table to an element called "LOGICAL_UNIT", think "for each LOGICAL_UNIT". Apart from the header and footer you are actually designing one line or row (remember that this line can consist of several table rows). To change different aspects and edit the table, use your right mouse button. From this menu all properties of a table, cells, columns and rows can be reached. Cells can be merged so one row in the table may contain a different number of cells compared to another row. This is a useful feature when you want to nestle tables. Lets say that you have a four level master detail structure. Create a 5 by 5 table, merge all the cells on the last row, insert a 4 by 4 table in the merged cell and so on. This way you would end up with something like this.
from the schema tree. Tables are used to iterate through repeated elements in the XML. Just as a page a table can have three different sections. A table can have a header, a footer and a flow section. The header and footer only appear once for each table. The flow section is repeated for each occurrence of the element to which it is connected. A tip is to think of a table as a "for each" operator or building block. When you connect a table to an element called "LOGICAL_UNIT", think "for each LOGICAL_UNIT". Apart from the header and footer you are actually designing one line or row (remember that this line can consist of several table rows). To change different aspects and edit the table, use your right mouse button. From this menu all properties of a table, cells, columns and rows can be reached. Cells can be merged so one row in the table may contain a different number of cells compared to another row. This is a useful feature when you want to nestle tables. Lets say that you have a four level master detail structure. Create a 5 by 5 table, merge all the cells on the last row, insert a 4 by 4 table in the merged cell and so on. This way you would end up with something like this.
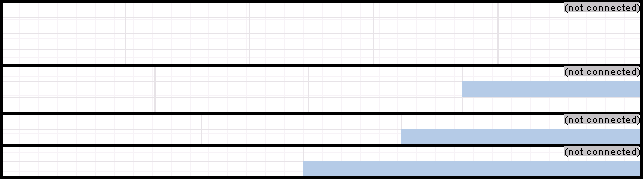
Connect the different tables to the correct levels in the schema/XML and your set to go. Tables can also be placed after one another in the flow section of a page. Using the property panel you can set a number of properties on the table it self, its rows and cells. Things like border style and color can be set as well as controlling page breaks. Note that by pressing the expand button, for each property a wider range of properties will be displayed. The border properties for instance will expand to include top, bottom, left and right border. This way a greater degree of control can be achieved.
Since lines can't be drawn in the flow using the line tool, any lines in the flow sections needs to be created using the border properties of cells and tables. The same goes for creating additional horizontal space between lines. Normally a row does not have a explicit height set. This will result in the height being set to zero (0) when formatted if no content in the cells forces the row height to be greater. If any cells in the row contain any value, the height of row will be big enough to show that object, but if there is no data the height will be set to zero. This means that it's not enough to just create a dividing row between to rows to get some extra space, one needs to set an explicit height as well.
All fields can not be placed anywhere in the layout. When working with tables the rule of thumb would be that master information can be placed at any level, but detail information can not be placed in the master area. If we consider the sample above with the list of logical units per module, this becomes quite obvious. There is nothing stopping me from adding the module name to every logical unit row. Each logical unit resides in one specific module. If we would try it the other way around, trying to add the logical unit name to the module row, we would discover that it is not possible. The reason is obvious, since a module contains several logical units there is no way of knowing which logical unit to show the name for.
If we consider the XML tree structure, for a minute. Fields from which you can step upwards in the tree all the way to the root element without passing any iteration elements can be placed anywhere in the layout, static areas or inside table cells. This is typical header information and as such it is valid anywhere including inside an iteration. An element with the iteration/table icon, ![]() ,must be connected to a table in the layout in order to be able to use the fields included in this element. In a table that is connected to an element in the XML you can add elements/attributes that are child fields/attributes to that particular element or any fields/attributes directly above that element. As long as you do not pass through any iteration/table element on your way down walking the tree, it's ok to add the element to the current level. All this is just to give you an understanding for how the tables work. The tool will prevent you from putting any elements in non legal place in the layout.
,must be connected to a table in the layout in order to be able to use the fields included in this element. In a table that is connected to an element in the XML you can add elements/attributes that are child fields/attributes to that particular element or any fields/attributes directly above that element. As long as you do not pass through any iteration/table element on your way down walking the tree, it's ok to add the element to the current level. All this is just to give you an understanding for how the tables work. The tool will prevent you from putting any elements in non legal place in the layout.
In one special case tables can and should be used in static areas like page headers and footers. To use a table in a static area one needs to create a block and add the table to the block. Tables in static areas can not be connected to anything, so they can not grow and they can not be used to iterate over a number of elements. They are used for purpose and one purpose only. Imagine you have an address and this address consists of 5 address lines (i.e. 5 different elements in the XML). If for instance the 3rd address line doesn't contain any value the address would look a bit odd if only blocks and fields were used. There would be some empty space between line 2 and 4, which isn't what one would want. By creating a table with 5 rows (1 column) and adding the address lines to these cells this would be avoided. This is a consequence of that table rows does not have an explicit height set by default. If none of the 5 rows in the table has any explicit height set, all rows that does not contain any data will get the height zero (0). The effect would be that all the lines of the address will be presented without any additional space between them regardless of if some lines does not have a value or not.
Use of Archive variables
Archive variables are used for storing dynamic data. These can be assigned any value at execution time and is usually created during RDF execution. It is also possible to add them later on, after the data has been assembled. The Print Agent will fetch all archive variables at the time of fetching translations. This will result in the XML header data containing all the archive variables that existed for a particular archive item at the time of printing.
Archive variables are not part of any report model nor are they defined in the database unlike like columns, report texts or report parameters. As a result you will not be able to view them in the generated sample XML file. The sample XML will contain two such commonly used Archive variables companyName and rhSysLogo as examples. Following code segment shows how these variables are defined in a sample XML.
<FA_YEAR_REPORT_REP_ARCHIVE_VARIABLES>
<VARIABLE>
<NAME>companyName</NAME>
<VALUE>My Company Name</VALUE>
</VARIABLE>
<VARIABLE>
<NAME>rhSysLogo</NAME>
<VALUE>C:\temp\logos\CompanyLogo.bmp</VALUE>
</VARIABLE>
</FA_YEAR_REPORT_REP_ARCHIVE_VARIABLES>
To locate Archive variables in your schema look under the <report_id>__ARCHIVE_VARIABLES folder on your schema tree. The schema will only contain a general definition for all Archive variables as <VARIABLE> element containing a <NAME> and <VALUE> element. Therefore, the schema will look the same regardless of the number of archive variables defined in your RDF.
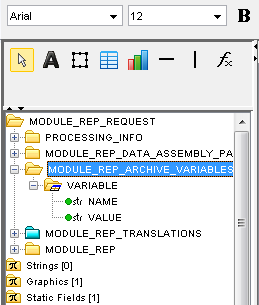
To use Archive variables from the layout one must refer to them by their name using the full XPath. Following is an example of how the Archive variable rhSysLogo is referred using it's XPath.
/tns: <report_id>_REQUEST/tns: <report_id>_ARCHIVE_VARIABLES/tns:VARIABLE[tns:NAME='rhSysLogo']/tns:VALUE
For all other Archive variables simply change the string rhSysLogo of the above XPath to the name of your archive variable and place the XPath in table-cell or block container as required.
User guide
The User guide available in the tool's Help menu contains all documentation related to the IFS Report Designer Layout tool.
Watermarks
Watermark feature enables to work on a report designer layout with a background. For instance any form of image file (except bitmaps) can place as an under layer for a layout and possible to set the size and the position. When you place a watermark on a layout it will repeat for each page starting from first page to the last. To learn more on watermarks read Watermarks.