Debugging PL/SQL code called from IFS Enterprise Explorer
| Step 1 Set up ACL |
For Oracle 12c and forward, new security restrictions exist, ACL (Access Control List) must be set up in the database. To do this, open up a new SQL Command window by using the RMB Execute Command... in database node. Then drag and drop the Grant PL/SQL Debugger Permission in to the SQL Command window that is listed under the Reports and Utilities section in the Palette. Enter the local machine name as the host, and execute the statement. IP-address can also be used, but then the IP-address must be the host when attaching IFS Enterprise Explorer in the step below. If ACL is not set, there will be an error message in the client when trying to do remote debugging. Doing this could have security implications on customer environments. |
* |
|
| Step 2 Fetch source |
Fetch the required code to be debugged from the database using Show Source in Database... menu option on the database node. See Using and Exploring the Database From a plsql file, open the apy file, and from there go to database source, using the RMB option Go to Database Source |
* |
|
| Step 3 Debug Compile |
Once the source code is available in the editor use the right mouse (RMB) menu option Debug Compile to compile the package with the 'DEBUG' option. |
* |
|
| Step 4 Breakpoints |
Place breakpoints on necessary source lines by clicking on the left gutter in the editor.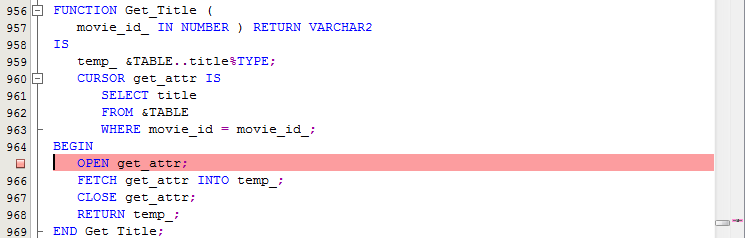 |
* |
|
| Step 5 Start Debugger |
|
* |
|
| Step 6 Attach IFS EE |
|


Note: When debugging PL/SQL code called from IFS Enterprise Explorer it works as follows:
- IFS Developer Studio opens a port and listens for connections initiated from the database.
- Once the debug session is started from the IFS Enterprise Explorer client, the database connects to IFS Developer Studio for debugging.